
In late 2009, FDIC examiners were asked to begin completing the Credit and Consumer Products/Services Survey (Survey) at the conclusion of risk management examinations. Replacing a previous underwriting survey, the revised Survey solicits examiner assessments on the level of risk and quality of underwriting related to nine credit products as well as information on new or evolving banking products and activities, local commercial real estate (CRE) market conditions, and funding practices.
Initial results from the Survey were presented in the Winter 2010 issue of Supervisory Insights1 with a discussion of bank responses to ongoing economic and competitive challenges, including general underwriting trends and out-of-territory lending. The FDIC continues to gather and analyze the Survey data and this article summarizes recent results and provides insights on lending trends and the changing risk profiles of insured institutions.
Approximately 1,200 to 1,400 Surveys are generated by FDIC examiners every six months at insured institutions of varying sizes and types across the country. During 2011, more than 2,700 Surveys were completed. Between October 2009 and year-end 2011, 90 percent of the roughly 4,600 institutions directly supervised by FDIC have been captured by a completed Survey, representing more than half of all insured institutions.
In addition to being communicated through Supervisory Insights, Survey results are made available to FDIC supervisory staff. Survey data are combined with other financial, economic, and examination data so that supervisory staff can better evaluate financial and operational trends, conduct enhanced forward-looking analyses, and make informed decisions regarding supervisory policies, examination scheduling, and examination risk scoping.
Improvements in Credit Risk Profiles
The Survey asks examiners to provide an overall assessment of the credit risk embedded in a bank’s loan portfolio. This risk is reflective of current and past loan underwriting practices, local economic conditions, and other factors. While stresses persist in some loan portfolios exposed to weak real estate markets, the 2011 Survey results indicate that examiners are seeing improving trends in overall credit risk profiles and underwriting practices. These trends reflect the gradual improvement in asset quality at many institutions as they work to recover from the financial downturn.
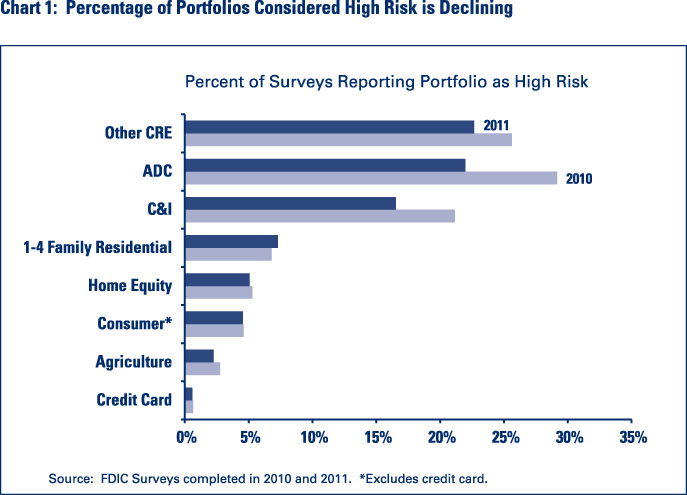
During 2011, the percentage of respondents designating one or more portfolios as “high” risk declined.2 In addition, the percentage of respondents labeling underwriting as “generally liberal” declined, while there was an increase in the percentage of institutions considered to have “generally conservative” underwriting practices.
Examiners noted overall improvement in credit risk profiles across three major loan types. As shown in Chart 1, FDIC examiners characterized risk in the other CRE3 portfolio as “high” in 23 percent of Surveys completed in 2011, down from 26 percent in 2010. The percentage of acquisition, development, and construction (ADC) portfolios assessed as “high” risk dropped from 29 percent in 2010 to 22 percent in 2011, and the percentage of “high” risk commercial and industrial (C&I) portfolios declined from 21 percent to 16 percent. The percentage of “high” risk designations in 2011 among the other six loan types remained low and relatively unchanged from 2010.
Examiners also are citing fewer instances of liberal lending.4 During 2011, C&I had the highest percentage of respondents characterizing underwriting practices as “generally liberal” with 11 percent, down from 13 percent in 2010. The percentage for CRE dropped from 12 percent in 2010 to 10 percent in 2011, and ADC declined from 14 percent to 9 percent. Similar to 2010, less than 5 percent of the Surveys identified “generally liberal” underwriting practices in the other six loan types.
The Survey also includes questions addressing lending practices that may present elevated risk to an insured institution. Although less common in 2011 than 2010, such practices continue to occur most frequently in ADC lending. Respondents identified four higher-risk practices associated with construction lending that were being conducted frequently enough to warrant notice or as a standard practice by more than 20 percent of surveyed institutions (see Table 1). A common characteristic among these practices is an over-reliance on sale of collateral for repayment. During periods of expansion when market conditions are strong, projects are completed and loans paid as agreed. However, as was evidenced during the recent economic downturn, many ADC loans became nonperforming as developers could not generate sales and alternative repayment sources were often limited or nonexistent.
| Table 1: Higher-Risk Practices are Most Common in ADC Lending | ||
| Higher-Risk Acquisition, Development, and Construction Practices | ||
| 2010 | 2011 | |
| Funding projects on a speculative basis (i.e. without meaningful pre-sale, pre-lease, or take-out commitments) | 31% | 22% |
| Funding loans without consideration of repayment sources other than sale of the collateral | 30% | 24% |
| Failing to verify the quality of alternative repayment sources | 34% | 28% |
| Use of unrealistic appraisal values relative to the current economic conditions and/or the performance observed in similar credits | 27% | 22% |
Loan Underwriting Mostly Unchanged or Tighter in 2011
Another purpose of the Survey is to elicit examiners’ views on whether the institution has tightened or loosened its underwriting standards since the last examination. This insight supplements assessments of the overall risk profile by identifying areas where credit risk may be increasing or decreasing. These results reinforce the results in the previous section that both the level and direction of credit risk industry-wide are generally decreasing (again, noting continued stress in some loan portfolios that are exposed to weak real estate markets).
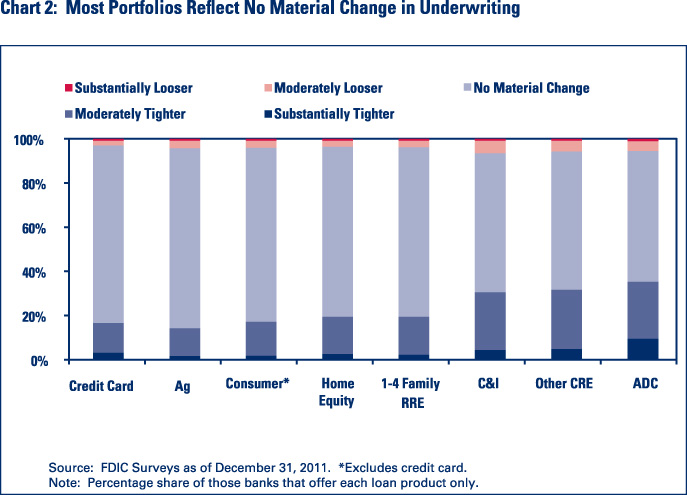
For the examinations captured in the Survey during 2011, roughly 65 percent of respondents indicate there has been no material change in loan underwriting practices since the last examination. However, when examiners did report a change in underwriting practices, a greater percentage of institutions were viewed as tightening rather than loosening their underwriting standards (see Chart 2 for data about changes in underwriting for the nine loan types).
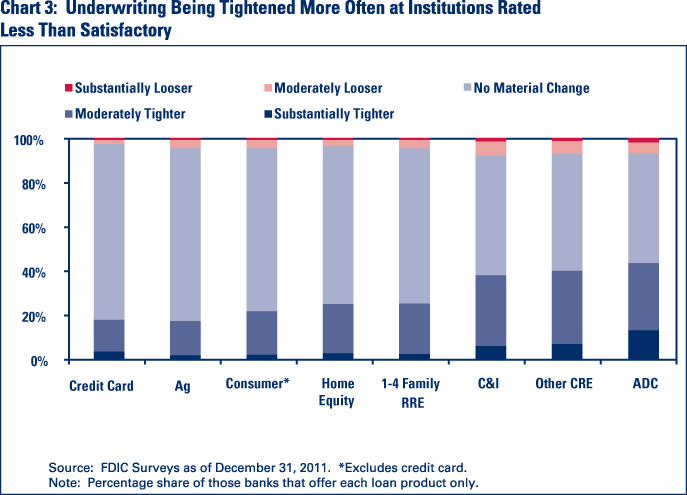
As reflected in Chart 3, the percentage of institutions that are tightening standards is higher for institutions assigned a less than satisfactory composite rating of “3,” “4,” or “5” under the Uniform Financial Institutions Rating System (UFIRS).5 Similar to Survey findings in 2010, Surveys completed in 2011 indicate that more institutions tightened rather than loosened loan underwriting standards, most notably in the commercial-related portfolios (C&I, ADC, and other CRE). As of Spring 2012, informal observations from examiners and industry participants suggest that the ongoing trend toward tighter underwriting observed in 2010 and 2011 may be nearing an end. We will continue to monitor these trends.
The primary factors influencing changes in underwriting practices are economic conditions, the financial condition of individual banks, and responses to regulatory observations. An institution that is financially stressed or operating in a market that is suffering economically often responds by tightening credit standards. A similar response occurs when a bank faces unfavorable regulatory findings, ratings, or enforcement actions.
Loan Workouts on the Rise
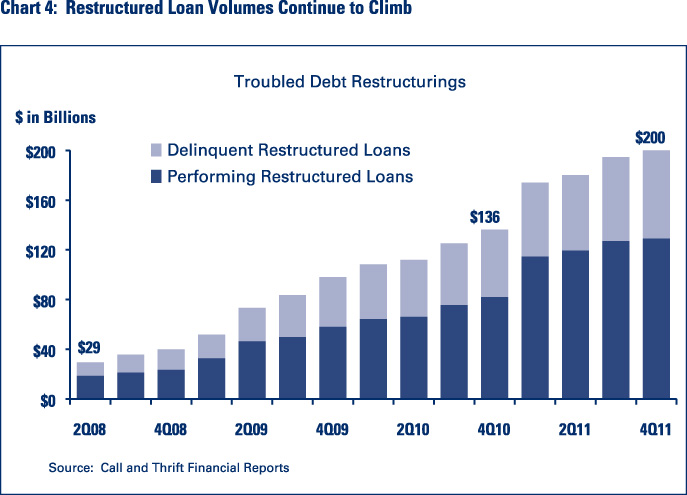
Increased use of loan workouts by insured depository institutions shows that lenders are actively working with borrowers who have been adversely affected by weak economic and real estate market conditions. Interagency supervisory guidance6 encourages lenders to work with borrowers having difficulty making payments but who have the willingness and capacity to repay their debts. As reflected in Chart 4, greater use of workouts has resulted in an increase in the volume of troubled debt restructurings (as required by financial reporting standards), including past-due troubled debt restructurings, since the start of the economic downturn.
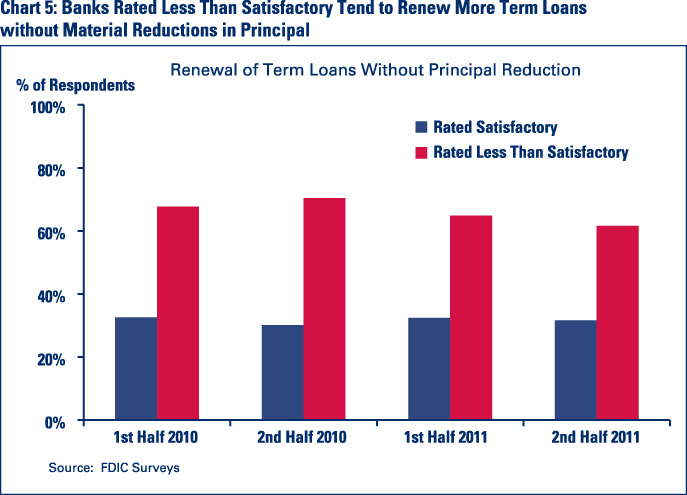
Similar to Survey findings in 2010, Surveys completed in 2011 found that when examiners had concerns with loan workouts, their concerns often focused on situations where loans were renewed without a material reduction in principal. For example, nearly half of the Survey respondents noted that lenders are renewing term loans without requiring a material principal reduction. For institutions with a less than satisfactory7 UFIRS composite rating, the percentage is closer to 60 percent (see Chart 5).
When working with a troubled borrower, renewal of a term loan can in some instances be the best way to obtain recoveries for the lender. Interagency guidance states that the workout should be part of an overall repayment program. As discussed in the Policy Statement on Prudent Commercial Real Estate Loan Workouts8 (Policy Statement), workouts including loan renewals are appropriate when used to improve the lender’s prospects for repayment of principal and interest and are consistent with sound banking, supervisory, and accounting practices. The Policy Statement also emphasizes that in loan workout situations, the lender should develop a workout plan after analyzing the borrower’s repayment capacity, evaluating the support provided by guarantors, and assessing the collateral pledged before granting a renewal.
Modest Recovery in Loan Growth
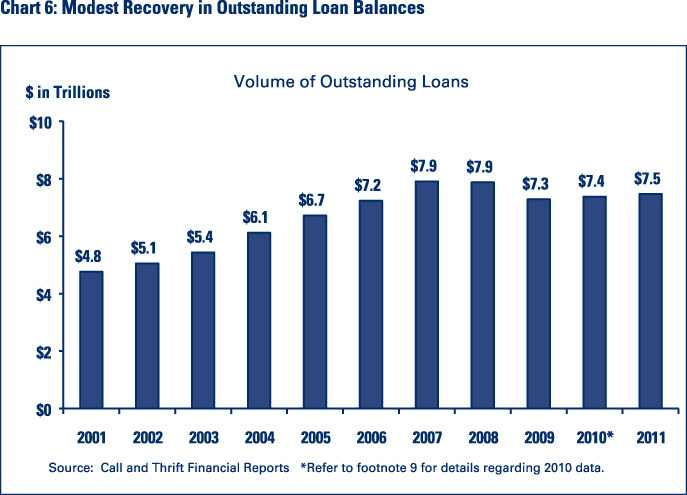
Aggregate loan balances for all insured institutions displayed a “boom-bust” pattern during the past decade. Outstanding loans grew steadily from 2001 to a peak in mid-2008, and then began to fall as a result of the financial crisis (see Chart 6).9 Fueled by rapid expansion of the housing market, ADC loans along with residential mortgage loans were largely responsible for the rapid growth in loan balances from 2005 to 2008. Overall strength in the U.S. economy also led to expanded C&I loan balances during this period. The trend quickly reversed from late 2008 through 2010 as the collapse of the credit and housing markets halted residential mortgage originations and ADC lending. In particular, ADC loan balances have declined approximately 60 percent from the peak in first quarter 2008 due to a lack of new construction activity combined with write-downs and transfer of problem ADC loans to other real estate (ORE).
Banking industry data indicate a gradual turnaround in lending activity during the past several quarters.10 Although a majority of insured depository institutions continued to report shrinking loan balances in their Call and Thrift Financial Reports during 2011, more than 40 percent expanded their loan portfolios. In contrast, during the three-year pre-crisis period of 2004 to 2006, approximately 80 percent of institutions were growing their loan portfolios.
As reflected in the FDIC’s fourth quarter 2011 Quarterly Banking Profile, C&I lending is largely responsible for recent aggregate loan growth. During 2011, C&I loans grew $161 billion, or nearly 14 percent, followed by growth in Other Loans of $55 billion or 21 percent. For some types of lending, growth did not occur until the second half of 2011. For example, although 1-4 family residential mortgage balances declined nearly $22 billion in 2011, they grew $49 billion or 2.7 percent during the last six months of the year. Consumer loans also expanded during the same period, up $18 billion or 1.4 percent.
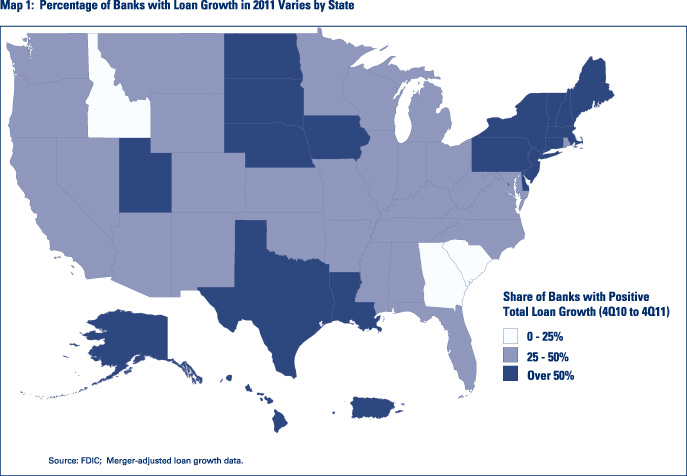
Again, based on Call and Thrift Financial Report data, loan growth has a pronounced geographic component. Some sections of the country appear to be having more success with loan growth than other areas. During 2011, more than half the institutions in several energy-producing states, along with those in the Great Plains and Northeast, reported loan growth while the remaining states had less than 50 percent of their institutions expanding loan balances during the year (see Map 1).
Overall Survey findings indicate that most institutions materially growing their portfolios are doing so in a prudent manner. Specifically, for banks generating loan growth of at least 10 percent during 2011, the associated risk was characterized by Survey respondents as “high” at only 5 percent of the institutions. Examiners characterized the risk as “low” in approximately one-third of the Surveys and “medium” in more than 40 percent of the Surveys. The remaining institutions had not made significant changes in lending activity since the previous examination.
Factors Affecting Lending Activity
As noted earlier in this article, economic conditions tend to have the greatest impact on lending activity, both for commercial- and consumer-related lending. We have witnessed the effect of the recent economic crisis on loan portfolios, particularly ADC portfolios, as they declined substantially at many banks from 2008 to 2010. As the Survey results from 2010 and 2011 indicate, when underwriting practices for C&I, CRE, and ADC lending were adjusted, the changes were made in response to economic conditions at approximately one-third of the institutions, while about one-fifth of the institutions modified their residential mortgage and consumer lending practices.
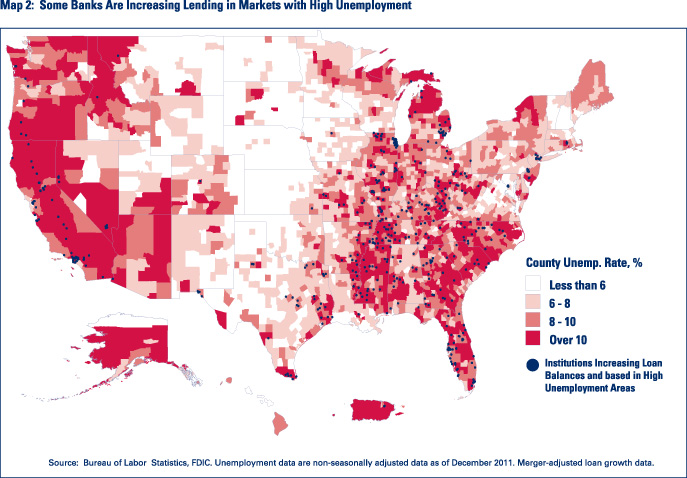
As expected, loan growth is most commonly found at institutions operating in markets that are growing economically. However, one possible indicator of a broader recovery in lending is that some banks currently operating in markets experiencing weak economic conditions are also expanding their loan portfolios. For example, there are banks reporting loan growth in areas that have high levels of unemployment. Specifically, more than one-third of banks headquartered in counties with a December 2011 unemployment rate of at least 10 percent grew loan balances during 2011. As illustrated in Map 2, these institutions have been generating loan growth in many distressed markets, including states such as Florida, Georgia, Michigan, and California. For the most part, these banks have been growing their CRE, C&I, and/or residential mortgage portfolios using various methods including in-market originations, bank/branch acquisitions, and hiring established lenders who bring loan relationships with them. Survey results indicate that few of these institutions are using out-of-area lending to generate loan growth.
A weakened financial condition characterized by shrinking capital, poor earnings, tight liquidity, and elevated level of problem assets also is a significant obstacle to some financial institutions’ efforts to lend. Approximately 16 percent of Surveys completed during 2010 and 2011 reported that as a result of a change in financial condition, lending activity was modified through C&I, CRE, and ADC underwriting changes.
And finally, examination findings, UFIRS ratings, and enforcement actions also may prompt changes in an institution’s underwriting practices, although such situations tend to be closely associated with institutions whose financial condition is deteriorating. For those banks with a less than satisfactory CAMELS composite rating of “3,” “4,” or “5,” approximately 29 percent of Surveys completed in 2011 indicate that lending activity was modified through changes to C&I, CRE, and ADC underwriting practices in response to bank regulatory findings/actions. This percentage is closer to 13 percent for banks satisfactorily rated “1” or “2.”
Conclusion
Survey results from 2010 and 2011 indicate that insured institutions were generally reducing their credit risk profiles, especially in their ADC, C&I, and CRE portfolios, and that a greater number of institutions were tightening rather than loosening underwriting practices. However, recent informal observations from examiners and industry participants suggest that the trend toward tighter loan underwriting may be nearing an end. We will continue to review and analyze Survey results to see if the trend in 2010 and 2011 has begun to shift toward a greater number of institutions easing their credit standards.
Lenders also are addressing credit risk through increased use of loan workouts for distressed borrowers. Supervisory guidance encourages prudent workouts as a way for lenders to work with borrowers. In some instances, however, examiners have had a concern with banks that are addressing problem term loans through renewals without material principal reduction or a plan for repayment.
Against a backdrop of generally more prudent loan underwriting, overall lending activity increased slightly during 2011. Although more than half the insured institutions reported a decline in loan balances for the year, a substantial number grew their loan portfolios. Led by an increase in C&I lending, there is evidence of loan growth in many markets across the country, including some areas hardest hit by the financial downturn. The same factors - economic conditions, financial health of the institution, and responses to regulatory observations - appear to have influenced changes in underwriting as well as overall lending activity at most institutions captured in the Survey during 2011.
Analysis of results from the Credit and Consumer Products/Services Survey, in tandem with other financial and economic data, will enable the FDIC to continue effective monitoring of the overall financial condition of insured financial institutions, particularly changes in their lending activity and credit risk profiles.
Jeffrey A. Forbes
Senior Examination Specialist
jforbes@fdic.gov
Margaret M. Hanrahan
Senior Examination Specialist
mhanrahan@fdic.gov
Andrea N. Plante
Senior Quantitative Risk Analyst
aplante@fdic.gov
Paul S. Vigil
Senior Management Analyst
pvigil@fdic.gov
1 Jeffrey A. Forbes, David P. Lafleur, Paul S. Vigil, and Kenneth A. Weber “Insights from the FDIC’s Credit and Consumer Products/Services Survey,” Supervisory Insights, Winter 2010. http://www.fdic.gov/regulations/examinations/supervisory/insights/siwin10/index.html.
2 The Survey asks examiners to describe the risk in nine loan portfolios as “low,” “moderate,” or “high.” The nine portfolios are commercial and industrial, construction, permanent commercial real estate, residential mortgage, home equity, reverse mortgage, agricultural, consumer, and credit card.
3 Permanent CRE loans, which includes all CRE loans except for acquisition, development, and construction (ADC) loans.
4 The Survey asks examiners to characterize current underwriting practices in the nine loan portfolios as “generally conservative,” “about average,” or “generally liberal.”
5 Under the UFIRS, each institution is assigned a composite CAMELS rating based on an evaluation and rating of the following component factors: adequacy of Capital, quality of Assets, capability of Management, quality and level of Earnings, adequacy of Liquidity, and Sensitivity to market risk.
6 FIL-61-2009, Policy Statement on Prudent Commercial Real Estate Loan Workouts, October 30, 2009. http://www.fdic.gov/news/news/financial/2009/fil09061.html.
7 Less than satisfactory refers to a CAMELS composite rating of “3,” “4,” or “5.”
8 See Footnote 6.
9 FASB Statements 166 and 167 resulted in the consolidation of large amounts of securitized loan balances back onto banks’ balance sheets in the first quarter of 2010. Although the total amount consolidated cannot be precisely quantified, the industry would have reported a decline in loan balances for the quarter absent this change in accounting standards.
10 FDIC. Quarterly Banking Profile, Fourth Quarter 2011, https://www.fdic.gov/analysis/quarterly-banking-profile/fdic-quarterly/.