
FDIC-Insured Institutions Reported Return on Assets of 1.27 Percent and Net Income of $79.3 Billion in Third Quarter 2025
- Net Income Increased from the Prior Quarter, Led by Lower Provision Expense and Higher Net Interest Income
- Community Bank Net Income Increased from the Prior Quarter
- Net Interest Margin Increased from the Prior Quarter
- Asset Quality Metrics Remained Generally Favorable, Though Weakness in Certain Portfolios Persisted
- Loan Growth Continued from the Prior Quarter
- Domestic Deposits Increased for the Fifth Consecutive Quarter
- The Deposit Insurance Fund Reserve Ratio Increased 4 Basis Points to 1.40 Percent
WASHINGTON—The Federal Deposit Insurance Corporation (FDIC) today released the results of its latest Quarterly Banking Profile, a comprehensive summary of financial results based on reports from 4,379 insured commercial banks and savings institutions. In the third quarter 2025, insured depository institutions reported a return on assets (ROA) ratio of 1.27 percent and aggregate net income of $79.3 billion, an increase of $9.4 billion (13.5 percent) from the prior quarter. Strong net interest income growth and a reduction in provision expense, primarily related to last quarter’s large bank acquisition, drove the quarterly increase in earnings.
Highlights from the Third Quarter 2025 Quarterly Banking Profile
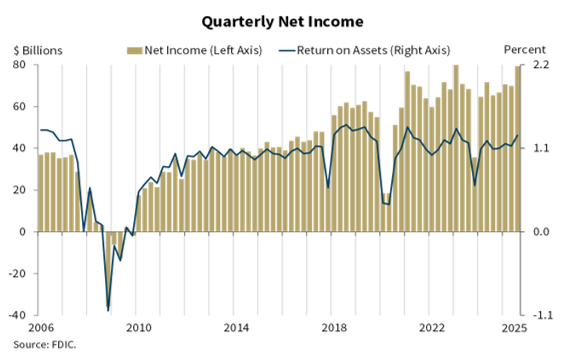
Net Income Increased from the Prior Quarter, Led by Lower Provision Expense and Higher Net Interest Income: For the 4,379 FDIC-insured commercial banks and savings institutions quarterly net income totaled $79.3 billion, up $9.4 billion (13.5 percent) from the prior quarter. The banking industry reported an aggregate ROA of 1.27 percent in third quarter 2025, up from 1.13 percent in second quarter 2025 and 1.09 percent in the year-ago quarter. The quarterly increase in net income was driven by lower provision expense (down $9.2 billion, or 30.7 percent) and higher net interest income (up $7.6 billion, or 4.2 percent), which were offset by higher income taxes (up $5.0 billion, or 30.1 percent) and higher noninterest expense (up $2.9 billion, or 1.9 percent). The quarterly decrease in provision expense was largely attributable to expenses associated with the acquisition of one large bank in the prior quarter. Absent this large provision expense, net income still would have increased, as the industry experienced a $7.6 billion increase in net interest income and a $1.1 billion increase in noninterest income.
Community Bank Net Income Increased from the Prior Quarter: Quarterly net income for the 3,953 community banks insured by the FDIC totaled $8.4 billion in the third quarter, an increase of $756.9 million (9.9 percent) from second quarter 2025. The community bank pretax ROA increased 13 basis points from last quarter to 1.46 percent. Higher net interest income (up $958.5 million, or 4.1 percent) and noninterest income (up $371.1 million, or 7.1 percent) offset increases in noninterest expense (up $303.0 million, or 1.7 percent).
Quarterly Net Interest Margin Increased from the Prior Quarter: The industry reported a quarterly increase in net interest income (up $7.6 billion, or 4.2 percent), as interest income accelerated more than interest expense. The net interest margin (NIM) increased by 9 basis points to 3.34 percent, which is above the pre-pandemic average of 3.25 percent.1 The community bank NIM of 3.73 percent increased 10 basis points from the prior quarter, increasing for the sixth consecutive quarter, and is above the pre-pandemic average of 3.63 percent.
Asset Quality Metrics Remained Generally Favorable, Though Weakness in Certain Portfolios Persisted: Past-due and nonaccrual (PDNA) loans, or loans that are 30 or more days past due or in nonaccrual status, remained the same as the prior quarter at 1.49 percent of total loans. The industry’s PDNA ratio is well below the pre-pandemic average of 1.94 percent. The PDNA rate for non-owner-occupied commercial real estate (CRE), multifamily CRE, auto, and credit card portfolios remain well above their pre-pandemic averages.
The industry’s net charge-off ratio of 0.61 percent increased 1 basis point from the prior quarter but is 5 basis points lower than the year-ago quarter. This ratio is 13 basis points above the pre-pandemic average, but significantly below the peaks during the Great Financial Crisis. Likewise, most portfolios have net charge-off rates above their pre-pandemic averages.
Loan Growth Continued from the Prior Quarter: Total loan and lease balances increased $159.0 billion (1.2 percent) from the prior quarter. Loans to non-depository financial institutions (NDFIs) and loans to purchase or carry securities, including margin loans, had the largest dollar increase among loan categories reported. Some of this increase was due to continued reclassifications following changes to how certain loan products should be reported. In addition, increases in consumer and nonfarm nonresidential CRE loans contributed to the industry’s quarterly loan growth. The industry’s annual rate of loan growth in the third quarter was 4.7 percent, below the pre-pandemic average of 4.9 percent.
Total loans at community banks increased 1.3 percent from the prior quarter and 5.2 percent from the prior year, led by increases in nonfarm nonresidential CRE loans and 1-4 family residential mortgage portfolios.
Domestic Deposits Increased for the Fifth Consecutive Quarter: Domestic deposits increased $92.2 billion (0.5 percent) from second quarter 2025, rising for a fifth consecutive quarter. Estimated uninsured domestic deposits drove the increase, up $88.6 billion (1.1 percent) from the prior quarter.
The Deposit Insurance Fund Reserve Ratio Increased 4 Basis Points to 1.40 Percent: In the third quarter, the Deposit Insurance Fund balance increased $4.8 billion to $150.1 billion. The reserve ratio increased 4 basis points during the quarter to 1.40 percent.
The Total Number of Insured Institutions Declined: The total number of FDIC-insured institutions declined by 42 during the third quarter to 4,379. During the quarter, four banks were sold to uninsured institutions and 38 institutions merged or consolidated with other banks.
| 1 | The “pre-pandemic average” is the average from first quarter 2015 through fourth quarter 2019. |