
Selected Financial Data - Second Quarter 2019
| Jun-19 | Mar -19 | Quarterly Change | Jun -18 | Year-Over-Year Change |
|---|---|---|---|---|---|
| FSLIC Resolution Fund | |||||
| Cash and cash equivalents | $912 | $907 | $5 | $892 | $20 |
| Accumulated deficit | (124,576) | (124,582) | 6 | (124,597) | 21 |
| Total resolution equity | 913 | 908 | 5 | 893 | 20 |
| Total revenue | 11 | 5 | 6 | 7 | 4 |
| Operating expenses | 0 | 0 | 0 | 0 | 0 |
| Losses related to thrift resolutions | 0 | 0 | 0 | 0 | 0 |
| Net Income (Loss) | $11 | 5 | 6 | $7 | $4 |
$ in millions | DIF | FRF | ALL FUNDS | ||||||
|---|---|---|---|---|---|---|---|---|---|
| Jun-19 | Jun-18 | Change | Jun-19 | Jun-18 | Change | Jun-19 | Jun-18 | Change | |
| Total Receiverships | 263 | 302 | (39) | 0 | 0 | 0 | 263 | 302 | (39) |
| Assets in Liquidation | $1,039 | $1,536 | ($497) | $ 2 | $ 2 | $ 0 | $1,041 | $1,538 | $(497) |
| YTD Collections | $555 | $993 | ($438) | $ 0 | $ 0 | $ 0 | $555 | $993 | ($438) |
| YTD Dividend/Other Pmts - Cash | $859 | $2,448 | ($1,589) | $ 0 | $ 0 | $ 0 | $859 | $2,448 | $(1,589) |
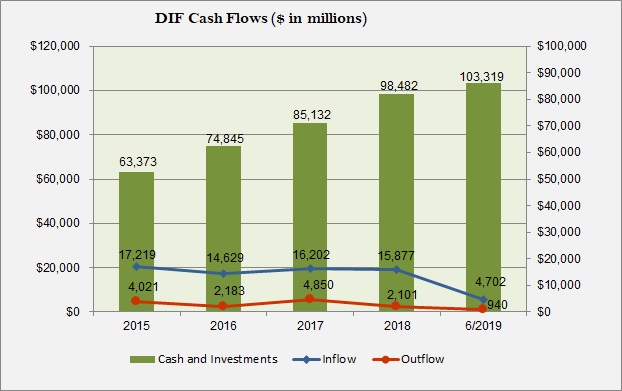
| Cash and Investments | Inflows | Outflow |
|---|---|---|---|
| 2015 | 63,373 | 17,219 | 4,021 |
| 2016 | 74,485 | 14,629 | 2,183 |
| 2017 | 85,132 | 16,202 | 4,850 |
| 2018 | 98,482 | 15,877 | 2,101 |
| 6/2019 | 103,319 | 4,702 | 940 |
Cash and Investments increased by $39.9 billion from $63.4 billion at year-end 2015 to $103.3 billion at June 30, 2019. The increase was primarily due to assessment collections, interest on U.S. Treasury securities, and recoveries from resolutions, that far exceeded resolution-related outlays and operating expenses.