Selected Financial Data - Second Quarter 2024
| $ in millions | DIF | ||
|---|---|---|---|
| Jun 24 | Jun 23 | Change | |
| Total Receiverships | 61 | 119 | (58) |
| Assets in Liquidation | $36,156 | $201,946 | ($165,790) |
| YTD Collections | $47,467 | $22,024 | $25,443 |
| YTD Dividend/Other Pmts - Cash | $47,609 | $40,074 | $7,535 |

| UST Overnight Investments market value | Investments in UST Securities market value | |
|---|---|---|
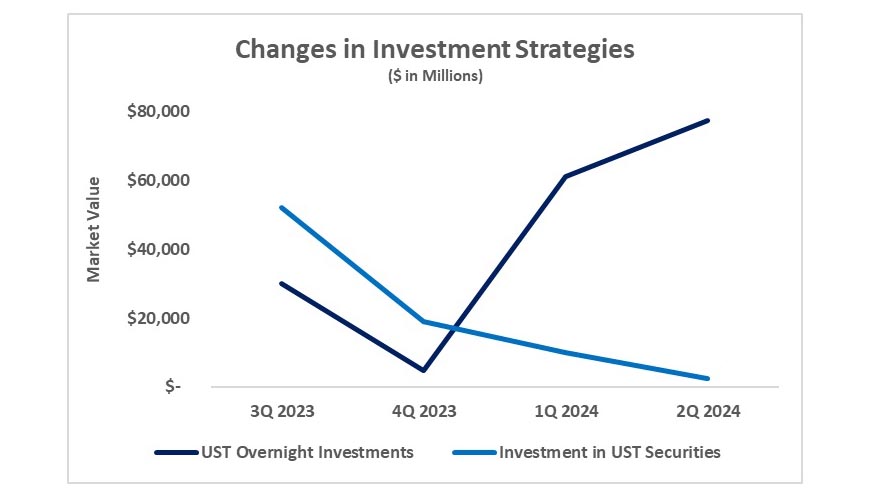
| 3Q2023 | $30,198 | $52,215 |
| 4Q2023 | $4,816 | $18,929 |
| 1Q2024 | $61,033 | $9,953 |
| 2Q2024 | $77,431 | $2,497 |
Over the last year, as the Treasury portfolio matured, cash was invested in the overnight securities, rather than reinvested in longer term assets. With the inverted yield curve and obligations from bank failure activity, the returns of the overnight rate were greater than any other tenor and allowed for greater flexibility. As market participants are now expecting the Federal Reserve to cut rates this year, the third quarter of 2024 will see some longer duration purchases.
