
Introduction
Loans comprise the majority of most banks’ assets, and therefore drive revenues, profitability and capital formation. Further, lending by insured institutions plays a vital role in supporting credit creation and economic activity across the country. Historically, institutions with management teams and boards that have effectively and prudently managed loan growth have been better positioned to withstand periods of stress and continue serving their local economies throughout the economic cycle. Managing the loan portfolio consumes much time and attention from an institution’s board of directors and management team, and establishing and overseeing lending policies is a critical responsibility of an institution’s board.
Nevertheless, experience has shown that the seeds of future problems are sown in good times. Now is the time to pay attention to long-standing principles of good risk-management practices and to get ahead of and correct loan underwriting and administration problems before they adversely affect the bottom line. As described later in this article, institutions with concentrated portfolios are experiencing more rapid loan growth rates than the rest of the industry. At the same time, FDIC examiners have noted some loan underwriting, administration, and portfolio-management problems at concentrated banks.
This article examines growth on banks’ balance sheets, trends in credit risk, and principles of sound risk management practices. The article focuses on three loan categories: commercial real estate (CRE), agricultural (Ag), and oil and gas-related (O&G) lending. These loan categories have been selected because of their trends, such as growth and volatility in underlying fundamentals, and their importance to the institutions the FDIC supervises. Readers should not construe this discussion as a negative view of any lending category nor as a view that the FDIC is not monitoring trends in and risk management practices relevant to other loan categories.
Trends in Credit Risk Overview
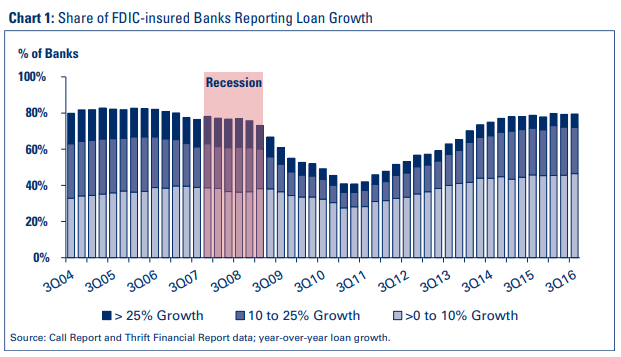
As of September 30, 2016, year-overyear growth in total loan balances for insured institutions was 6.8 percent. Moreover, a large majority, nearly 80 percent, of insured institutions grew their loan portfolios in the third quarter of 2016, not far off of the peak of nearly 83 percent for the second quarter 2005 (See Chart 1). Rapid loan growth is occurring at many banks, although not to the extent that occurred in the lead-up to the 2008 financial crisis; nearly 33 percent of institutions grew their loan portfolios in excess of 10 percent year-over-year as of September 30, 2016, compared to 48 percent as of June 30, 2005 (See Chart 1). The loan growth trend is consistent with the continuing economic recovery and is coming from low levels just after the recession.
Call Report data show that the percentage of banks with potential concentrations in, and high growth of, CRE and Ag loans has increased. From year-end 2013 through the third quarter 2016, roughly one-third of all banks reported total CRE or total Ag loans greater than 300 percent of total capital. Of these banks, the percentage with a three-year growth rate in excess of 50 percent in either portfolio had increased from 23 percent at year-end 2013 to more than 35 percent as of the third quarter 2016. Call Report data do not specifically capture O&G lending, but many banks are located within regions and localities that are heavily dependent on energy-related industries, some of which could be expected to have substantial direct and/or indirect exposures to those industries in their commercial and industrial, CRE, consumer, and/or other loan portfolios.
It is important to understand that the lending concentration percentages and loan growth rates just described are not regulatory limits. Concentrations are not inherently problematic and are a part of doing business for many banks, particularly smaller institutions. However, concentrations add a dimension of risk that management must consider when formulating strategic plans and risk-management policies. Management’s ability to diversify the balance sheet may be limited by geographic or economic factors. In other instances, management may choose a specific business model or product line that results in concentrations. When management cannot or does not achieve reasonable diversification, risk-management programs that may otherwise be adequate may require increased oversight; stronger creditand liquidity-management practices; enhanced management information systems and reporting; more robust loan review and allowance for loan and lease losses (ALLL) policies and practices; and possibly, higher capital levels.
Commercial Real Estate
CRE lending can be a profitable business line for insured institutions that select and underwrite risks prudently and oversee portfolios diligently, and many institutions maintain concentrations in CRE loans. The FDIC recognizes that many institutions manage concentrations in CRE loans well. History, however, has also demonstrated that CRE, particularly the acquisition, development and construction (ADC) subset, is susceptible to cyclical, competitive, and other, sometimes unanticipated, factors that can quickly knock supply and demand out of balance, ultimately resulting in significant losses for many institutions. In fact, the FDIC Community Bank Study showed that, over a 26-year time period, community institutions specializing in CRE lending were the most likely among other types of lending specialists to fail, with a failure rate of 2.25 times that of the average community bank.1
Other studies have shown that for institutions with concentrations, the ability to withstand such market changes will depend heavily on the adequacy of their risk-management practices and capital levels.
To illustrate, in the Comprehensive Study on the Impact of the Failure of Insured Depository Institutions,2 the FDIC Inspector General noted that the most common contributing causes of bank failures during the 2008 financial crisis were “the institutions’ management strategy of aggressive growth that concentrated assets in CRE and ADC loans, often coupled with inadequate risk management practices for loan underwriting, credit administration, and credit quality review.” According to this study, a number of these banks concentrated in CRE and ADC also relied on “volatile funding sources” to support their growth.
Moreover, the FDIC Inspector General’s Acquisition, Development, and Construction Loan Concentration Study3 found that “some institutions with ADC concentrations were able to weather the recent financial crisis without experiencing a corresponding decline in their overall financial condition. The factors that contributed to their survival validate the point that regulators have emphasized and reiterated for years – a well informed and active Board, strong management, sound credit administration and underwriting practices, and adequate capital are important in managing ADC concentrations in a safe and sound manner. In addition, the banks in the study did not rely on brokered deposits to fund growth…” This study also indicated that “management’s responsiveness to supervisory concerns was a key differentiating factor between banks that failed and the turn-around banks we reviewed.”
CRE Market Conditions
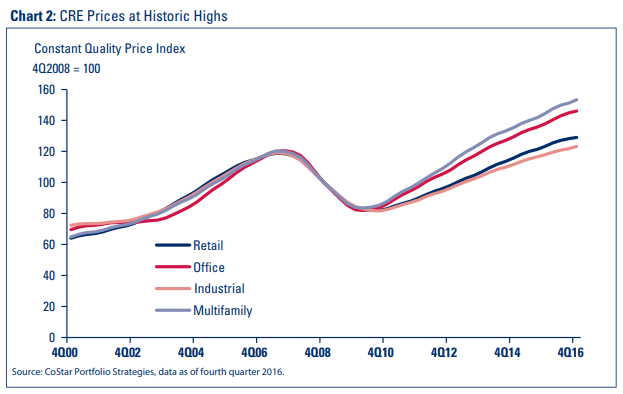
CRE market data show that as the economic recovery progresses, demand for CRE has continued to be strong, resulting in CRE property values at historic peaks (See Chart 2).
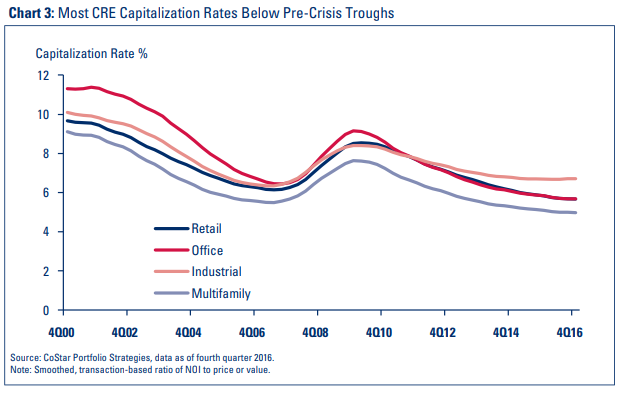
Given the strong demand and low interest rate environment, most capitalization rates for CRE are below pre-crisis troughs (See Chart 3).
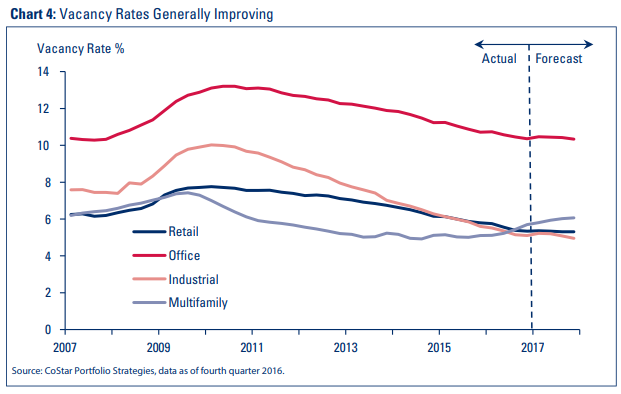
Despite very strong growth in the CRE loan market, which includes refinancings of existing properties as well as new properties coming on line, CRE vacancy rates have been generally improving, although vacancy rates in the multifamily segment have recently experienced a slight increase (See Chart 4 and inset box on page 7).
| As of September 30, 2016, multifamily loan balances at FDIC-insured institutions had grown nearly 94 percent in the past 10 years and comprised almost 18 percent of all CRE loan balances held by banks versus about 12 percent 10 years ago. Given rapid multifamily unit supply growth in some markets, it is increasingly important to monitor demand for units in those markets versus the inventory of rentable units. As demand slows in certain markets, those markets may not be able to absorb the excess supply as quickly as projected, resulting in higher vacancy rates and lower-than-projected cash flows. |
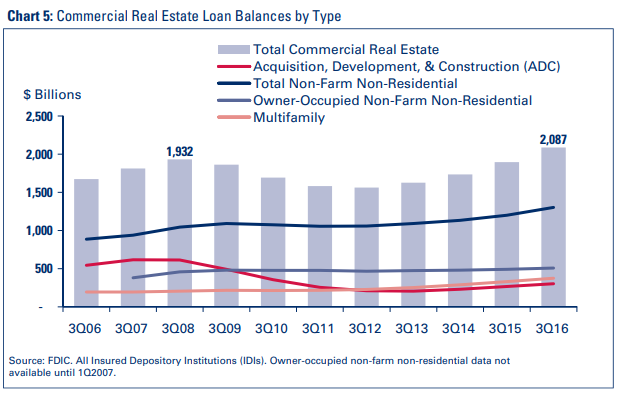
With the increased demand, banks’ CRE balances are growing. As of September 30, 2016, total CRE loans on banks’ balance sheets reached $2.0 trillion, surpassing the peak volume of $1.9 trillion experienced in 2008 (See Chart 5). Recent growth in the CRE portfolio has been spread across the various types of CRE tracked by the Call Reports.4 Non-farm, non-residential balances make up the largest portion of the CRE portfolio at $1.3 trillion, up 8.4 percent from the prior year.
Financial Trends for Banks with CRE Concentrations
To identify institutions with potential CRE loan concentration risk, this article uses the supervisory criteria contained in the 2006 interagency guidance entitled Concentrations in Commercial Real Estate Lending, Sound Risk Management Practices (2006 Guidance).5 The 2006 Guidance states:
“An institution that has experienced rapid growth in CRE lending, has notable exposure to a specific type of CRE, or is approaching or exceeds the following supervisory criteria may be identified for further supervisory analysis of the level and nature of its CRE concentration risk:
- Total reported loans for construction, land development, and other land represent 100 percent or more of the institution’s total capital; or
- Total commercial real estate loans as defined in this Guidance represent 300 percent or more of the institution’s total capital, and the outstanding balance of the institution’s commercial real estate portfolio has increased by 50 percent or more during the prior 36 months.”6
At the end of the third quarter 2016, there were 521 FDIC-insured institutions that met one or both of the two criteria set forth in the 2006 Guidance (See Chart 6); 330 banks met the first criterion (ADC) and 266 met the second criterion (CRE growth).
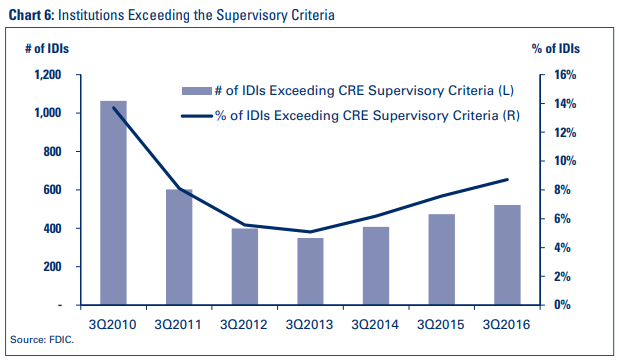
There were 75 institutions that met both criteria. Hereafter, the 521 institutions are collectively referred to as “institutions exceeding the supervisory criteria.” While the total number of institutions exceeding the supervisory criteria is still well below the level observed in 2010, it has increased from 474 in the third quarter 2015 and 350 in the third quarter 2013.
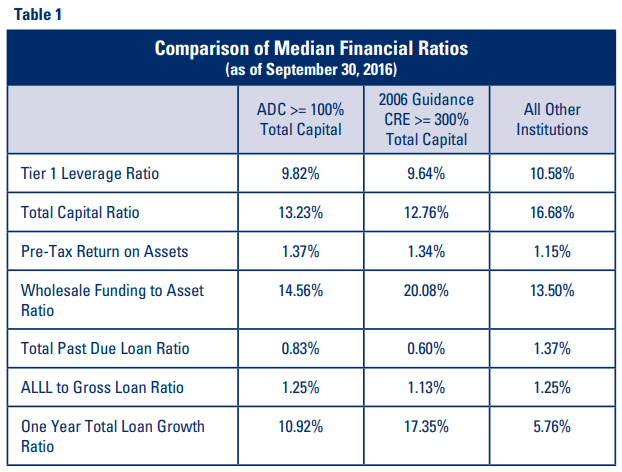
Financial metrics for institutions exceeding the supervisory criteria are displayed in this article as medians to reflect the “typical” institution in these categories rather than as averages, which can be distorted by outliers. At the median, institutions exceeding the supervisory criteria currently reflect higher pre-tax return on assets (ROA) than other institutions, but are operating with a generally higher-risk profile by a number of measures. Specifically, these institutions have lower leverage capital ratios, lower total risk-based capital ratios, and higher wholesale funding 7 to assets ratios (Table 1). Reliance on wholesale funding was a contributing factor for failures in the last crisis.
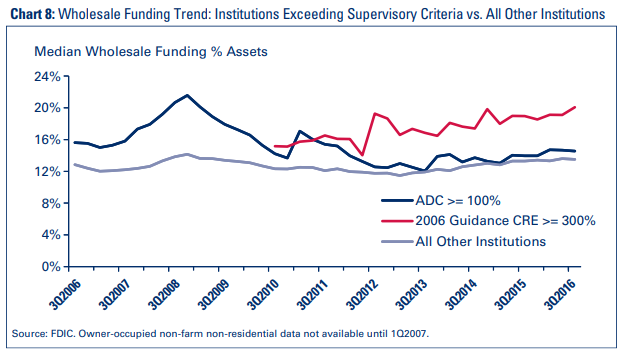
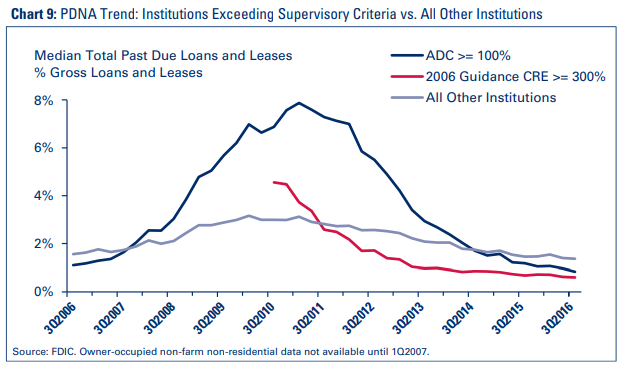
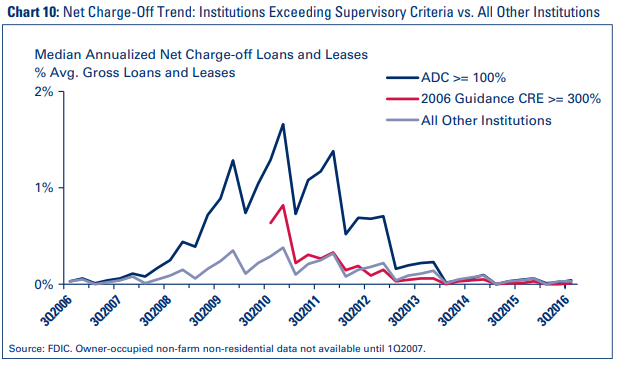
As also shown in Table 1, institutions exceeding the supervisory criteria, as a group, are exhibiting faster loan growth than other institutions. Growth in new loans can mask building risk because it typically drives down a bank’s ratios of past-due loans to total loans and charge-offs to total loans, as well as (under current accounting standards) the ratio of its ALLL to loans. This may be part of the reason that institutions exceeding the supervisory criteria currently have lower ratios of past-due loans and of the ALLL, relative to the size of their loan portfolios, than do other institutions. However, as the trends in Charts 9 and 10 show, loan delinquencies and charge-offs for institutions exceeding the supervisory criteria were much higher than for other institutions as the crisis unfolded.
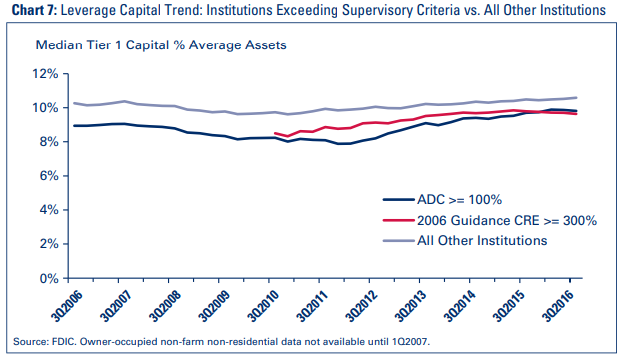
Charts 7-11 depict time trends since the third quarter 2006 for selected financial indicators for institutions exceeding the supervisory criteria. As shown in Chart 7, since the publication of the 2006 guidance, median leverage ratios of institutions exceeding the supervisory criteria have been roughly just over half of a percentage point to roughly two percentage points lower than the median leverage ratios of other banks.
At the same time, institutions exceeding the supervisory criteria have made greater use of wholesale funding. The use of wholesale funding by institutions with ADC concentrations has trended downward since the crisis, but remains higher than that of other institutions. The use of wholesale funding by institutions exceeding the CRE growth prong of the supervisory criteria remains substantially higher than for other institutions (See Chart 8). As described earlier, reliance on wholesale funding has been a contributing risk factor in bank failures.
In terms of asset quality, institutions exceeding the supervisory criteria fared worse, and for those meeting the ADC prong, much worse, than other institutions as the crisis unfolded (See Charts 9 and 10).
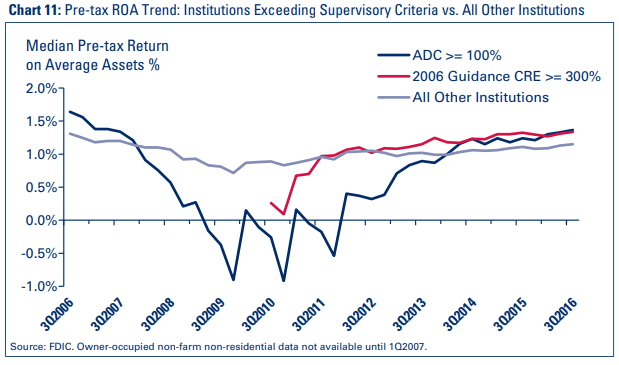
Similarly, for institutions exceeding the ADC prong of the supervisory criteria, median pre-tax ROA first dropped steeply and then was in or near negative territory for about three years in the aftermath of the crisis, while earnings performance for institutions meeting the CRE growth prong was markedly worse than for other institutions in the beginning of this period (late 2000s and early 2010s) (See Chart 11). The bottom line is that, at the median, the reward did not match the risk for CRE concentrated banks, as profits evaporated quickly and deeply during the crisis.
Risk-Management Trends for Banks with CRE Concentrations
The Call Report does not capture data related to risk-management policies, procedures and practices around lending activities. However, feedback from the FDIC’s examinations of CRE lenders indicates that weaknesses have been observed in loan underwriting, administration, and oversight practices in some instances. These have included, but are not limited to, the following, which were also evident during the crisis:
- The absence of, or unsupported or excessive, board-approved limits for CRE portfolios or segments thereof;
- Inadequate reporting of concentrations to the institution’s board or relevant committee and lack of documented discussion regarding concentrations in board or relevant committee meetings;
- Weaknesses in underwriting practices, including the following:
- Numerous exceptions to the institution’s loan policy;
- Inadequate tracking of loan policy exceptions;
- Unsupported cash flow projections;
- Lack of global cash flow analysis of guarantors; and
- Excessive or inappropriate use of cash-out financing and interest only payment terms;
- Use of inadequate or poorly supported risk factors within stress testing or sensitivity analysis of the CRE portfolio;
- Insufficient internal loan review coverage of CRE activities or improper risk ratings;
- Appraisal review programs lacking adequate independence or expertise of reviewers;
- Inadequate stratification of CRE portfolios within the ALLL analysis;
- Ineffective construction loan oversight, including lack of timely inspections or adequate disbursement controls; and
- Strategic CRE planning deficiencies, including outdated or inadequate market analysis and lack of contingency plans that would identify options if CRE risks were to become problematic for the institution.
Managing CRE Concentration Risk
As discussed earlier, studies have shown that institutions specializing in CRE lending have failed more than other types of lending specialists and that, in the 2008 crisis, poorly managed CRE concentrations, particularly in conjunction with reliance on wholesale funding sources, were highly correlated with failure. This history is an important reminder that strong risk management, which is crucial for any institution, is even more imperative for institutions that have heightened concentrations of CRE relative to capital. In that vein, the 2006 Guidance does not establish specific CRE lending limits; rather, it promotes sound risk management practices and appropriate levels of capital that will enable institutions to continue to pursue CRE lending in a safe and sound manner.
Nevertheless, institutions exceeding the supervisory criteria continue to have lower levels of capital and higher levels of reliance on wholesale funding than other institutions. Moreover, while many banks continue to manage CRE concentrations appropriately, risk-management exceptions have been observed at some examinations. Finally, while pre-tax ROA is currently higher than at other banks, experience from the crisis shows how quickly and deeply that trend can reverse, suggesting that the tradeoffs between risk and reward have not always been properly calibrated.
Given the highly cyclical risk profile of CRE lending, management at institutions with CRE concentrations, or those seeking to enter or expand activities in the CRE arena, need to make sure that risk-management practices and oversight of the CRE portfolio is especially robust.
General supervisory expectations from existing guidance for banks’ risk management practices are discussed in the final section of this article.
Agriculture
Approximately one of every four insured financial institutions, or about 1,461 banks as of September 30, 2016, is characterized as an “Ag bank,” as the FDIC has historically defined this term.8 Institutions focused on Ag lending may be susceptible to volatilities in commodity prices, weather, and land values. Accordingly, banks engaged in Ag lending must maintain sound underwriting standards, strong credit administration practices, and effective risk-management strategies.
Ag Market Conditions
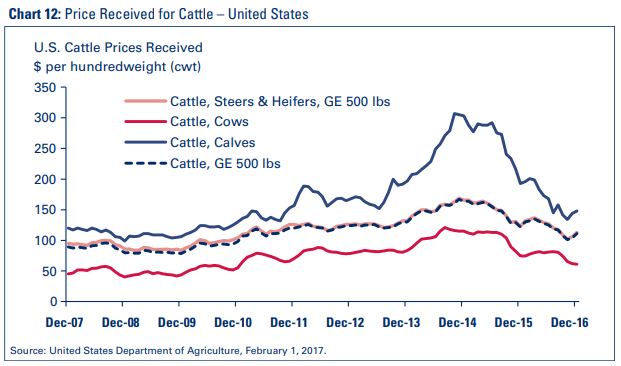
Net real farm income in the United States was only 65 percent of its 2013 high in 2015,9 and the United States Department of Agriculture (USDA) projects net farm income will continue to slide.10 At the end of November 2016, the USDA projected net farm income to drop 17.2 percent to $66.9 billion for 2016, down from $80.9 billion in 2015. Commodity prices have been under pressure for several years, and the trend persists for most field crops and livestock.
According to the USDA, its 2016 forecast for crop cash receipts, $186.5 billion, represents a decline of over 24 percent in inflation-adjusted terms from the all time high in 2012. Expected further weakening of corn prices in 2016 is forecast to more than offset production gains. Meanwhile, for wheat, receipts have declined since peaking in 2012, as strong harvests are counterweighed by price declines. Fundamentals for soybeans, such as strong export commitments, are cited as a positive; however, their durability remains unknown.
Livestock prices are also exhibiting pressure. For example, Chart 12 shows the overall trend in cattle prices in recent years. The USDA’s November 2016 forecast for overall farm cash receipts to fall by $23.4 billion in 2016 is driven by a projected drop in animal/animal product receipts of a like amount. The USDA forecasts lower receipts for nearly all major animal specialties, including a 14.8 percent drop in cattle/calf receipts.
Additionally, an ongoing decline in farmland values and cash rental rates has accelerated slightly due to prolonged pressure from falling farm income.11 The USDA’s November 2016 forecast sees net rent expense decreasing by 1.6 percent in 2016; however, it will continue a trend of the majority being paid to nonoperator landlords versus landlords who are farm operators.
Financial Trends for Institutions with Ag Concentrations
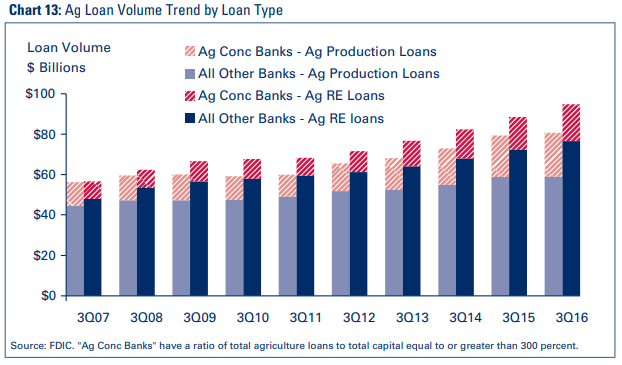
Ag loans continue to be an important component of many institutions’ loan portfolios. As shown in Chart 13, the banking industry’s Ag production and Ag real estate loan volumes are increasing. The rise in Ag lending volumes is due, at least in part, to a number of farmers who, after self-financing their operations when they were flush with cash from high prices in the earlier part of the decade, are now having to return to bank-financing as a result of lower farm income and diminishing working capital positions.
The discussion of financial trends in this section compares selected median ratios for institutions with Ag concentrations, Ag banks, and non-Ag banks. Institutions with Ag concentrations are defined for this article as institutions with Ag loans equal to or exceeding 300 percent of total capital and total 500 institutions as of September 30, 2016.12 As reflected in Chart 13, most Ag loans by dollar volume are held by institutions that do not have Ag concentrations.
Ag banks, including those with Ag concentrations relative to capital, generally weathered the 2008 financial crisis better than other types of lending institutions, and their financial performance as a whole remained good heading into the fourth quarter of 2016. As indicated in Chart 14, neither Ag banks in general, nor banks with Ag concentrations, experienced the pronounced decline in pre-tax ROA that other institutions experienced during and after the crisis.
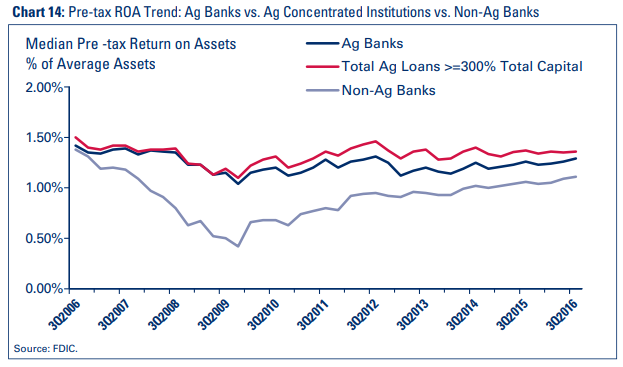
Chart 15, reflects that loan performance of Ag banks in general, and of institutions with Ag concentrations, was far superior to that of other banks during the crisis.
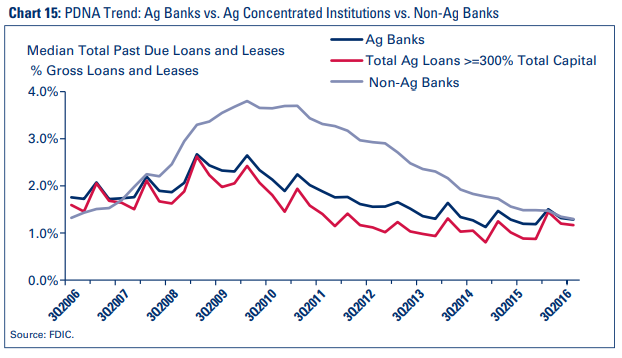
Table 2 summarizes select September 30, 2016 median financial metrics for Ag banks, institutions with Ag concentrations, and non-Ag banks. Similar to the indicators for CRE concentrated institutions described in the last section, institutions with Ag concentrations have higher earnings than other institutions as measured by median pre-tax ROA, but are operating with somewhat lower capital ratios and greater use of wholesale funding than other institutions. Unlike the CRE cohort, loan growth rates are lower than for other institutions. Institutions with Ag concentrations have slightly lower ratios of past due loans and the ALLL, relative to the size of their loan portfolios, than do other institutions. This may be in part due to the fact that stresses in the Ag economy have not thus far manifested themselves to a meaningful extent in loan delinquencies.
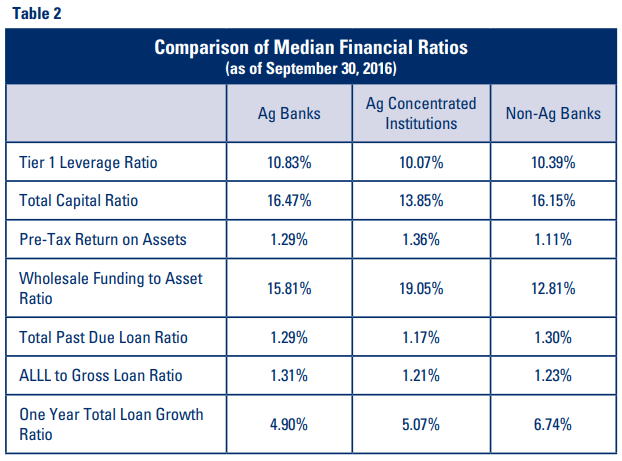
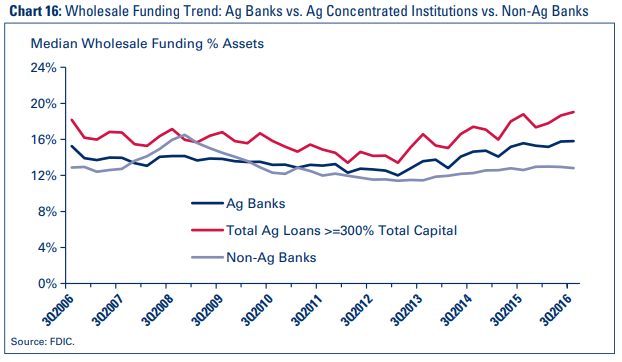
The relatively greater use of wholesale funding reported in Table 2 by both Ag banks in general, and institutions with Ag concentrations, reflects a trend that has been developing since about 2013 (See Chart 16). The increase in wholesale funding depicted in Chart 16 may be, in part, a way to meet increasing loan demand from farmers in response to stressed farm income.
Since the 1980s when many Ag banks were in crisis, most of these institutions have not been unduly affected by changes in the economic cycle. However, the declines in commodity prices and farm incomes that have occurred in recent years are a reminder that cyclical economic forces continue to pose risks to the Ag bank sector.
In fact, while condition and performance metrics remain favorable, recent feedback from the FDIC’s examinations of Ag lenders indicate some weaknesses have been noted. In some cases, borrowers’ cash flow margins are eroding or negative, so that carryover operating loan balances will need to be restructured into longer-term loans and/or repaid via secondary means, such as partial asset sales. In particular, borrowers that exhibit high-cost operating structures (for example, those who rent a majority of land or who are heavily indebted on their farm operations) are showing the greatest cash flow stress. Conversely, borrowers owning most of their land debt-free are better positioned to deal with depressed commodity prices. Some expense reduction (for example, lower fertilizer costs) is now being realized; expenses tend to be “stickier” than revenues, so reductions in costs lag revenue declines. Ag asset values and borrower equity positions are showing signs of softening; past-due levels have been increasing somewhat year-over-year, and this trend could continue if low commodity prices persist. These trends highlight that, just as for CRE-concentrated banks, strong risk management is extremely important for banks that have significant Ag credit exposures relative to their capital.
Oil and Gas
O&G lending is complex and highly specialized due to a number of factors such as, but not limited to, the capital-intensive nature of O&G exploration and production (E&P) activities, global supply and demand, geopolitical uncertainty, weather-related disruptions, and fluctuations and volatility in currency markets. As such, companies and borrowers that are directly or indirectly tied to, or reliant on, the O&G industry frequently experience volatility within key operational areas of their businesses that will directly impact their financial condition and repayment capacity.
Lending for O&G E&P activities in particular requires conservative underwriting, appropriate structuring, experienced and knowledgeable lending staff, and sound loan administration practices. For institutions doing business in O&G-dependent areas that would be affected by volatility in commodity prices, prudent management of geographic, industry, and borrower concentrations is needed for sound risk management of such exposures.
O&G Market Conditions
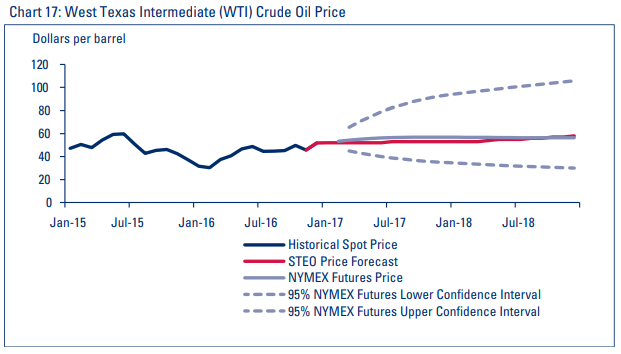
Beginning in 2014, supply and demand factors combined to drive oil prices down significantly. For example, spot West Texas Intermediate (WTI) prices were more than $100 per barrel in early 2014, but dipped into the low $40s per barrel by March 2015.13 Since then, spot WTI prices bottomed in the $20s in the first quarter 2016,14 and oil prices have continued to be volatile (See Chart 17).
Performance Trends for Institutions Exposed to O&G related Credits
As indicated earlier, no Call Report data track O&G exposures, so the type of financial trend analysis reported in the sections of this article for CRE and Ag-concentrated banks cannot be performed. However, other indicators show that distress in the O&G industry is having an effect on banks exposed to that sector. For example, results of the 2015 interagency Shared National Credits (SNC) Program15 indicated that O&G-related credits were in the early stages of a downturn. The SNC report noted that the significant decline in oil prices was adversely affecting many O&G E&P companies, resulting in increased classified commitments in that subsector. The report went on to say that from 2010 to 2014, aggressive acquisition and exploration strategies funded by term debt raised leverage levels, elevating those borrowers’ susceptibility to a protracted decline in oil prices.
Results of the SNC Program review for February 2016 reported ongoing growth of credit risk in the O&G portfolio. Classified O&G loans totaled $77.0 billion, or 27.0 percent of total classified commitments, compared to $38.2 billion, or 16.7 percent, in 2015.16
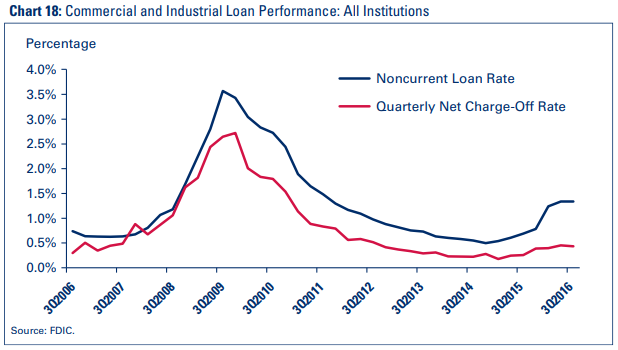
While SNC results are focused on syndicated credits, which are generally centered in larger banks, broader-based signs of O&G credit deterioration have become evident. Namely, the noncurrent loan rate and quarterly net loan charge off rate recently have increased for commercial and industrial (C&I) loans, albeit from very low levels around 2014 and early 2015 (See Chart 18). As discussed in the FDIC’s second quarter 2016 Quarterly Banking Profile, stress in energy sector loans has been a leading cause of the total volume of noncurrent C&I loans increasing for the banking industry as a whole.17
In addition to direct lending to O&G E&P companies, banks in energybased regions experienced notable loan growth during the recent boom years, at least part of which resulted from increased lending to businesses that supported those E&P companies. However, many of those support businesses, and the local economies within which they operate are also experiencing stress as the E&P companies contract their workforces and otherwise reduce expenditures that would flow through to local economies.
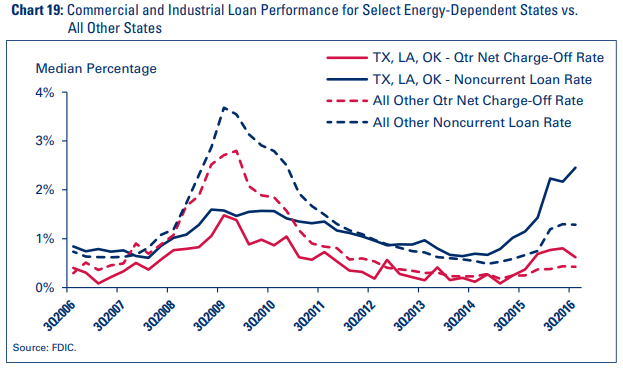
Chart 19 shows loan performance trends for banks headquartered in Texas, Oklahoma, and Louisiana, three states with meaningful reliance on the energy sector, and shows that noncurrent C&I loan rates and net C&I loan charge-off rates have increased in those states more than for banks in other states. While many other industries are important to these states and performance trends appear manageable, it is reasonable to assume that overall deterioration in the O&G sector is a factor.
Risk-Management Trends for Institutions Exposed to O&G related Credits
Feedback from the FDIC’s examinations of institutions show that very few have significant exposure to O&G E&P entities, but that they do have exposure to borrowers that support those entities. In some cases, weaknesses in risk-management frameworks were noted. The most common areas of weakness that were noted included, but were not limited to, the following:
- Limited coverage of O&G lending exposures in loan policies;
- Indirect exposures not tracked or monitored; and
- Qualitative allocations for O&G exposure not considered in the ALLL analysis.
Supervisory Expectations Regarding Credit Risk Management Practices
The FDIC has longstanding expectations for prudent credit risk management, which involve adopting and implementing lending policies, practices, and underwriting that are appropriate for the size and complexity of the bank’s business model; maintaining strong administration and oversight of lending activities and the related funding strategy; and ensuring adequate ALLL and capital levels. It is critically important for institutions to establish a robust risk-management framework around the lending function, given that loans comprise the biggest asset class at most institutions. Studies regarding failures of banks focused on CRE show the serious consequences of inadequate credit risk management. The time to focus on strengthening risk-management practices is now, as portfolios and concentrations are building, but before financial metrics are adversely affected. Especially when loan demand is strong, competition can sometimes tempt institutions to loosen underwriting standards or loan administration practices in order to build or maintain market share. There are a few key resources for bankers to be aware of regarding lending in general and for the types of lending discussed in this article in particular, discussed below.
The FDIC Risk Management Manual of Examination Policies addresses credit risk-management issues in general and describes how examiners approach the review of the loan portfolio.18 Additionally, Part 364 of the FDIC Rules and Regulations, “Standards for Safety and Soundness,”19 adopted in 1995, implements section 39 of the Federal Deposit Insurance Act, which requires each federal banking agency to establish operational and managerial standards related to the following six areas:
- Internal controls, information systems, and internal audit systems;
- Loan documentation;
- Credit underwriting;
- Interest rate exposure;
- Asset growth; and
- Compensation fees and benefits.
Appendix A to Part 364, “Interagency Guidelines Establishing Standards for Safety and Soundness,” (Safety and Soundness Standards) sets forth expectations for prudent risk management in these six areas. These standards are forward-looking in that they focus on risk management rather than performance metrics. Among other things, the Safety and Soundness Standards set forth expectations that a bank’s senior management will take into account concentrations, asset growth, and the nature of the bank’s operating environment when formulating and implementing lending policies and practices.
Part 365 of the FDIC Rules and Regulations, “Real Estate Lending Standards,” adopted in 1993,20 implements section 304 of the Federal Deposit Insurance Corporation Improvement Act and specifically addresses prudent practices for real estate lending, including CRE lending. Part 365 requires institutions to adopt written real estate lending policies that address:
- Loan portfolio diversification standards;
- Prudent underwriting standards, including loan-to-value limits, that are clear and measurable;
- Loan administration procedures; and
- Documentation, approval, and reporting requirements to monitor compliance with the bank’s real estate lending policies.
Part 365 also requires institutions to monitor conditions in their real estate lending markets to ensure that their real estate lending policies remain appropriate.
The federal banking agencies issued the 2006 Guidance specifically to address CRE concentrations.21 The 2006 Guidance states that it “does not establish a concentration limit that applies to all institutions. Rather, the Guidance encourages institutions to identify and monitor credit concentrations, establish internal concentration limits, and report all concentrations to management and the board of directors on a periodic basis.” It goes on to say that institutions actively involved in CRE lending should perform ongoing risk assessments to identify concentrations and should adopt CRE risk-management processes that are appropriate for the size of the portfolio and the level and nature of concentrations. The following key elements should be addressed in the CRE concentration risk management-framework:
- Board and management oversight;
- Portfolio management;
- Management information systems;
- Market analysis;
- Credit underwriting standards;
- Portfolio stress testing and sensitivity analysis; and
- Credit risk review function.
The 2006 Guidance also indicates that the effectiveness of an institution’s risk-management practices will be a key component of examiners’ evaluations of institutions’ CRE concentrations and that capital levels should be commensurate with the risk profile of the CRE portfolio.
In December 2015, the federal banking agencies issued a “Statement on Prudent Risk Management for Commercial Real Estate Lending”22 to remind financial institutions of existing regulatory guidance (including the 2006 Guidance and Parts 364 and 365 of the FDIC Rules and Regulations, as well as other guidance) on prudent risk-management practices for CRE lending activity through economic cycles. This statement describes the substantial growth in many CRE markets, increasing CRE concentration levels, and historically low capitalization rates and high property values. Against this backdrop, the statement notes that there are indications that some institutions have weaknesses in CRE risk-management practices, namely easing of certain CRE underwriting standards, and mentions that the banking agencies will continue to pay special attention to CRE lending.
In July 2014, the FDIC issued an advisory on risk-management practices for Ag lending, Prudent Management of Agricultural Credits through Economic Cycles,23 to reiterate existing supervisory expectations. The advisory indicates that financial institutions engaging in Ag lending should maintain capital, ALLL, and risk-management systems commensurate with activities and exposures. Among other things, risk-management systems should include appropriate processes to identify and manage Ag concentrations to individual borrowers or segments of the Ag industry.
In July 2016, the FDIC issued an advisory on risk-management practices around O&G lending, Prudent Risk Management of Oil and Gas Exposures.24 This advisory indicates that since lending to O&G E&P companies is highly complex and specialized, most of this type of lending tends to be conducted by large banks. For community banks with O&G exposure, most of it comes from exposure to companies that support the O&G industry or through indirect exposure to companies that operate in energy-dependent markets and provide services to O&G workers, such as motels, restaurants, and other local businesses. In addition to reminders about risk-management practices and the importance of maintaining adequate capital, this statement provides guidance to senior management and boards of banks operating in markets dependent on O&G industries on quantifying and monitoring indirect exposures.
Conclusion
Concentrations remain a business reality for many institutions, especially community banks. In fact, institutions may have multiple concentrations.25 History has shown that many banks have a solid track record in managing concentrations, but it has been accomplished through strong and forward-looking risk management practices that provide for early intervention, ideally before asset quality metrics decline. A bank’s senior management and its board should continue to pay close attention to the risk profile of the institution’s credit concentrations, the appropriateness of the associated risk-management framework, and the fitness of associated risk-reward positions.
In particular, excessive reliance on potentially volatile funding sources to support lending concentrations could present challenges. Initially, the bank needs to ensure that loans being funded by these sources are prudently underwritten and appropriate for the bank's risk appetite and strategic plan. Going forward, the bank needs to monitor the suitability of the funding strategy and make adjustments as necessary.
Existing guidelines for capital adequacy note that an institution should hold capital commensurate with the level and nature of risk exposure.26 All institutions, but especially those where risk is building, for example, with high and/or growing levels of concentrations, should ensure capital is sufficient in light of the level, nature, and quality of risk inherent in the loan portfolio, management expertise, historical performance, underwriting standards, funding strategy, risk-management practices, market conditions, and the ALLL.
Leeza Fridman
Senior Quantitative, Risk Analyst
Division of Risk Management Supervision (RMS)
LFridman@fdic.gov
Lisa A. Garcia
Senior Examination Specialist
RMS
LiGarcia@fdic.gov
Rae-Ann Miller
Associate Director
RMS
RMiller@fdic.gov
Camille C. Schmidt
Financial Management Analyst
RMS
CaSchmidt@fdic.gov
Kenneth A. Weber
Senior Quantitative Risk Analyst
RMS
KWeber@fdic.gov
1 FDIC, Community Bank Study, December 2012, pages 5-13; https://www.fdic.gov/regulations/resources/cbi/report/cbi-full.pdf. The Study covered the period from 1984 to 2011.
2 FDIC, Office of the Inspector General, Comprehensive Study on the Impact of the Failure of Insured Depository Institutions, EVAL-13-002, January 2013, pages 49-50; https://www.fdicoig.gov/sites/default/files/reports/2022-08/13-002EV.pdf.
3 FDIC, Office of Inspector General, Acquisition, Development, and Construction Loan Concentration Study, EVAL13-001, October 2012; https://www.fdicoig.gov/sites/default/files/reports/2022-08/13-001EV.pdf.
4 Note that Call Report segmentation of the loan portfolio (ADC, Total Non-Farm Non-Residential, Owner-Occupied Non-Farm Non-Residential, and Multifamily) may be different than other data sources.
5 Office of the Comptroller of the Currency, Board of Governors of the Federal Reserve System, FDIC, “Concentrations in Commercial Real Estate Lending, Sound Risk Management Practices,” December 12, 2006; https://www.fdic.gov/news/financial-institution-letters/2006/fil06104.html
6 For purposes of the 2006 Guidance, “commercial real estate loans” is defined as all categories of CRE, including ADC, but excluding loans secured by owner-occupied properties. The breakout of owner-occupied CRE on the Call Report was not implemented until 2007; therefore, data for the CRE growth prong of the 2006 Guidance is not available until 2010 (as reflected in the applicable charts).
7 For the purposes of this article, wholesale funding is defined primarily as the sum of the following Call Report categories: federal funds purchased and securities sold under agreements to repurchase, other borrowed money, brokered deposits, deposits gathered through listing services, and uninsured deposits of state and political subdivisions. This is for analysis purposes only and does not constitute an official regulatory definition.
8 There is no definitive definition or threshold for institutions concentrated in agricultural loans. For research purposes, the FDIC has historically defined Ag banks as any insured institution whose combined agricultural production loans and loans secured by farmland equal or exceed 25 percent of total loans. This is not an official regulatory definition nor is it a regulatory limitation, and it is recognized that there may be other definitions of Ag banks.
9 USDA/ERS Farm Income and Wealth Statistics as of November 30, 2016.
10 USDA/ERS Farm Income and Wealth Statistics as of November 30, 2016 (next release in February 2017).
11 Kauffman, Nathan and Clark, Matt “Financial Stress in Farm Sector Shows Slow but Steady Increase,” Federal Reserve Bank of Kansas City Ag Credit Survey, November 10, 2016; https://www.kansascityfed.org/agriculture/ag-credit-survey/financial-stress-farm-sector-shows-slow-steady-increase-20161110/.
12 This article segregates banks with Ag concentrations equal to or exceeding 300 percent to isolate and analyze a smaller set of banks than the historical research definition of Ag Bank. This categorization is not an official regulatory definition nor is it a regulatory limitation.
13 https://www.eia.gov/dnav/pet/hist/LeafHandler.ashx?n=PET&s=RWTC&f=D.
14 https://www.eia.gov/dnav/pet/hist/LeafHandler.ashx?n=PET&s=RWTC&f=D.
15 Board of Governors of the Federal Reserve System, FDIC, Office of the Comptroller of the Currency, “Shared National Credits Review Notes High Credit Risk and Weaknesses Related to Leveraged Lending and Oil and Gas Credit,” November 5, 2015; https://www.fdic.gov/news/news/press/2015/pr15089.html.
16 Board of Governors of the Federal Reserve System, FDIC, Office of the Comptroller of the Currency, “Shared National Credit Review Finds Risk Remains High, but Underwriting and Risk Management Improve,” July 29, 2016; https://www.fdic.gov/news/news/press/2016/pr16059.html.
17 Opening Statement Second Quarter 2016, FDIC Quarterly Banking Profile, August 30, 2016; https://www.fdic.gov/news/news/speeches/spaug3016.html.
18 https://www.fdic.gov/regulations/safety/manual/section3-2.pdf.
19 12 CFR part 364, https://www.fdic.gov/regulations/laws/rules/2000-8600.html.
20 12 CFR part 365, https://www.fdic.gov/regulations/laws/rules/2000-8700.html. The standards set forth in Part 365 were also adopted by the Board of Governors of the Federal Reserve System and the Office of the Comptroller of the Currency.
21 See footnote 5.
22 FDIC, Office of the Comptroller of the Currency, Board of Governors of the Federal Reserve System, Statement on Prudent Risk Management for Commercial Real Estate Lending, December 18, 2015; https://archive.fdic.gov/view/fdic/284/fdic_284_DS2.pdf.
23 FDIC, “Prudent Management of Agricultural Credits through Economic Cycles” (FIL-39-2014), July 16, 2014; https://www.fdic.gov/news/inactive-financial-institution-letters/2014/fil14039.pdf.
24 FDIC, “Prudent Risk Management of Oil and Gas Exposures” (FIL-49-2016), July 27, 2016; https://www.fdic.gov/news/news/financial/2016/fil16049.html.
25 For example as pointed out in FIL-49-2016, institutions doing business in O&G markets may also have other concentrations, such as in CRE lending or Ag lending, which could also be adversely affected by declining commodity prices or economic conditions.
26 Uniform Financial Institutions Ratings System, January 1, 1997; https://www.fdic.gov/regulations/laws/rules/5000-900.html.