
FDIC-Insured Institutions Reported Full-Year 2023 Net Income of $256.9 Billion and Fourth Quarter 2023 Net Income of $38.4 Billion
For Release
- Full-Year 2023 Net Income Declined But Remained Well Above the Levels Reported Before the Pandemic
- Net Income Decreased From the Prior Quarter, Driven By Higher Noninterest and Provision Expenses and Lower Noninterest Income
- The Net Interest Margin Fell Two Basis Points From the Prior Quarter
- Unrealized Losses on Securities Declined to the Lowest Level Since Second Quarter 2022
- Community Bank Net Income Decreased Quarter Over Quarter
- The Industry Reported Loan Growth in the Fourth Quarter
- Domestic Deposits Increased For the First Time in Seven Quarters
- The Noncurrent Loan Rate Increased Modestly but Remains Below Pre-Pandemic Levels.
- The Net Charge-off Rate Increased and Is Above Pre-Pandemic Levels
- The Deposit Insurance Fund Reserve Ratio Increased to 1.15 Percent
“The banking industry has shown resilience after a period of liquidity stress in early 2023. Full-year net income remained high, overall asset quality metrics were favorable, and the industry’s liquidity was stable. However, ongoing economic and geopolitical uncertainty, continuing inflationary pressures, volatility in market interest rates, and emerging risks in some bank commercial real estate portfolios pose significant downside risks to the banking industry. These issues, together with funding and earnings pressures, will remain matters of ongoing supervisory attention by the FDIC.”
— FDIC Chairman Martin J. Gruenberg
WASHINGTON — Reports from 4,587 commercial banks and savings institutions insured by the Federal Deposit Insurance Corporation (FDIC) reflect aggregate full-year 2023 net income of $256.9 billion, down $6 billion (2.3 percent) from the prior year, and fourth quarter 2023 net income of $38.4 billion, down $30 billion (43.9 percent) from the prior quarter. Non-recurring, noninterest expenses at large banks drove the decrease in quarterly earnings. Higher provision expense and lower noninterest income also contributed to the decline. These and other financial results for fourth quarter 2023 are included in the FDIC’s latest Quarterly Banking Profile released today.
Highlights from the Fourth Quarter 2023 Quarterly Banking Profile
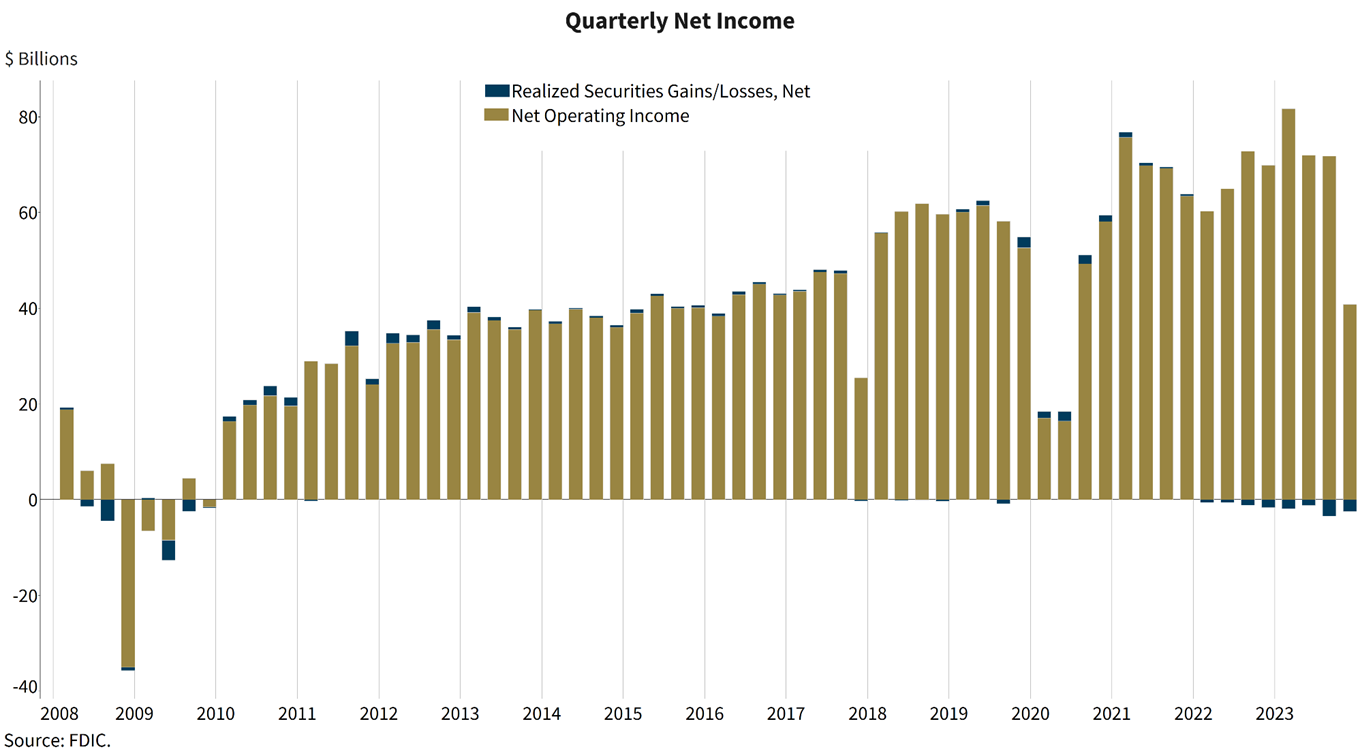
Full-Year Net Income Declined in 2023 but Remained Well Above Pre-Pandemic Levels: The banking industry reported full-year 2023 net income of $256.9 billion, down $6 billion (2.3 percent) from the prior year, but still well above the pre-pandemic average.1 The decrease occurred as higher noninterest, provision expense, and realized losses on securities offset growth in net operating revenue. The aggregate return-on-assets ratio (ROA) decreased by one basis point to 1.10 percent.
Community banks reported full-year 2023 net income of $26.6 billion, down $2 billion (7.1 percent) from the prior year. Similar to the industry overall, the combined increase in noninterest and provision expense offset higher net operating revenue. Community banks reported full-year pre-tax ROA of 1.22 percent, down 17 basis points from the prior year.
Net Income Decreased From the Prior Quarter, Driven by Higher Noninterest and Provision Expenses and Lower Noninterest Income: Fourth quarter net income for the 4,587 FDIC-insured commercial banks and savings institutions declined by $30 billion (43.9 percent) from the prior quarter to $38.4 billion. Higher noninterest expense (up $26.6 billion, or 18.9 percent), lower noninterest income (down $6.5 billion, or 8.8 percent), and higher provision expense (up $5.2 billion, or 26.5 percent) drove the decline in net income. However, it is estimated that 70 percent of the decrease in net income was caused by specific, nonrecurring, noninterest expenses at large banks.2 These expenses include the special assessment, goodwill impairment, and legal, reorganization, and other one-time costs.
The Net Interest Margin Fell From the Prior Quarter: The net interest margin (NIM) declined by two basis points to 3.28 percent in the fourth quarter. NIM declined as the increase in deposit and non-deposit liability costs more than outpaced the increase in asset yields. Despite the quarterly decline, the industry NIM is still three basis points above the pre-pandemic average NIM of 3.25 percent. The community bank NIM of 3.35 percent was unchanged from the prior quarter, but is 28 basis points lower than its pre-pandemic average.
Unrealized Losses on Securities Declined From Third Quarter 2023: The banking industry reported unrealized losses on securities of $477.6 billion in the fourth quarter, a decline of $206.3 billion (30.2 percent) from third quarter 2023. Lower unrealized losses on residential mortgage-backed securities drove the decline. The level of unrealized losses is the lowest reported since second quarter 2022, but remained elevated compared to historical levels.
Community Bank Net Income Declined Quarter Over Quarter: Quarterly net income for the 4,140 community banks insured by the FDIC fell to $5.9 billion in the fourth quarter, a decline of $650.2 million (9.9 percent) from third quarter 2023. Higher noninterest and provision expense drove the decline in earnings. Net operating revenue increased modestly from the prior quarter on higher net interest income. The community bank pretax ROA declined 15 basis points from one quarter ago to 1.07 percent.
Loan Balances Increased From Last Quarter and From One Year Ago: Total loan and lease balances grew $107.5 billion (0.9 percent) from the previous quarter. This was the highest loan growth rate reported by the industry in 2023. An increase in credit card loans (up $63.1 billion, or 6 percent) drove loan growth.
Total loan and lease balances increased by $225.1 billion (1.8 percent) from the prior year. This increase was led by credit card loans (up $107.4 billion, or 10.6 percent) and one-to-four family residential loans (up $85.4 billion, or 3.4 percent). More than 85 percent of banks reported annual loan growth.
Community banks reported a 1.8 percent increase in loan balances from the previous quarter and a 7.8 percent increase from the prior year. Community bank loan growth has been broad-based, with quarterly and annual increases reported across all major loan categories. The growth has been strongest in residential mortgage loan balances and nonfarm, nonresidential commercial real estate loan balances.
Domestic Deposits Increased for the First Time in Seven Quarters: Domestic deposits increased 186.9 billion (1.1 percent) from third quarter 2023, the first quarterly increase in domestic deposits in the last seven quarters. Growth in time deposits led the increase in domestic deposits, while noninterest-bearing deposits declined for the seventh consecutive quarter. Estimated insured deposits (up $46.6 billion, or 0.4 percent) increased during the quarter. Reported uninsured deposits decreased during the quarter, but would have increased for the first time in eight quarters had a large bank’s subsidiary transactions not affected reported data. Excluding that bank from the calculations, the industry increased uninsured deposits $92.4 billion, or 1.4 percent, in the quarter.
Delinquency Rates Trended Higher but Remained Below Pre-Pandemic Average Rates: Noncurrent loans–loans that are 90 days or more past due or in nonaccrual status–increased to 0.86 percent of total loans, up four basis points from the prior quarter. The share of total loans that were 30-89 days past due increased to 0.61 percent, up seven basis points from the prior quarter. Each of these delinquency rates remained below its pre-pandemic average. Credit cards and nonfarm, nonresidential commercial real estate loans drove the quarterly increase in the noncurrent rate, while residential mortgages drove the quarterly increase in the share of loans 30-89 days past due.
The industry’s net charge-off rate increased 14 basis points from the prior quarter and 29 basis points from a year prior to 0.65 percent. Credit cards led the annual increase in net charge-off balances. The industry’s net charge-off rate is 17 basis points above its pre-pandemic average. The net charge-off rate at community banks was 0.18 percent, just three basis points above its pre-pandemic average.
The Deposit Insurance Fund Reserve Ratio Grew to 1.15 Percent: In the fourth quarter, the Deposit Insurance Fund (DIF) balance increased by $2.4 billion to $121.8 billion, largely reflecting increased assessment revenue. The reserve ratio increased two basis points during the quarter to 1.15 percent.
The Total Number of Insured Institutions Declined: The total number of FDIC-insured institutions declined by 27 during the quarter to 4,587. One bank opened, one bank failed, four banks did not file a Call Report after selling a majority of their assets to credit unions, and 23 institutions merged with other banks during the quarter.
| 1 | The “pre-pandemic average” refers to the period of first quarter 2015 through fourth quarter 2019 and is used consistently throughout this press release. |
| 2 | After taking into account the estimated tax benefits of the expenses. |