
Quarterly Banking Profile - Fourth Quarter 2023
Good morning and welcome to our release of full-year and fourth quarter 2023 performance results for FDIC-insured institutions.
The banking industry has shown resilience after a period of liquidity stress in early 2023. Full-year net income remained high, overall asset quality metrics were favorable, and the industry's liquidity was stable.1
While the banking industry reported a modest decline of 2.3 percent in full-year net income, 2023 earnings of $257 billion remained well above the levels reported before the pandemic. The industry's net operating revenue crossed the $1 trillion mark for the first time in QBP history, and the full-year net interest margin was 3.30 percent, the highest reported margin since 2019. Nevertheless, these positive top-line results were offset by higher noninterest expense, provision expense, and realized losses on securities.
Looking at quarterly results, the banking industry's net income declined 43.9 percent from the prior quarter, in large part because of several non-recurring, noninterest expenses recognized by large banks during the quarter. The largest contributor to the decline was the expense related to a special assessment to recover the estimated loss to the Deposit Insurance Fund attributable to the protection of uninsured depositors following the failure of two banks last spring. Some banks also reported substantial charges for goodwill impairment and litigation, reorganization, and other one-time expenses. All totaled, these expenses made up about 70 percent of the quarterly decline in net income. The industry also reported higher provision expense and lower noninterest income when compared to the prior quarter, which contributed to the decline in net income as well.
Community banks reported a quarterly decline in net income of 9.9 percent as higher noninterest expense and higher provision expense more than offset higher net interest income.
After increasing slightly last quarter, the industry's net interest margin declined modestly in the fourth quarter. The decline occurred as greater interest expense on deposits and non-deposit liabilities more than offset an increase in asset yields. The net interest margin for community banks did not change from the prior quarter.
Unrealized losses on available-for-sale and held-to-maturity securities fell by 30.2 percent to $478 billion in the fourth quarter. A decline in unrealized losses on mortgage-backed securities, resulting from lower mortgage rates, drove the overall decline. The positive revaluation in bank security portfolios, along with higher cash balances, also provided a boost to bank liquidity levels in the fourth quarter.
The industry increased its total loans by $107 billion, or 0.9 percent, in the fourth quarter, up from 0.4 percent last quarter. Seasonal growth in credit card loans was responsible for most of the increase in the quarterly growth rate. Even though the quarterly loan growth rate was the highest reported in 2023, the industry's year-over-year loan growth rate declined throughout the year and was 1.8 percent at year end. Loan growth at community banks was more robust, increasing 1.8 percent from the prior quarter and 7.8 percent from the prior year.
Asset quality metrics were favorable overall, although deterioration is evident in commercial real estate (CRE) loans and credit card portfolios.2 The industry's noncurrent rate increased four basis points from the prior quarter to 0.86 percent, a level still well below the pre-pandemic average noncurrent rate of 1.28 percent.
The increase in noncurrent loan balances was greatest among CRE loans and credit cards. Weak demand for office space is softening property values, and higher interest rates are affecting the credit quality and refinancing ability of office and other types of CRE loans. As a result, the noncurrent rate for non-owner occupied CRE loans is now at its highest level since first quarter 2014, driven by portfolios at the largest banks. Similarly, the noncurrent rate for credit card loans is at its highest level since third quarter 2011.
Driven by writedowns on credit cards and CRE loans, the industry's quarterly net charge-off rate increased 14 basis points to 0.65 percent, a rate that is 17 basis points higher than the pre-pandemic average rate.
Domestic deposits increased for the first time in seven quarters, driven by growth in time deposits. The industry's insured deposits increased by $47 billion, or 0.5 percent, in the fourth quarter. Uninsured deposit growth was masked by one large bank that eliminated a significant amount of intercompany deposits. Excluding that bank from the calculations, the industry increased uninsured deposits in the quarter by $92 billion, or 1.4 percent, and growth was widespread among bank size groups. This would have been the industry's first increase in uninsured deposit levels after seven consecutive quarters of decline.
The Deposit Insurance Fund (DIF) balance was $122 billion at year end, approximately $2.4 billion higher than at the end of the third quarter. The reserve ratio—the fund balance relative to insured deposits—increased by two basis points to 1.15 percent. The reserve ratio currently remains on track to reach the 1.35 percent minimum reserve ratio by the statutory deadline of September 30, 2028.
In conclusion, the U.S. economy sustained growth in 2023 that exceeded expectations, and the banking industry remained resilient after a period of liquidity stress early last year. However, the banking industry still faces significant downside risks from the continued effects of inflation, volatility in market interest rates, and geopolitical uncertainty. These issues could cause credit quality, earnings, and liquidity challenges for the industry. In addition, deterioration in certain loan portfolios, particularly office space and other types of CRE loans, warrants monitoring. These issues, together with funding and earnings pressures, will remain matters of ongoing supervisory attention by the FDIC.
Thank you.
I am happy to take your questions.
Chart 1:
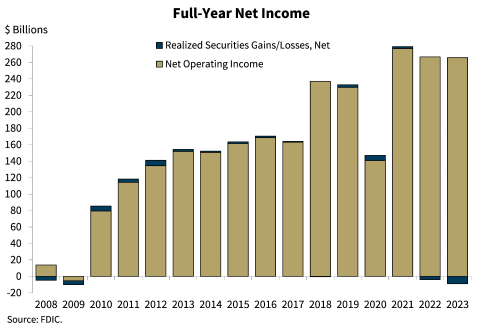
Our first chart shows that full-year 2023 banking industry net income fell modestly from 2022, but remained above income levels reported prior to the pandemic. Net income totaled $256.9 billion in 2023, down 2.3 percent from 2022. The annual decline occurred as higher noninterest expense, provision expense, and realized losses on the sale of securities outpaced growth in net operating revenue. The industry's return on assets ratio fell one basis point to 1.10 percent, and 5.2 percent of banks were unprofitable during the year. Community banks reported annual net income of $26.6 billion, down 7.1 percent from the prior year. The decrease in community bank net income was primarily attributable to higher noninterest expense. Community banks reported a pre-tax return on assets ratio of 1.22 percent, down 18 basis points from 2022.
Chart 2:
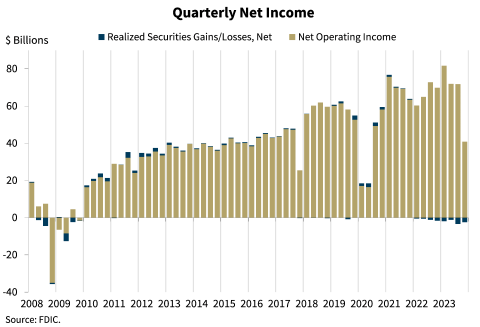
Our next chart shows that the banking industry reported quarterly net income of $38.4 billion, a decline of $30 billion, or 43.9 percent, from the prior quarter. The decline in quarterly net income was primarily the result of higher noninterest expense, while lower noninterest income and higher provision expense also contributed.
Community bank quarterly net income fell 9.9 percent from the prior quarter to $5.9 billion, primarily driven by higher noninterest and provision expense.
Chart 3:
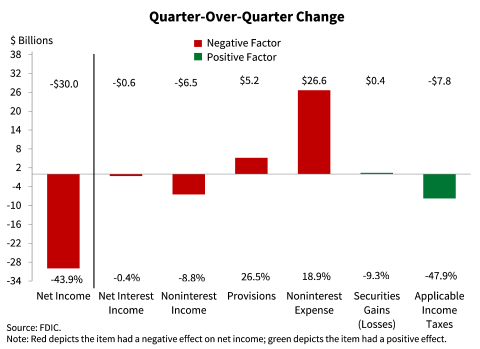
Chart 3 shows the breakdown of the changes in industry net income quarter over quarter. The main driver of the industry's $30 billion decline in net income was noninterest expense, which increased by $26.6 billion, or 18.9 percent, quarter over quarter. However, it is estimated that 70 percent of the decrease in net income was caused by specific, nonrecurring, noninterest expenses at large banks.3 These expenses include the special assessment, goodwill impairment, and legal, reorganization, and other one-time costs.
Noninterest income also declined by $6.5 billion during the quarter. A decline in servicing fees, trading revenue, and "all other noninterest income" contributed to the quarterly reduction in noninterest income. Some of these items tend to exhibit volatility from quarter to quarter and may not be indicative of a trend.
Chart 4:
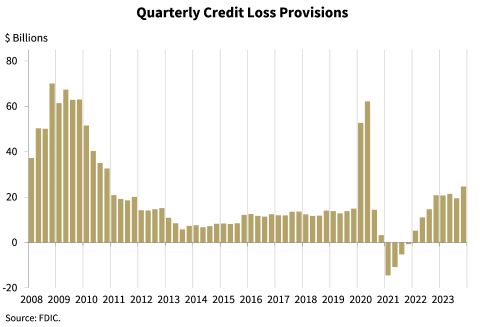
The next chart shows the industry's provision expense, which increased by $5.2 billion in the fourth quarter. The increase can be attributed to higher credit card balances and charge-offs, greater risk in office properties, and increasing delinquency levels across loan portfolios.
With the exception of the two pandemic quarters in 2020, provision expense of $24.7 billion was the highest since fourth quarter 2010.
Chart 5:
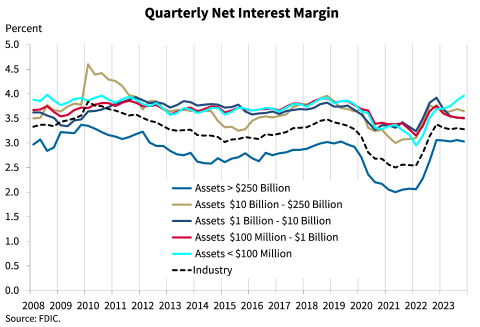
The next chart shows the average net interest margin for the industry and the five asset size groups on which the QBP reports. The industry's net interest margin fell two basis points from last quarter to 3.28 percent as the cost of deposits and other interest-bearing liabilities increased faster than yields on earning assets. The largest two asset-size groups reported slightly lower net interest margins, while the other size groups reported unchanged or higher margins.
Community banks reported no change in their average net interest margin of 3.35 percent.
Chart 6:
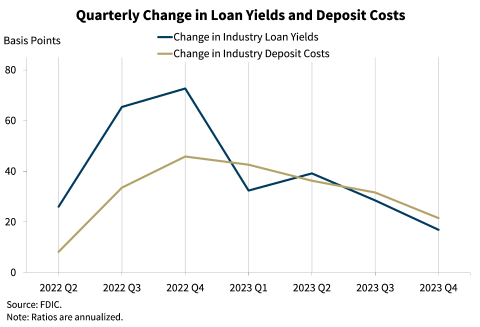
The next chart shows the quarter-over-quarter change in the industry's average yield on loans and average cost of deposits, which helps to explain the industry's decline in net interest margin this quarter. During the quarter, deposit costs and loan yields continued to increase across the industry, but for the second consecutive quarter deposit costs increased faster than loan yields. For community banks, deposit costs have increased faster than loan yields for four straight quarters.
The industry continues to report a sizeable shift from lower-yielding deposit accounts, such as transaction and savings accounts, into higher-yielding time deposits. A pivot to lower market interest rates could reduce the pressure on bank funding costs, but the timing of any changes in rates is highly uncertain.
Chart 7:
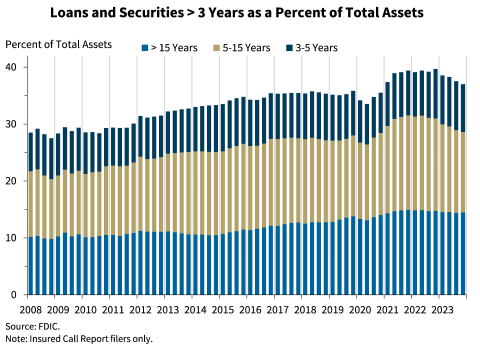
Chart 7 shows the banking industry's share of longer-term loans and securities fell for the fourth consecutive quarter to 37 percent after peaking a year ago.
Community banks' share of longer-term loans and securities was 50.9 percent in fourth quarter 2023, down from 51.8 percent last quarter and an all-time high of 54.7 percent a year ago. Community banks' elevated share of longer-term loans and securities helps to explain why their net interest margin declined much more than the industry's margin in 2023.
Chart 8:
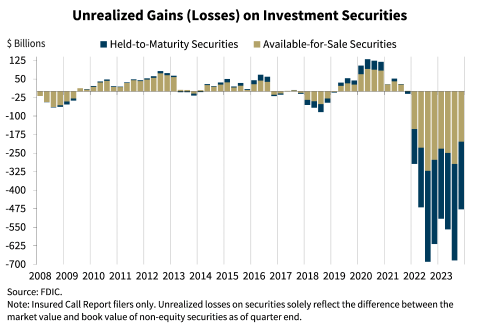
Our next chart shows the level of unrealized losses on held-to-maturity and available-for-sale securities portfolios. Total unrealized losses declined 30.2 percent quarter over quarter to $477.6 billion as mortgage and Treasury rates declined in the fourth quarter. Lower unrealized losses on residential mortgage-backed securities drove the improvement, accounting for about two-thirds of the quarterly decline in unrealized losses on securities.
Though it remains elevated, this level of unrealized losses is the lowest reported since second quarter 2022.
Chart 9:
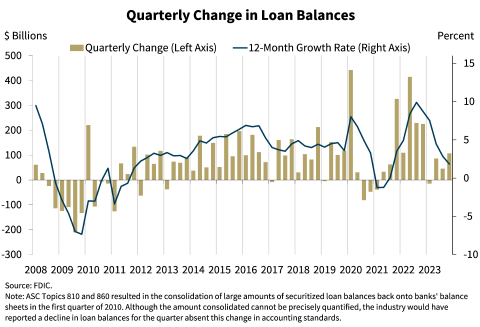
Chart 9 shows the change in loan balances on a quarterly and annual basis. The industry increased its total loans by $107.5 billion, or 0.9 percent, in the fourth quarter, up from 0.4 percent last quarter. Seasonal growth in credit card loans was responsible for most of the increase in the quarterly growth rate. Commercial and industrial loans declined for the fourth consecutive quarter, while balances of all other major loan categories increased modestly.
The industry's annual rate of loan growth continued to decline in the fourth quarter. Loan balances increased 1.8 percent from the prior year, the slowest rate of annual loan growth since third quarter 2021. The slowdown in annual loan growth reported throughout 2023 has been broad-based, occurring across residential real estate, consumer, commercial and industrial, and all major commercial real estate loan categories.
Loan growth at community banks has been more robust, increasing 1.8 percent from the prior quarter and 7.8 percent from the prior year. Loan growth at community banks has been broad-based, with all major loan category balances growing from the prior quarter and year.
Chart 10:
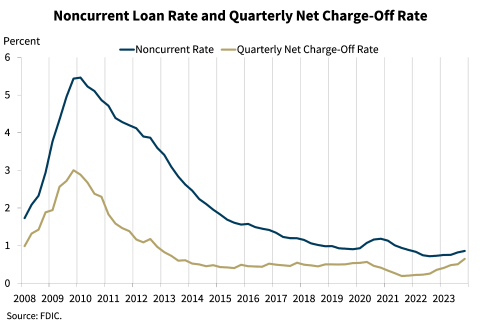
Our next chart shows that noncurrent loans and charge-offs edged up in the fourth quarter. The noncurrent rate increased four basis points from the prior quarter to 0.86 percent, a level still well below the pre-pandemic average noncurrent rate of 1.28 percent. The increase in noncurrent loan balances was greatest among CRE loans and credit cards. The noncurrent rate for non-owner occupied CRE loans is now at its highest level since first quarter 2014, driven by portfolios at the largest banks. Similarly, the noncurrent rate for credit card loans is at the highest level since third quarter 2011.
The quarterly net charge-off rate increased 14 basis points to 0.65 percent. This rate is now 17 basis points higher than the pre-pandemic average rate. Credit cards and CRE loans drove the annual increase in net charge-off balances. The credit card net charge-off rate was 4.15 percent, 67 basis points higher than its pre-pandemic average.
Chart 11:
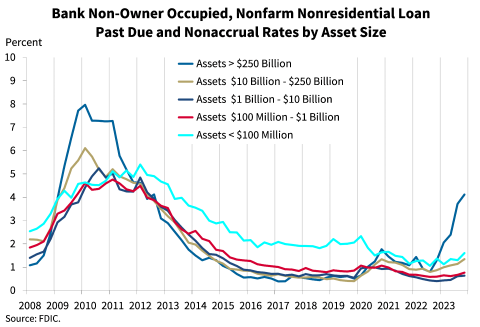
Looking more closely at commercial real estate portfolios, there is an upward trend in past due and nonaccrual non-owner-occupied property loans, particularly at large banks. The volume of past due and nonaccrual non-owner occupied CRE loans increased by $2.3 billion, or 13.1 percent, quarter over quarter. As seen in this chart, deterioration is concentrated in the largest banks which reported a past-due-and-nonaccrual rate of 4.11 percent, well above the rate of 1.71 percent for the industry as a whole.
This trend is being driven primarily by deterioration in office loans in several major metropolitan central business districts, which tend to be serviced by large banks.
Chart 12:
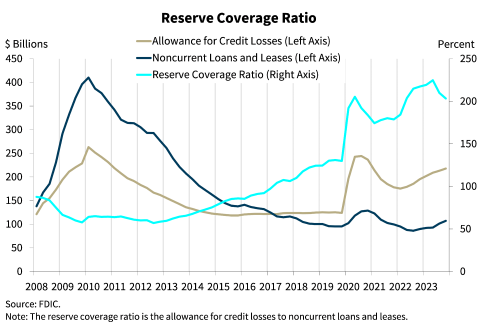
Chart 12 shows that increased provision expenses boosted the industry's allowance for credit losses by $4.7 billion to $217.8 billion quarter over quarter. However, the level of noncurrent loans increased at a faster rate than the allowance during the quarter. As a result, the industry's reserve coverage ratio, or the ratio of the allowance for credit losses to noncurrent loans, fell to 203.3 percent. This is still a much higher coverage ratio than the pre-pandemic average.
The reserve coverage ratio at community banks was 227.8 percent.
Chart 13:
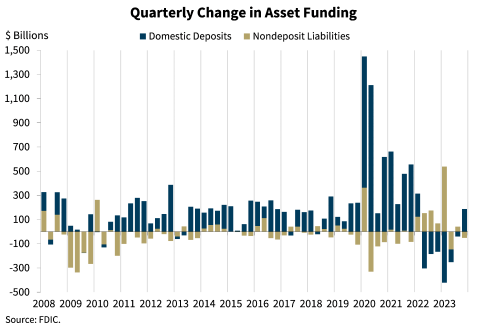
Chart 13 shows that domestic deposits increased for the first time in the last seven quarters. Domestic deposits increased $186.9 billion, or 1.1 percent, during the fourth quarter. Growth in time deposits of 6.9 percent led the quarterly increase.
Banks continue to report a shift away from noninterest-bearing deposits toward interest-bearing deposits. Noninterest-bearing deposits declined for the seventh consecutive quarter, while interest-bearing deposits increased 2.2 percent, the largest quarterly growth rate since fourth quarter 2021.
The industry's insured deposits increased $46.6 billion, or 0.5 percent, in the fourth quarter. Uninsured deposit growth was masked by one large bank that eliminated $165 billion in intercompany deposits. That bank likely would have reported higher uninsured deposits had those transactions not occurred. Excluding that bank from the calculations, the industry increased uninsured deposits in the quarter by $92.4 billion, or 1.4 percent. Uninsured deposit growth was reported by every asset size group except for the largest group that had the bank with the elimination of intercompany deposits. Excluding the large bank from the calculations would have resulted in the industry's first increase in uninsured deposit levels after seven consecutive quarters of decline.
Nondeposit liabilities fell by $52.2 billion from the prior quarter, driven by a decline in fed funds purchased and repurchase agreements.
Chart 14:
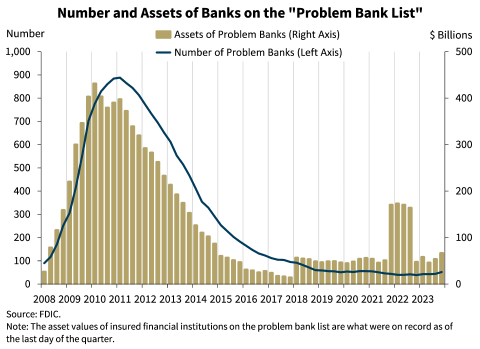
Chart 14 shows the number and total assets of banks on the FDIC's "Problem Bank List." Banks on this list have a CAMELS composite rating of "4" or "5" due to financial, operational, or managerial weaknesses, or a combination of such issues. The number of banks on the list increased from 44 in the third quarter to 52 banks at year end, while total assets held by problem banks increased from $53.5 billion to $66.3 billion. The number of problem banks represent 1.1 percent of total banks, which is near the low end of the "normal" range for non-crisis periods of one to two percent of all banks. One bank failed in the fourth quarter.
Chart 15:
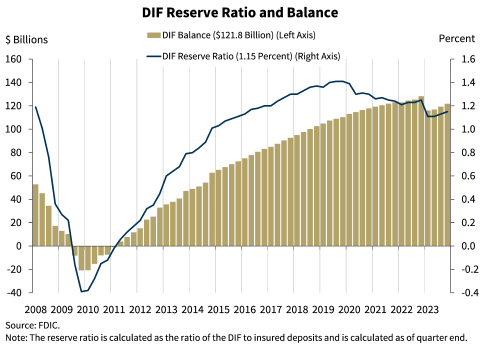
Our final chart shows that the DIF balance was $121.8 billion on December 31, 2023, up approximately $2.4 billion from the third quarter. Assessment revenue was the primary driver of the increase in the fund. Insured deposits increased by 0.5 percent during the fourth quarter, and year-over-year insured deposit growth was 3.6 percent. The reserve ratio—the fund balance relative to insured deposits—increased by two basis points in the fourth quarter to 1.15 percent. The reserve ratio was ten basis points lower than a year ago.
The FDIC adopted a DIF Restoration Plan on September 15, 2020, to return the reserve ratio to the statutory minimum of 1.35 percent by September 30, 2028, as required by law. Based on FDIC projections, the reserve ratio remains on track to reach 1.35 percent by the statutory deadline. The FDIC will continue to monitor factors affecting the reserve ratio, including but not limited to insured deposit growth and potential losses due to bank failures and related reserves.
In conclusion, while several large, nonrecurring expenses negatively affected net income in the fourth quarter, full-year net income remained well above the levels reported before the pandemic. In addition, the banking industry as a whole reported overall loan delinquency rates that remain below pre-pandemic levels, as well as stable liquidity.
However, ongoing economic and geopolitical uncertainty, continuing inflationary pressures, volatility in market interest rates, and emerging risks in some bank commercial real estate portfolios pose significant downside risks to the banking industry. These issues, together with funding and earnings pressures, will be matters of close supervisory attention by the FDIC in 2024.
| 1 | All data in the statement are from Call Reports filed as of February 17, 2024, and do not include any subsequent re-filings. |
| 2 | In this statement, the term “commercial real estate loans” is used to describe nonfarm, nonresidential loans. |
| 3 | After taking into account the estimated tax benefits of the expenses. |