Selected Financial Data - Fourth Quarter 2023
| $ in millions | DIF | FRF | ALL FUNDS | ||||||
|---|---|---|---|---|---|---|---|---|---|
| Dec 23 | Dec 22 | Change | Dec 23 | Dec 22 | Change | Dec 23 | Dec 22 | Change | |
| Total Receiverships | 74 | 132 | (58) | 0 | 0 | 0 | 74 | 132 | (58) |
| Assets in Liquidation | $84,641 |
$38 |
$84,603 |
$0 |
$0 |
$0 |
$84,641 |
$38 |
$84,603 |
| YTD Collections | $206,126 |
$145 |
$205,981 |
$0 |
$0 |
$0 |
$206,126 |
$145 |
$205,981 |
| YTD Dividend/Other Pmts - Cash | $43,143 |
$470 |
$42,673 |
$0 |
$0 |
$0 |
$43,143 |
$470 |
$42,673 |

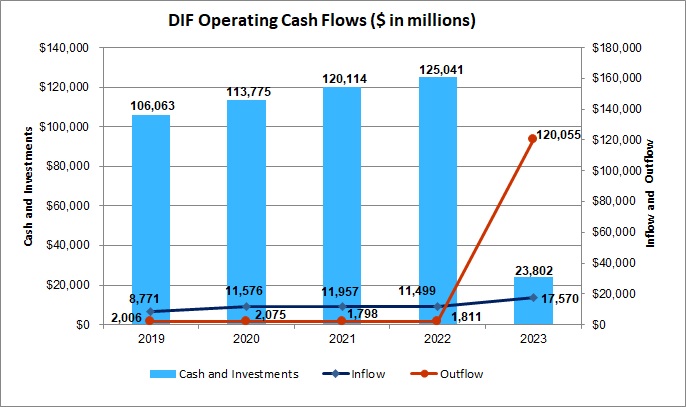
Cash and Investments decreased by $101.2 billion from $125.0 billion at year-end 2022 to $23.8 billion at December 31, 2023. The decrease was primarily due to resolution-related outlays, which far exceeded recoveries from resolutions and assessment collections.
| Cash Investments | Inflow | Outflow | |
|---|---|---|---|
| 2019 | $106,063 | $8,771 | $2,006 |
| 2020 | $113,775 | $11,576 | $2,075 |
| 2021 | $120,114 | $11,957 | $1,798 |
| 2022 | $125,041 | $11,499 | $1,811 |
| 2023 | $23,802 | $17,570 | $120,055 |
