
Selected Financial Data - First Quarter 2019
Mar-19 | Dec -18 | Quarterly Change | Mar -18 | Year-Over-Year Change | |
|---|---|---|---|---|---|
| FSLIC Resolution Fund | |||||
| Cash and cash equivalents | $907 | $902 | $5 | $889 | $18 |
| Accumulated deficit | (124,582) | (124,587) | 5 | (124,601) | 19 |
| Total resolution equity | 908 | 902 | 6 | 889 | 19 |
| Total revenue | 5 | 17 |
| 3 | 2 |
| Operating expenses | 0 | 0 |
| 0 | 0 |
| Losses related to thrift resolutions | 0 | 0 |
| 0 | 0 |
| Net Income (Loss) | $5 | $17 |
| $3 | $2 |
$ in millions | DIF | FRF | ALL FUNDS | ||||||
|---|---|---|---|---|---|---|---|---|---|
| Mar-19 | Mar-18 | Change | Mar-19 | Mar-18 | Change | Mar-19 | Dec-18 | Change |
| Total Receiverships | 271 | 317 | (46) | 0 | 0 | 0 | 271 | 317 | (46) |
| Assets in Liquidation | $1,035 | $2,097 | ($1,062) | $2 | $2 | $0 | $1,037 | $2,099 | ($1,062) |
| YTD Collections | $400 | $492 | ($92) | $ 0 | $0 | $0 | $400 | $492 | ($92) |
| YTD Dividend/Other Pmts - Cash | $255 | $847 | ($592) | $ 0 | $0 | $ 0 | $255 | $847 | ($592) |
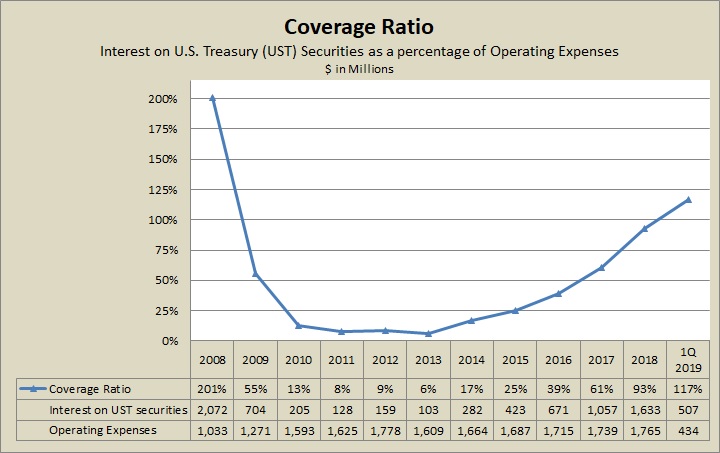
Coverage Ratio | Interest on UST Securities | Operating Expenses | |
|---|---|---|---|
| 2008 | 201% | 2,072 | 1,033 |
| 2009 | 55% | 704 | 1,271 |
| 2010 | 13% | 205 | 1,593 |
| 2011 | 8% | 128 | 1,625 |
| 2012 | 9% | 159 | 1,778 |
| 2013 | 6% | 103 | 1,609 |
| 2014 | 17% | 282 | 1,664 |
| 2015 | 25% | 423 | 1,687 |
| 2016 | 39% | 671 | 1,715 |
| 2017 | 61% | 1,057 | 1,739 |
| 2018 | 93% | 1,633 | 1,765 |
| 1Q 2019 | 117% | 507 | 434 |
Since 2013, the coverage ratio has steadily risen as a result of significant increases in interest revenue on U.S. Treasury securities, nominally offset by increases in operating expenses.
Increases in interest revenue on U.S. Treasury securities are due to: 1) increases in the federal funds target rate, 2) higher yields on new long-term investments purchased as older long-term investments matured, and 3) steady growth in the investment portfolio balance.