
Selected Financial Data - Fourth Quarter 2022
| FSLIC Resolution Fund | |||||
|---|---|---|---|---|---|
| Dec-22 | Sep-22 | Quarterly Change | Dec-21 | Year-Over-Year Change | |
| Cash and cash equivalents | $922 | $914 | $8 | $908 | $14 |
| Accumulated deficit | (124,547) |
(124,555) |
8 |
(124,562) |
15 |
| Total resolution equity | 922 |
914 |
8 |
908 |
14 |
| Total revenue | 15 |
7 |
8 |
0 |
15 |
| Operating expenses | 0 |
0 |
0 |
0 |
0 |
| Losses related to thrift resolutions | 0 |
0 |
0 |
0 |
0 |
| Net Income (Loss) | $15 |
$7 |
$8 |
$0 |
$15 |
| $ in millions | DIF | FRF | ALL FUNDS | ||||||
|---|---|---|---|---|---|---|---|---|---|
| Dec 22 | Dec 21 | Change | Dec 22 | Dec 21 | Change | Dec 22 | Dec 21 | Change | |
| Total Receiverships | 132 | 191 | (59) | 0 | 0 | 0 | 132 | 191 | (59) |
| Assets in Liquidation | $38 |
$92 |
($54) |
$ 0 |
$0 |
$0 |
$38 |
$92 |
($54) |
| YTD Collections | $145 |
$514 |
($369) |
$0 |
$1 |
($1) |
$145 |
$515 |
($370) |
| YTD Dividend/Other Pmts - Cash | $470 |
$586 |
($116) |
$ 0 |
$ 0 |
$ 0 |
$470 |
$586 |
($116) |
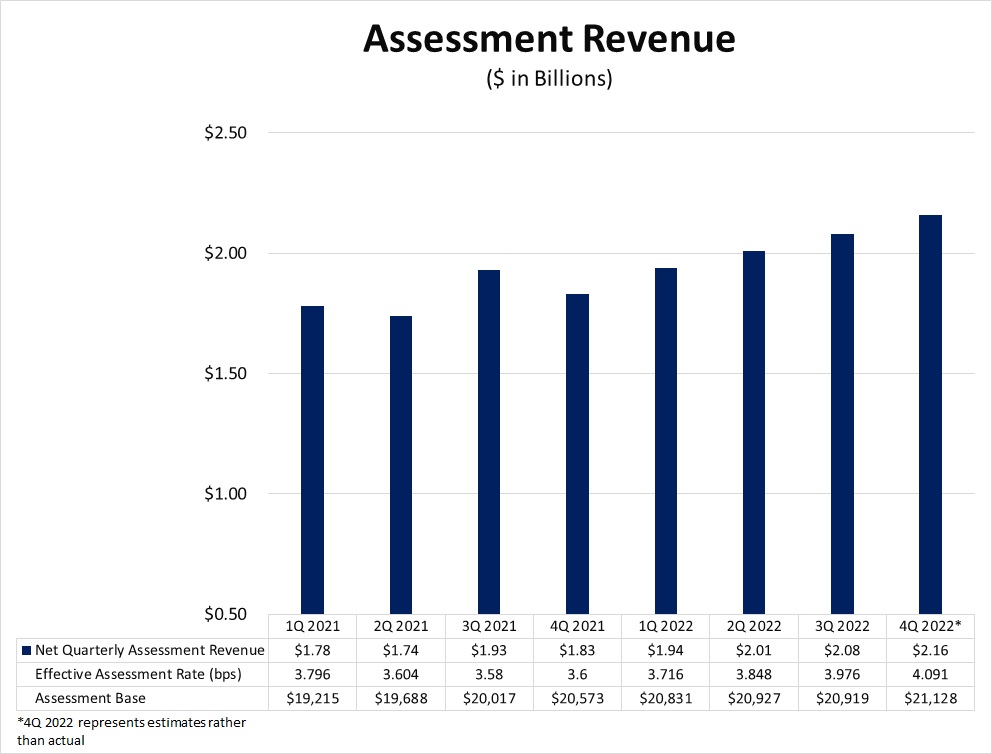
| 1Q2021 | 2Q2021 | 3Q2021 | 4Q2021 | 1Q2022 | 2Q2022 | 3Q2022 | 4Q20221 | |
|---|---|---|---|---|---|---|---|---|
| Net Quarterly Assessment Revenue | $1.78 | $1.74 | $1.93 | $1.83 | $1.94 | $2.01 | $2.08 | $2.16 |
| Effective Assessment Rate (bps) | 3.796 | 3.604 | 3.58 | 3.6 | 3.716 | 3.848 | 3.976 | 4.091 |
| Assessment Base | $19,215 | $19,688 | $20,017 | $20,573 | $20,831 | $20,927 | $20,919 | $21,128 |
| 1 4Q2022 represents estimates rather than actual | ||||||||
Assessment revenue was $8.3 billion for 2022, compared to $7.1 billion for 2021. The $1.2 billion year-over-year increase was primarily due to higher assessment base and rates.