
Selected Financial Data - Fourth Quarter 2021
| FSLIC Resolution Fund | |||||
|---|---|---|---|---|---|
| Dec-21 | Sep-21 | Quarterly Change | Dec-20 | Year-Over-Year Change | |
| Cash and cash equivalents | $908 | $908 | $0 | $907 | $1 |
| Accumulated deficit | (124,562) |
(124,562) |
0 |
(124,562) |
0 |
| Total resolution equity | 908 |
908 |
0 |
907 |
1 |
| Total revenue | 0 |
0 |
0 |
4 |
(4) |
| Operating expenses | 0 |
0 |
0 |
0 |
0 |
| Recovery of tax benefits | 0 |
0 |
0 |
0 |
0 |
| Losses related to thrift resolutions | 0 |
0 |
0 |
0 |
0 |
| Net Income (Loss) | $0 |
$0 |
$0 |
$4 |
($4) |
| $ in millions | DIF | FRF | ALL FUNDS | ||||||
|---|---|---|---|---|---|---|---|---|---|
| Dec 21 | Dec 20 | Change | Dec 21 | Dec 20 | Change | Dec 21 | Dec 20 | Change | |
| Total Receiverships | 191 | 234 | (43) | 0 | 0 | 0 | 191 | 234 | (43) |
| Assets in Liquidation | $92 |
$282 |
($190) |
$ 0 |
$ 1 |
($1) |
$92 |
$283 |
($191) |
| YTD Collections | $514 |
$512 |
$2 |
$1 |
$1 |
$ 0 |
$515 |
$513 |
$2 |
| YTD Dividend/Other Pmts - Cash | $586 |
$1,433 |
($847) |
$ 0 |
$ 0 |
$ 0 |
$586 |
$1,433 |
($847) |
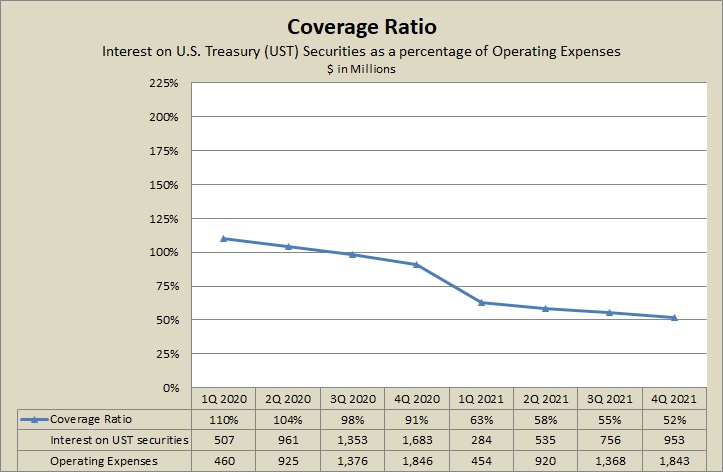
| 1Q2020 | 2Q2020 | 3Q202 | 4Q2020 | 1Q2021 | 2Q2021 | 3Q2021 | 4Q2021 | |
|---|---|---|---|---|---|---|---|---|
| Coverage Ratio | 110% | 104% | 98% | 91% | 63% | 58% | 55% | 52% |
| Interest on UST securities | 507 | 961 | 1,353 | 1,683 | 284 | 535 | 756 | 953 |
| Operating Expenses | 460 | 925 | 1,376 | 1,846 | 454 | 920 | 1,368 | 1,843 |