
Selected Financial Data - Third Quarter 2021
| FSLIC Resolution Fund | |||||
|---|---|---|---|---|---|
| Sep-21 | Jun-21 | Quarterly Change | Sep-20 | Year-Over-Year Change | |
| Cash and cash equivalents | $908 | $907 | $1 | $907 | $1 |
| Accumulated deficit | (124,562) |
(124,562) |
0 |
(124,562) |
0 |
| Total resolution equity | 908 |
907 |
1 |
907 |
1 |
| Total revenue | 0 |
0 |
0 |
4 |
(4) |
| Operating expenses | 0 |
0 |
0 |
0 |
0 |
| Recovery of tax benefits | 0 |
0 |
0 |
0 |
0 |
| Losses related to thrift resolutions | 0 |
0 |
0 |
0 |
0 |
| Net Income (Loss) | $0 |
$0 |
$0 |
$4 |
($4) |
| $ in millions | DIF | FRF | ALL FUNDS | ||||||
|---|---|---|---|---|---|---|---|---|---|
| Sep 21 | Sep 20 | Change | Sep 21 | Sep 20 | Change | Sep 21 | Sep 20 | Change | |
| Total Receiverships | 206 | 238 | (32) | 0 | 0 | 0 | 206 | 238 | (32) |
| Assets in Liquidation | $204 |
$370 |
($166) |
$ 0 |
$ 0 |
$0 |
$204 |
$370 |
($166) |
| YTD Collections | $212 |
$338 |
($126) |
$1 |
$1 |
$ 0 |
$213 |
$339 |
($126) |
| YTD Dividend/Other Pmts - Cash | $564 |
$1,301 |
($737) |
$ 0 |
$ 0 |
$ 0 |
$564 |
$1,301 |
($737) |
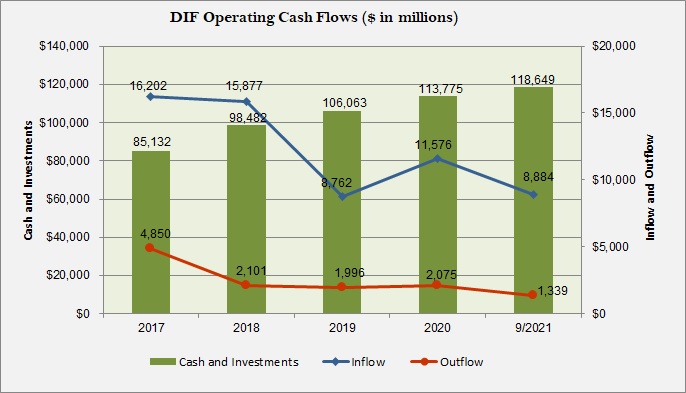
| 2017 | 2018 | 2019 | 2020 | 9/2021 | |
|---|---|---|---|---|---|
| Cash and Investments | $85,132 | $98,482 | $106,063 | $113,775 | $118,649 |
| Inflow | $16,202 | $15,877 | $8,762 | $11,576 | $8,884 |
| Outflow | $4,850 | $2,101 | $1,996 | $2,075 | $1,339 |