
DIF Balance Sheet - Second Quarter 2021
| Balance Sheet | |||||
|---|---|---|---|---|---|
| Jun-21 | Mar-21 | Quarterly Change | Jun-20 | Year-Over-Year Change | |
| Cash and cash equivalents | $5,361 | $4,895 | $466 | $5,144 | 217 |
| Investment in US Treasury securities | 111,991 | 110,680 | 1,311 | 105,024 | 6,967 |
| Assessments receivable | 1,755 | 1,941 | (186) | 1,632 | 123 |
| Interest receivable on investments and other asses, net | 832 | 969 | (137) | 1,369 | (537) |
| Receivables from resolutions, net | 908 | 1,220 | (312) | 1,860 | (952) |
| Property and equipment, net | 320 | 321 | (1) | 320 | 0 |
| Operating lease right-of-use assets | 100 | 110 | (10) | 118 | (18) |
| Total Assets | $121,267 | $120,136 | $1,131 | $115,467 | $5,800 |
| Accounts payable and other liabilities | 235 | 255 | (20) | 221 | 14 |
| Operating lease liabilities | 107 | 117 | (10) | 127 | (20) |
| Liabilities due to resolutions | 7 | 1 | 6 | 73 | (66) |
| Postretirement benefit liability | 336 | 336 | 0 | 289 | 47 |
| Contingent liabilty for anticipated failures | 35 | 65 | (30) | 74 | (39) |
| Contingent liabilty for guarantee payments and litigaton losses | 0 | 0 | 0 | 32 | (32) |
| Total Liabilities | $720 | $774 | ($54) | $816 | ($96) |
| FYI: Unrealized gain (loss) on US Treasury securities, net | 552 | 785 | (233) | 1,654 | (1,102) |
| FYI: Unrealized postretirement benefit (loss) gain | (98) | (98) | 0 | (61) | (37) |
| Fund Balance | $120,547 | $119,362 | $1,185 | $114,651 | $5,896 |
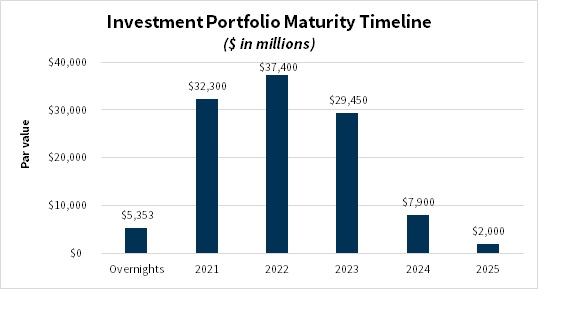
| Overnights | 2021 | 2022 | 2023 | 2024 | 2025 | |
|---|---|---|---|---|---|---|
| Investments Balance | $5,353 | $32,300 | $37,400 | $29,450 | $7,900 | $2,000 |