
DIF Balance Sheet - Second Quarter 2020
|
|
| Quarterly |
| Year-Over-Year |
|---|---|---|---|---|---|
| Balance Sheet | |||||
| Cash and cash equivalents | $5,144 | $9,490 | ($4,346) | $8,795 | ($3,651) |
| Investment in US Treasury securities | 105,024 | 99,733 | 5,291 | 94,524 | 10,500 |
| Assessments receivable | 1,632 | 1,357 | 275 | 1,060 | 572 |
| Interest receivable on investments and other assets, net | 1,369 | 709 | 660 | 694 | 675 |
| Receivables from resolutions, net | 1,860 | 2,456 | (596) | 3,204 | (1,344) |
| Property and equipment, net | 320 | 326 | (6) | 320 | 0 |
| Operating lease right-of-use assets | 118 | 120 | (2) | 0 | 118 |
| Total Assets | $115,467 | $114,191 | $1,276 | $108,597 | $6,870 |
| Accounts payable and other liabilities | 221 | 215 | 6 | 241 | (20) |
| Operating lease liabilities | 127 | 127 | 0 | 0 | 127 |
| Liabilities due to resolutions | 73 | 213 | (140) | 530 | (457) |
| Postretirement benefit liability | 289 | 289 | 0 | 236 | 53 |
| Contingent liability for anticipated failures | 74 | 107 | (33) | 111 | (37) |
| Contingent liability for guarantee payments and litigation losses | 32 | 34 | (2) | 33 | (1) |
| Total Liabilities | $816 | $985 | ($169) | $1,151 | ($335) |
| FYI: Unrealized gain (loss) on US Treasury securities, net | 1,654 | 2,037 | (383) | 500 | 1,154 |
| FYI: Unrealized postretirement benefit (loss) gain | (61) | (61) | 0 | (14) | (47) |
| Fund Balance | $114,651 | $113,206 | $1,445 | $107,446 | $7,205 |
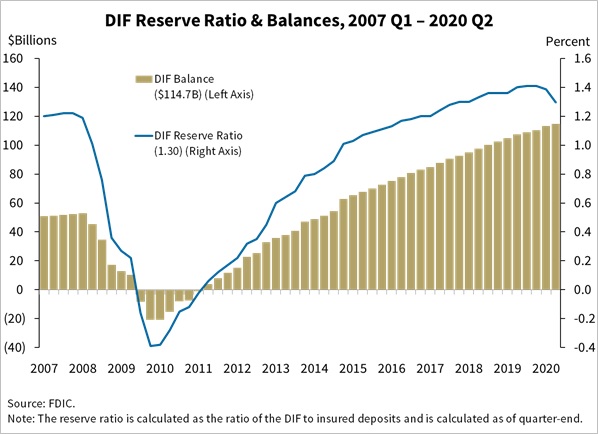
| DIF Reserve Ratio (percentage) | DIF Balance ($ in billions) | |
|---|---|---|
| Q1 2007 | 1.20 | $50.7 |
| Q2 2007 | 1.21 | $51.2 |
| Q3 2007 | 1.22 | $51.8 |
| Q4 2007 | 1.22 | $52.4 |
| Q1 2008 | 1.19 | $52.8 |
| Q2 2008 | 1.01 | $45.2 |
| Q3 2008 | 0.76 | $34.6 |
| Q4 2008 | 0.36 | $17.3 |
| Q1 2009 | 0.27 | $13.0 |
| Q2 2009 | 0.22 | $10.4 |
| Q3 2009 | -0.16 | ($8.2) |
| Q4 2009 | -0.39 | ($20.9) |
| Q1 2010 | -0.38 | ($20.7) |
| Q2 2010 | -0.28 | ($15.2) |
| Q3 2010 | -0.15 | ($8.0) |
| Q4 2010 | -0.12 | ($7.4) |
| Q1 2011 | -0.02 | ($1.0) |
| Q2 2011 | 0.06 | $3.9 |
| Q3 2011 | 0.12 | $7.8 |
| Q4 2011 | 0.17 | $11.8 |
| Q1 2012 | 0.22 | $15.3 |
| Q2 2012 | 0.32 | $22.7 |
| Q3 2012 | 0.35 | $25.2 |
| Q4 2012 | 0.45 | $33.0 |
| Q1 2013 | 0.60 | $35.7 |
| Q2 2013 | 0.64 | $37.9 |
| Q3 2013 | 0.68 | $40.8 |
| Q4 2013 | 0.79 | $47.2 |
| Q1 2014 | 0.80 | $48.9 |
| Q2 2014 | 0.84 | $51.1 |
| Q3 2014 | 0.89 | $54.3 |
| Q4 2014 | 1.01 | $62.8 |
| Q1 2015 | 1.03 | $65.3 |
| Q2 2015 | 1.07 | $67.6 |
| Q3 2015 | 1.09 | $70.1 |
| Q4 2015 | 1.11 | $72.6 |
| Q1 2016 | 1.13 | $75.1 |
| Q2 2016 | 1.17 | $77.9 |
| Q3 2016 | 1.18 | $80.7 |
| Q4 2016 | 1.20 | $83.2 |
| Q1 2017 | 1.20 | $84.9 |
| Q2 2017 | 1.24 | $87.6 |
| Q3 2017 | 1.28 | $90.5 |
| Q4 2017 | 1.30 | $92.7 |
| Q1 2018 | 1.30 | $95.1 |
| Q2 2018 | 1.33 | $97.6 |
| Q3 2018 | 1.36 | $100.2 |
| Q4 2018 | 1.36 | $102.6 |
| Q1 2019 | 1.36 | $104.9 |
| Q2 2019 | 1.40 | $107.4 |
| Q3 2019 | 1.41 | $108.9 |
| Q4 2019 | 1.41 | $110.3 |
| Q1 2020 | 1.39 | $113.2 |
| Q2 2020 | 1.30 | $114.7 |