
Selected Financial Data - First Quarter 2023
| FSLIC Resolution Fund | |||||
|---|---|---|---|---|---|
| Mar-22 | Dec-22 | Quarterly Change | Mar-22 | Year-Over-Year Change | |
| Cash and cash equivalents | $932 | $922 | $10 | $908 | $24 |
| Accumulated deficit | (124,537) |
(124,547) |
10 |
(124,562) |
25 |
| Total resolution equity | 933 |
922 |
11 |
908 |
25 |
| Total revenue | 10 |
15 |
0 |
10 |
|
| Operating expenses | 0 |
0 |
0 |
0 |
|
| Losses related to thrift resolutions | 0 |
0 |
0 |
0 |
|
| Net Income (Loss) | $10 |
$15 |
$0 |
$10 |
|
| $ in millions | DIF | FRF | ALL FUNDS | ||||||
|---|---|---|---|---|---|---|---|---|---|
| Mar 23 | Mar 22 | Change | Mar 23 | Mar 22 | Change | Mar 23 | Mar 22 | Change | |
| Total Receiverships | 127 | 188 | (61) | 0 | 0 | 0 | 127 | 188 | (61) |
| Assets in Liquidation | $27,7411 |
$86 |
$27,655 |
$0 |
$0 |
$0 |
$27,741 |
$86 |
$27,655 |
| YTD Collections | $14 |
$34 |
($20) |
$0 |
$0 |
($1) |
$14 |
$34 |
($20) |
| YTD Dividend/Other Pmts - Cash | $40,039 |
$103 |
$39,936 |
$0 |
$0 |
$0 |
$40,039 |
$103 |
$39,936 |
1Does not incluede all of the assets retained by the SVB and Signature Bank receiverships until further analysis can be completed on various asset types.
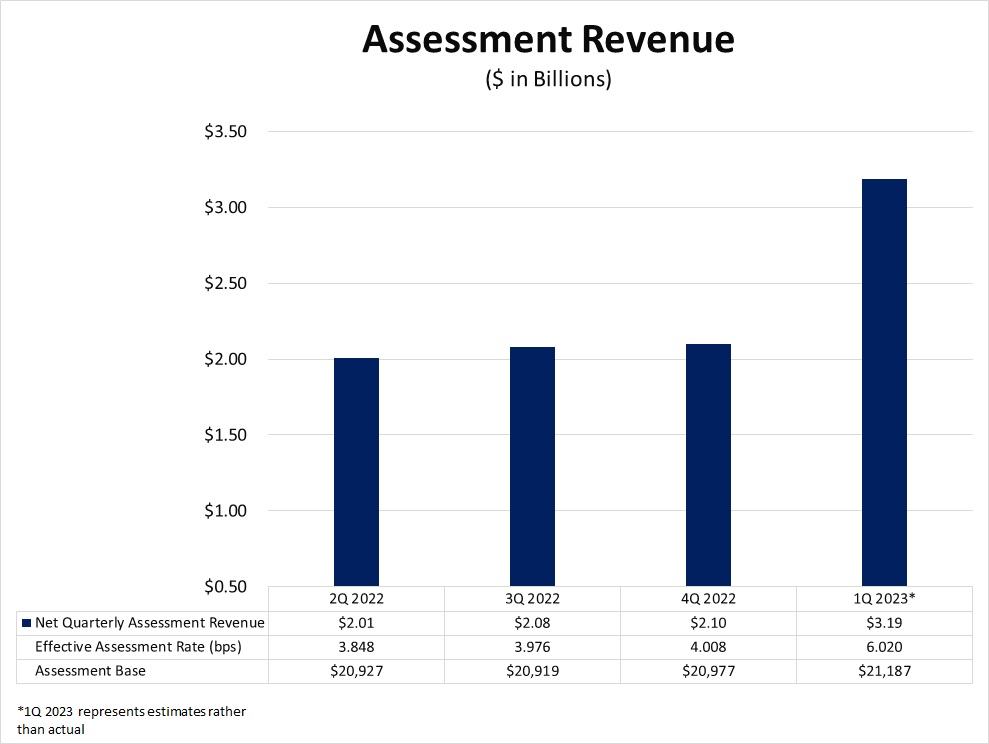
| 2Q2022 | 3Q2022 | 4Q2022 | 1Q2023 | |||||
|---|---|---|---|---|---|---|---|---|
| Net Quarterly Assessment Revenue | $2.01 | $2.08 | $2.10 | $3.19 | ||||
| Effective Assessment Rate (bps) | 3.848 | 3.976 | 4.008 | 6.020 | ||||
| Assessment Base | $20,927 | $20,919 | $20,977 | $21,187 | ||||
| 1 4Q2022 represents estimates rather than actual | ||||||||
1Q23 assessment revenue rose by $1.1b due to a 2 basis point increase in assessmet rates as mandated by the amended restoration plan.