
DIF Balance Sheet - First Quarter 2021
| Balance Sheet | |||||
|---|---|---|---|---|---|
| Mar-21 | Dec-20 | Quarterly Change | Mar-20 | Year-Over-Year Change | |
| Cash and cash equivalents | $4,895 | $3,311 | $1,584 | $9,490 | ($4,595) |
| Investment in US Treasury securities | 110,680 | 110,464 | 216 | 99,733 | 10,947 |
| Assessments receivable | 1,941 | 1,949 | (8) | 1,357 | 584 |
| Interest receivable on investments and other asses, net | 969 | 1,159 | (190) | 709 | 260 |
| Receivables from resolutions, net | 1,220 | 1,367 | (147) | 2,456 | (1,236) |
| Property and equipment, net | 321 | 321 | 0 | 326 | (5) |
| Operating lease right-of-use assets | 110 | 112 | (2) | 120 | (10) |
| Total Assets | $120,136 | $118,683 | $1,453 | $114,191 | $5,945 |
| Accounts payable and other liabilities | 255 | 251 | 4 | 215 | 40 |
| Operating lease liabilities | 117 | 119 | (2) | 127 | (10) |
| Liabilities due to resolutions | 1 | 1 | 0 | 213 | (212) |
| Postretirement benefit liability | 336 | 336 | 0 | 289 | 47 |
| Contingent liabilty for anticipated failures | 65 | 79 | (14) | 107 | (42) |
| Contingent liabilty for guarantee payments and litigaton losses | 0 | 0 | 0 | 34 | (34) |
| Total Liabilities | $774 | $786 | ($12) | $985 | ($211) |
| FYI: Unrealized gain (loss) on US Treasury securities, net | 785 | 1,070 | (285) | 2,037 | (1,252) |
| FYI: Unrealized postretirement benefit (loss) gain | (98) | (98) | 0 | (61) | (37) |
| Fund Balance | $119,362 | $117,897 | $1,465 | $113,206 | $6,156 |
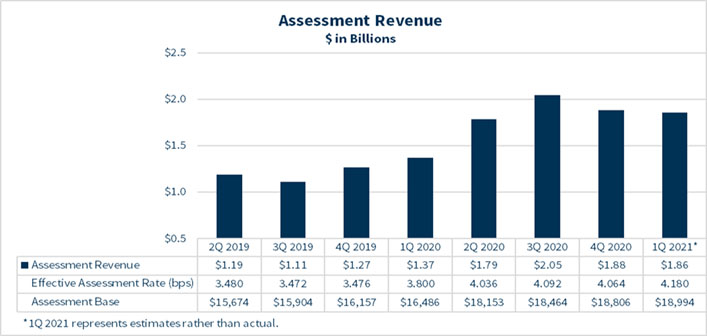
| 2Q 2019 | 3Q 2019 | 4Q 2019 | 1Q 2020 | 2Q 2020 | 3Q 2020 | 4Q 2020 | 1Q 2021* | |
|---|---|---|---|---|---|---|---|---|
| Assessments Revenue | $1.19 | $1.11 | $1.27 | $1.37 | $1.79 | $2.05 | $1.88 | $1.86 |
| Effective Assessment Rate (bps) | 3.480 | 3.472 | 3.476 | 3.800 | 4.036 | 4.092 | 4.064 | 4.180 |
| Assessment Base | $15,674 | $15,904 | $16,157 | $16,486 | $18,153 | $18,464 | $18,806 | $18,994 |
*1Q 2021 represents estimates rather than actual.
Beginning in 4Q 2019, a combination of increases in assessment rates and the assessment base contributed to higher quarterly assessment revenue through 3Q 2020. For the subsequent two quarters, assessment revenue declined slightly due to adjustments in estimated versus actual collections for the prior quarter.
Assessment revenue was offset by small bank credits of $320 million in 2Q 2019, $239 million in 3Q 2019, $149 million in 4Q 2019, $51 million in 1Q 2020, and $6 million in 2Q 2020.