
The quality of an institution’s lending portfolio is key to its long-term financial success. As such, the FDIC closely monitors changes in underwriting practices and credit risk trends industrywide and at individual institutions. Risk management examiners assist by completing the post-examination Credit and Consumer Products/ Services Survey (Credit Survey). This article summarizes survey results for examinations of FDIC-supervised institutions completed through October 3, 2017. To summarize the findings, survey responses indicative of increasing credit risk and liquidity risk are becoming more frequent.
Background
Since 2009, FDIC examiners have assessed lending conditions and risks at the conclusion of each examination using the Credit Survey.1 Completion of the Credit Survey yields information about loan underwriting practices, including whether underwriting is becoming tighter or looser; local economic conditions; out-of-area lending; and new or evolving products and activities. In addition, credit, funding and asset/liability management strategies are evaluated at all institutions. Additional information on credit-risk management practices and local market conditions is collected at institutions with elevated levels of commercial real estate (CRE) or acquisition, development, and construction (ADC) loans. Responses to the survey questions are based on the examiner’s assessment of the entire portfolio, rather than just the sample of loans reviewed during the examination.
FDIC examiners generate surveys from roughly 45 percent of all FDIC- supervised institutions each year. The Credit Survey supplements the collection of more traditional examination data to promote a more forward-looking analysis and view of the banking industry’s lending practices and credit risk profile. Credit Survey results are shared regularly with the public through articles published in the Supervisory Insights journal.2
Current Lending Conditions
The banking industry’s profitability reached a post-crisis high in second quarter 2017, and new loan activity is a prominent driver in the industry’s growth.3 Loan volume continues to grow as the economy expands for the ninth consecutive year. Total loans and leases reported by FDIC-insured institutions increased to $9.5 trillion as of June 30, 2017, up 3.7 percent from a year ago. The proportion of institutions growing loan portfolios remains high; 78 percent of insured institutions expanded loan portfolios through the first half of 2017, in line with 79 percent the year before. The level of unused loan commitments, $7.3 trillion as of June 30, 2017, also has been increasing, and is up 3.9 percent from a year ago. While the growth in unused loan commitments has slowed for six consecutive quarters, it remains an indicator that loan growth may continue into the near term.
Overall, loan performance appears favorable, as indicated by the near record low level of the industry’s past due and nonaccrual (PDNA) ratio, which measures loans 30 days or more past due or in non-accrual status as a percentage of total loans. As of June 30, 2017, the PDNA ratio for all institutions was 1.84 percent, down 29 basis points from a year ago. During the past 33 years, the industry has reported only 12 quarters with a lower PDNA ratio, all of which were in the years leading up to the crisis from 2004 to 2007. However, the PDNA can be a lagging indicator of loan quality, particularly during cycles of new loan growth as borrowers generally do not default immediately after a loan is disbursed.
Credit Survey Highlights
Information in the Credit Survey reflects examiners’ view of emerging credit and funding risks in each institution’s balance sheet. In addition, survey questions solicit examiners’ comments about new or evolving products or activities identified at the institution or from competitors. In 2016 and 2017, around 13 percent of surveys indicate institutions are adding new products or activities that could pose additional risks. Among the most frequently cited features includes the following:
- Out-of-area lending (including whole loan purchases, loan participations, and shared national credits);
- Growth in loans, ADC or CRE concentrations, assets, or deposits; and
- Higher risk practices in lending or underwriting, often in response to increased competition
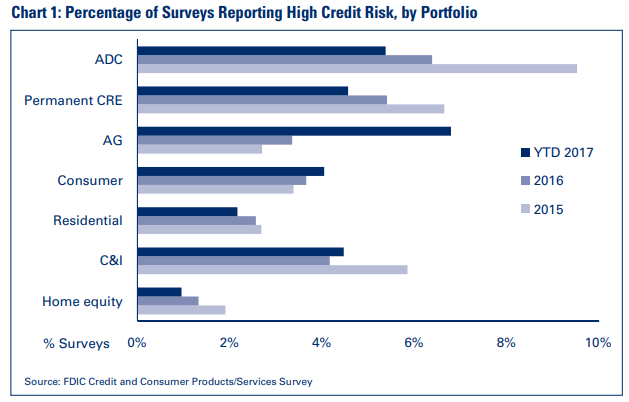
In 2016 and 2017, examiners characterized 17 percent of the institutions surveyed as “low” credit risk, 72 percent as “moderate” risk, and 11 percent as “high” risk.4 This is a notable improvement from the Survey’s worst reports for credit risk, recorded in 2010, when 42 percent of surveyed institutions were characterized with “high” credit risk. When comparing credit risk more recently, and more granularly among the specific loan products assessed, agricultural loan portfolios are characterized more often as “high” risk compared to other portfolios, and the percentage of surveys that designate agricultural loan portfolios as “high risk” has more than doubled during the past two years (see Chart 1). This reflects developments in the agricultural economy, as discussed later in this article.
While the Credit Survey results suggest that the level of credit risk is manageable for most institutions, the results also indicate the more forward-looking metrics are showing signs of increasing risk at some institutions. As lending has increased, so has the percentage of surveys reporting concentrations of credit, use of potentially volatile funding sources, and out-of-area lending. This article will discuss trends in examiner responses to these areas.
Surveys Note Risks Among Faster Growing Institutions
Credit Surveys prompt examiners to assess an institution’s underwriting practices for eight loan products.5 Since January 1, 2016, examiners characterized underwriting practices at 20 percent of the surveyed institutions as “generally conservative,” 70 percent as “about average,” and 10 percent as “generally liberal.” In general, examiners identify the majority of the institutions surveyed as following appropriate credit risk management practices. Within the survey, examiners also characterize the risk associated with loan growth or with significant changes in lending activities. Among the institutions surveyed in 2016 and 2017, examiners categorized such risks as “immaterial” in 19 percent of surveys; as “low” in 36 percent of surveys; as “moderate” in 41 percent of surveys; and as “high” in 4 percent of surveys. Since 2015, the proportion of institutions described with “moderate” or “high” risk associated with loan growth or significant changes in lending activities has increased about 7 percentage points, most predominantly in the “moderate” category.
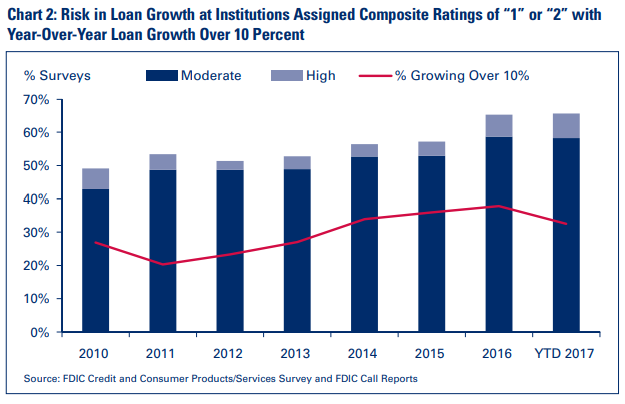
The proportion of institutions assigned a composite rating of “1” or “2” and growing loans by more than 10 percent is also increasing.6 Five years ago, around 23 percent of institutions surveyed and assigned a composite rating of “1” or “2” reported loan growth over 10 percent; last year, that percentage increased to 38 percent and is down slightly through the first nine months of 2017 at 33 percent (see Chart 2). Looking specifically at results for these institutions surveyed between January 2016 and September 2017, examiners characterized more than 65 percent with moderate to high risk relating to loan growth or lending changes (see Chart 2). This is up from 57 percent in 2015. In addition, the proportion of these faster-growing institutions characterized as having “high” risk related to loan growth has increased to over 7 percent, more than double what it was three years ago.
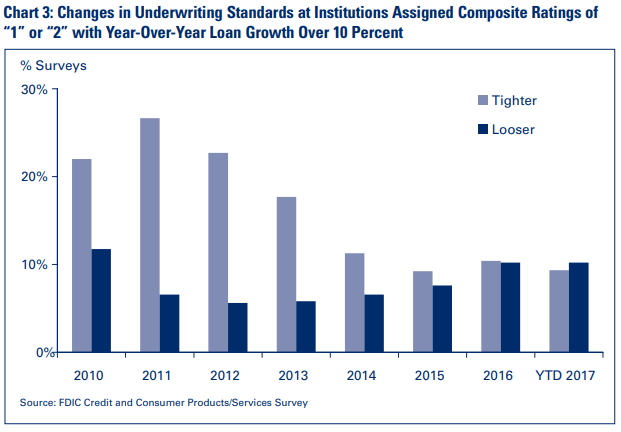
Among those institutions surveyed with year-over-year loan growth over 10 percent and a composite rating of “1” or “2,” 2017 survey results reflect for the first time a higher proportion of institutions loosening underwriting practices (10 percent) compared to those that are tightening (9 percent) (see Chart 3). About 81 percent of survey responses for this faster growing group of institutions reported no material changes in underwriting trends in comparison to the last examination. For comparison, among 2017 surveyed institutions assigned composite ratings of “1” or “2” that report loan growth less than 10 percent of total assets, 85 percent indicate no material changes in underwriting standards, 9 percent indicate standards are tightening, and 6 percent indicate standards are loosening.
Other Factors Affect Loan Underwriting
Competitive forces, changes in economic conditions, and response to regulatory findings or actions influence underwriting practices. An institution operating in a favorable economy with strong competition may ease credit standards to remain competitive. Conversely, institutions in an area where the economy is stressed may respond by tightening credit standards to limit potential credit loss. Similarly, institutions experiencing unfavorable regulatory ratings or corrective supervisory actions may respond by tightening underwriting standards to control additional risks of loss.
In surveys that indicated loosening standards, the factors most commonly listed for influencing changes in underwriting practices included competitive forces, growth goals, or changes in economic conditions.
Among institutions surveyed with an assigned composite rating of “1” or “2,” more than 51 percent of those reporting loosening credit standard practices identified competition as a leading factor. Other frequently cited factors included an institution’s growth goals (noted in 42 percent of surveys that reported loosening credit standards), followed by the economic environment (identified in 34 percent of those surveys).
Among those institutions tightening underwriting standards, changes in economic conditions and responses to regulatory findings or actions were the most common factors driving the changes. Again, looking at institutions assigned a composite rating of “1” or “2,” about 41 percent of those tightening underwriting standards cite the economic environment as a reason for that change, and about 36 percent listed regulatory actions as an influencing factor.
Out-of-Area Lending Activity is Increasing
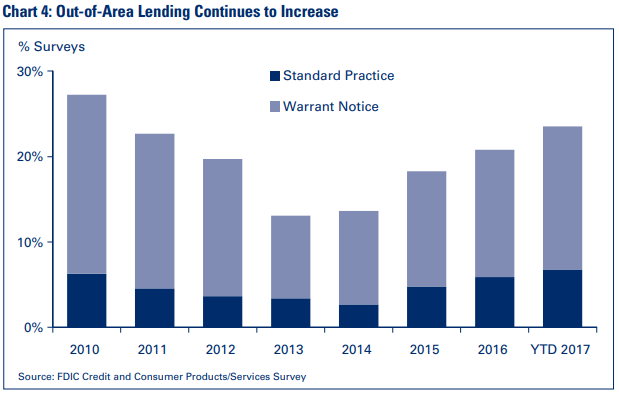
As loan growth continues industrywide, out-of-area lending is also on the rise (see Chart 4). In the years leading up to the crisis, out-of-territory loans swelled as more institutions extended credit in areas of the country experiencing strong economic conditions. Frequently, these loans were underwritten by other financial institutions or non FDIC-insured loan brokers and purchased whole or through participations. As discussed in a Winter 2013 Supervisory Insights article, during the crisis many of these out-of-territory loans deteriorated quickly.7 Problems experienced by institutions that made these loans were often exacerbated by weak due diligence, unfamiliarity with the credit market where the loan originated, and over-reliance on a third party that failed to properly manage the loan.
Immediately following the crisis, Credit Survey results indicated that out-of-territory lending was on the decline, dropping to as low as 13 percent of surveys. Since 2014, that trend has reversed, and now over 23 percent of 2017 surveys note out-of- area loans. The risk within those loan portfolios also is increasing. In 2017, roughly 7 percent of surveys indicate out-of-area lending is a common or standard practice. Further, the number of institutions holding out-of- territory loans that “warrant notice” has been climbing steadily during the past three years.8 Almost 17 percent of institutions surveyed in 2017 had out-of-territory loans that warrant notice, up from 15 percent in 2016 and from less than 14 percent in 2015. Among the surveys recorded in 2017 with out-of-area lending, over 80 percent of that activity is listed in direct or indirect commercial lending.
More Surveys Note Concentrations in Credit and Funding
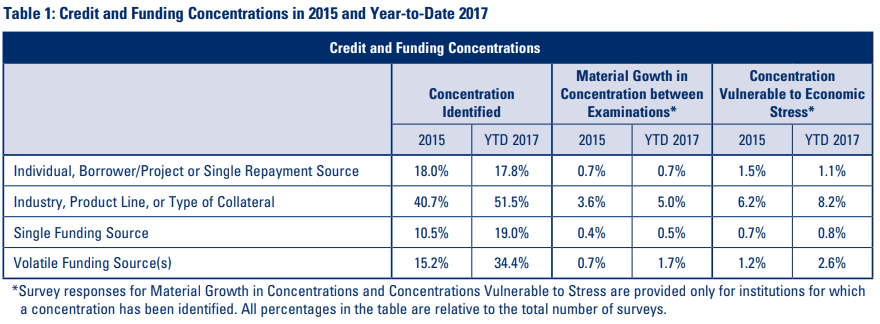
As aggregate loan balances have increased during the past few years, concentrations in credit and funding also have been on the rise. Among the Credit Surveys collected through third quarter 2017, nearly 68 percent identify either a credit or funding concentration.9 This represents an increase since 2015 when less than 56 percent of surveys noted some type of credit or funding concentration. When comparing results from 2015 and 2017, the increase in the percentage of surveys reporting concentrations was most pronounced in the category of “volatile funding” (see Table 1). The majority (about 52 percent) of Credit Surveys in 2017 recorded an industry, product line, or collateral- type concentration, with about a sixth of those (8 percent of all Credit Surveys) also recording a vulnerability to economic stress.
Layered risk, or the combination of two or more risks, is emerging at institutions with credit and funding concentrations. Among the 2017 Credit Surveys that recorded an industry, credit product, or collateral concentration, half also listed a funding or potentially volatile funding source concentration (see Chart 5).10
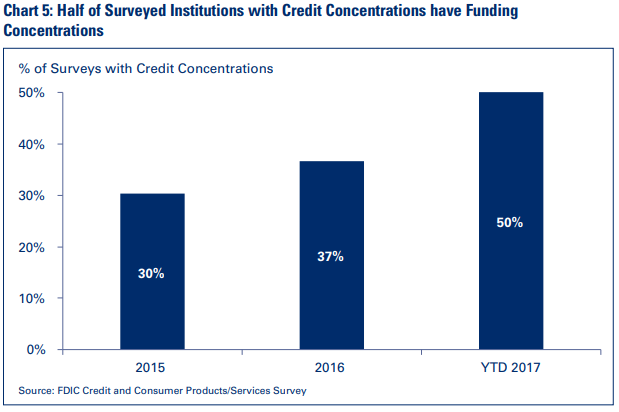
*The above chart excludes survey data prior to 2015 for congruency. In 2014, the FDIC updated the Report of Examination Concentrations page instructions to provide expanded details for improved identification and risk analysis of concentrated credit and funding exposures. Several concentration- related Credit Survey questions were also revised to reflect those changes.11
During the past three years, this trend has been evident as institutions are growing their loan portfolios and searching for accessible sources of liquidity to fund that growth.
Credit concentrations most commonly noted by examiners completing the Credit Survey included CRE, agricultural, and to a lesser extent, ADC and 1-4 family residential real estate. Studies following the 2008 crisis have shown that poorly managed CRE concentrations, particularly in conjunction with a reliance on potentially volatile funding sources, were highly correlated with failure.12 This is a reminder that strong risk management practices, crucial for all institutions, are especially important for institutions with elevated concentrations in CRE and volatile funding. As discussed in the Summer 2016 Supervisory Insights article on matters requiring board attention, supervisory recommendations most frequently made to institutions with elevated CRE concentrations included an emphasis on strong board and management oversight, appropriate portfolio management, and CRE portfolio stress sensitivity testing.13
Credit Survey results report a rise in agricultural lending concentrations likely due to an increase in farmers’ demand for bank financing. Farmers experienced several high-earning years early in this decade, which allowed many of them to self-finance operations. However, a drop in commodity prices has depressed farm income and producers’ working capital levels, resulting in higher agricultural loan demand for many institutions in or near agricultural areas. These institutions are susceptible to commodity price, weather, and land value volatilities. Therefore, it is important for institutions engaged in agricultural lending to maintain sound underwriting standards, strong credit administration practices, and effective risk management strategies.
In addition, Credit Survey results have evidenced rising levels of potentially volatile funding concentrations. Examiners have identified increases in funding concentrations, most commonly in uninsured large deposits; Federal Home Loan Bank borrowings; brokered deposits; and Internet, listing service, or high-rate deposits. Credit Survey results continue to indicate a risk-building environment with many institutions growing balance sheets with higher levels of potentially non-stable funding sources. For instance, in 2015, examiners identified funding concentrations at 21 percent of institutions surveyed; in 2017, that level had increased to 40 percent. For those institutions increasing loans while reducing holdings in liquid assets, it is imperative that strong underwriting standards are maintained, and prudent liquidity risk management is practiced.
Risk Management
The FDIC has longstanding expectations for responsible credit risk management and liquidity risk management, which include implementing and adhering to prudent underwriting practices appropriate for the size and complexity of the institution’s business model and maintaining strong board and management oversight of lending activities and funding strategies, including having appropriate contingency funding plans. Since loans make up the largest asset class at most institutions, it is especially important for institutions’ board and management teams to establish a strong risk management program for the lending function and implement appropriate strategies when funding additional growth. As loan portfolios are growing and concentrations are building, the best time to focus on strong risk management practices is before financial metrics are adversely affected.
Conclusion
Recent Credit Survey results suggest that the direction of risk is increasing in the industry, as reflected by more frequent reports of credit concentrations, increases in potentially volatile funding sources, and more out-of-area lending. The lending provided by insured institutions plays an essential role in supporting credit creation and economic activity, and institutions are benefitting from loan demand with positive earnings performance. Particularly when loan demand is strong, competition can prompt institutions to loosen underwriting standards to build or maintain market share. Historically, institutions that have experienced the most consistent financial success and stability throughout the economic cycle have achieved it through prudent underwriting, sound funding strategies, and strong and forward- looking risk management practices.
Continued analysis of Credit Survey results, in tandem with other financial and economic data, enables FDIC supervisory staff to effectively monitor the overall financial condition of insured depository institutions. The FDIC will continue to evaluate Credit Survey data together with other sources of information to proactively identify and address lending matters or emerging trends at the institutions we supervise.
Angela M. Herrboldt
Senior Examination Specialist
Division of Risk Management Supervision
AHerrboldt@fdic.gov
Kenneth A. Weber
Senior Quantitative Risk Analyst
Division of Risk Management Supervision
KWeber@fdic.gov
1 An earlier version of the underwriting survey, that was less amenable to horizontal analysis of results, dates back to 1995.
2 Past Supervisory Insights articles summarizing Credit Survey results include:
https://www.fdic.gov/regulations/examinations/supervisory/insights/siwin15/siwinter15-article3.pdf;
https://www.fdic.gov/regulations/examinations/supervisory/insights/siwin13/siwinter13-article2.pdf;
https://www.fdic.gov/regulations/examinations/supervisory/insights/sisum12/sisummer12-article3.pdf; and
https://www.fdic.gov/regulations/examinations/supervisory/insights/siwin10/siwinter10-article2.pdf.
3 Financial data and banking statistics obtained from FDIC Call Reports or Quarterly Banking Profile, Second Quarter 2017, https://www.fdic.gov/analysis/quarterly-banking-profile/qbp/2017jun/qbp.pdf.
4 The Credit Survey asks examiners to characterize the institution’s level of risk associated with various loan products as “low,” “moderate,” or “high;” loan products listed include commercial and industrial loans and leases, ADC loans, permanent CRE loans, residential mortgage loans, home equity loans, agricultural loans, consumer loans, and credit card loans. These descriptors apply only to institutions with lending portfolios representing more than two percent of total assets (“de minimis portfolio rule”).
5 The Credit Survey asks examiners to describe current underwriting practices as “Generally Conservative,” “About Average,” or “Generally Liberal.” The eight portfolios considered are commercial and industrial, ADC, permanent CRE, residential mortgage, home equity, agricultural, consumer, and credit card. These descriptors apply only to institutions with lending portfolios representing more than two percent of total assets (“de minimis portfolio rule”).
6 FDIC-supervised institutions rated “1” or “2” are defined by the Uniform Financial Institutions Rating System, FIL-105-96, “Adoption of Revised FFIEC Policy Statement on Uniform Financial Institutions Rating System,” December 26, 1996. https://www.fdic.gov/news/financial-institution-letters/1996/fil96105.html.
7 See footnote 2.
8 The Credit Survey asks examiners to characterize an institution’s level of engagement in direct or indirect out-of-area lending for three different loan products as “never or infrequently,” “frequently enough to warrant notice,” or “commonly or as standard practice.” Loan products include Commercial (including CRE/ADC and Ag), Residential Mortgage/Home Equity, and Other Consumer (excluding credit cards). Indirect lending includes purchased out-of-area participation.
9 The credit and funding concentration is divided into four types: “Individual, Borrower/Project, or Single Repayment Source,” “Industry, Product Line, or Type of Collateral,” “Single Funding Source,” and “Volatile Funding Source(s).” The Credit Survey asks examiners to respond to credit or funding concentration observations as “Concentration Identified,” “Material Growth in Concentration between Examinations,” “Concentration Vulnerable to Economic Stress,” or “none.”
10 Potentially volatile funding sources most commonly listed in the surveys include uninsured large depositors; borrowings, including wholesale; brokered deposits; Internet, listing service, and high-rate deposits; and public funds.
11 FDIC Risk Management Manual of Examination Policies, https://www.fdic.gov/regulations/safety/manual/section16-1.pdf.
12 FDIC, Office of the Inspector General, Comprehensive Study on the Impact of the Failure of Insured Depository Institutions, EVAL-13-002, January 2013, pages 49-50; https://www.fdicoig.gov/sites/default/files/reports/2022-08/13-002EV.pdf.
13 Angela M. Herrboldt; Kenneth A. Weber, “’Matters Requiring Board Attention’ Underscore Evolving Risks in Banking,” Supervisory Insights, Summer 2016. https://www.fdic.gov/regulations/examinations/supervisory/insights/sisum16/sisummer16-article2.pdf.