
FDIC examiners have completed the Credit and Consumer Products/Services Survey (Survey) at the conclusion of all risk management examinations since October 2009. The Survey solicits examiner assessments on the level of risk and quality of underwriting on nine credit products and information on new and evolving banking activities and products, local commercial real estate (CRE) market conditions, and funding practices.
Survey results for 2011 were presented most recently in the Summer 2012 issue of Supervisory Insights with a discussion of how banks were responding to ongoing economic and competitive challenges, including an assessment of general underwriting and loan growth trends.1 As noted in the article, the FDIC continues to review and analyze data from this Survey. This article summarizes recent Survey results and provides insights on lending trends and the changing risk profiles of insured institutions.
During the eighteen months ending June 30, 2013, more than 3,700 surveys were completed by FDIC examiners based on risk management examination findings. On average, approximately 1,200 surveys are generated every six months at insured institutions across the country. Since the Survey was revised in October 2009,2 many banks have had multiple surveys completed by FDIC examiners. Since implementation of the Survey, almost all 4,375 institutions supervised by the FDIC have a completed survey with 64 percent having multiple surveys.
In addition to sharing Survey results with the industry through articles in the Supervisory Insights journal, this information is available to the FDIC’s supervisory staff across the country. By combining Survey results with other information such as financial, economic, and examination data, supervisory staff can better identify trends, conduct enhanced forwardlooking analyses, and make more informed decisions regarding supervisory policies, examination scheduling, and examination risk scoping.
General Underwriting and Credit Trends
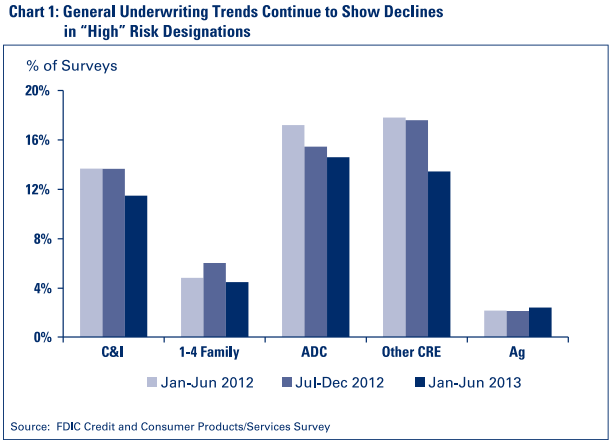
Recent Survey results generally indicate continued improvement in overall credit risk profiles and underwriting practices, which supports the trend of gradual strengthening in asset quality at many institutions as they recover from the most recent financial crisis. For the eighteen months ending June 30, 2013,3 the percentage of respondents designating one or more loan portfolios as “high” risk declined for all portfolios except Agricultural loans, which evidenced a slight uptick during the first six months of 2013 (see Chart 1).4 When characterizing loan underwriting practices, respondents reported a similar positive trend. The percentage of respondents describing an institution’s underwriting as “generally liberal” declined in all portfolios except Commercial and Industrial, while there was an increase in the percentage of institutions considered to have “generally conservative” underwriting practices.
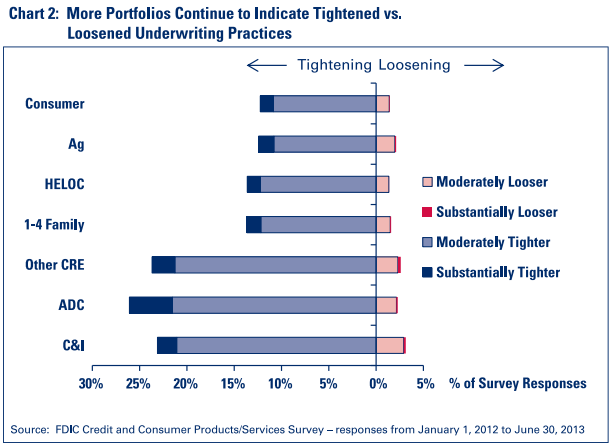
For those institutions captured in the Survey during the eighteen-month period, roughly 76 percent of respondents indicated no material change in loan underwriting practices since the last examination. However, when examiners did observe a change in practices, they reported that a greater percentage of institutions are tightening rather than loosening underwriting standards (see Chart 2 for changes in underwriting for seven loan types). Furthermore, examiners indicated that banks that are experiencing loan growth have not been loosening standards as the Survey results reflect “low” risk in these portfolios. Similar to results published in the Summer 2012 issue of Supervisory Insights, examiners are reporting that institutions have been more likely to tighten rather than loosen loan underwriting, most notably in the commercial-related portfolios (Commercial/Industrial (C&I), Acquisition, Development, and Construction (ADC), and Other CRE).
The primary factors that continue to influence changes in underwriting practices are changes in economic conditions, changes in condition of the institution, and responses to regulatory findings/actions. An institution that is distressed or operating in a depressed market often responds by tightening credit standards. A similar response is common when a bank is faced with unfavorable regulatory findings, ratings, and enforcement actions.
Higher-Risk Practices
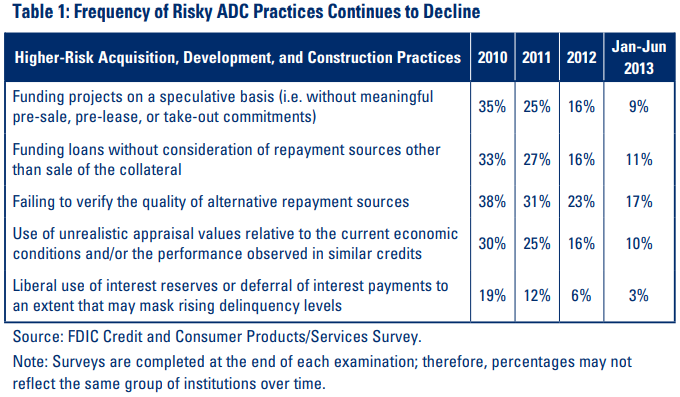
The Survey also includes questions that focus on higher-risk lending practices. Although less common in 2012 and 2013 compared to previous years, such practices continue to exist most frequently in ADC lending. As reflected in Table 1, five higher-risk practices associated with construction lending were characterized by examiners as “frequently enough to warrant notice” or “as a standard practice” in more than one quarter of the institutions captured in the survey during 2011. However, the frequency of these practices continues to drop with fewer than 20 percent of institutions with responses for this question engaging in four of these practices in 2012, and with further declines during the first half of 2013. Among these risky practices, the most frequently observed practice is a failure to verify the quality of alternative repayment sources when market conditions are strong, projects are completed, and loans are paid as agreed. However, as was evident during the latest economic downturn, ADC loans across the country became nonperforming as developers could not generate sales, and alternative repayment sources were nonexistent.
Out-of-area lending grew dramatically in the years before the crisis as more institutions extended credit in areas of the country with particularly strong economies. These loans often were purchased whole or in participations underwritten by other financial institutions. Many failed banks had relatively large portfolios of out-of-area loans that deteriorated quickly and were exacerbated by weak due diligence at origination, lack of knowledge of the area where the loan was made, and reliance on a third party that poorly managed the credit. Survey results suggest insured institutions are implementing lessons learned from the crisis, with fewer banks making out-of-area loans. Survey results show that the extent banks have been engaged in out-of-area lending continues to decline for ADC and Other CRE, while the frequency of out-of-area 1-4 family residential lending remains stable (see Chart 3 for historical trends).
Growth in Concentrated Loan Portfolios and Unfunded Commitments5
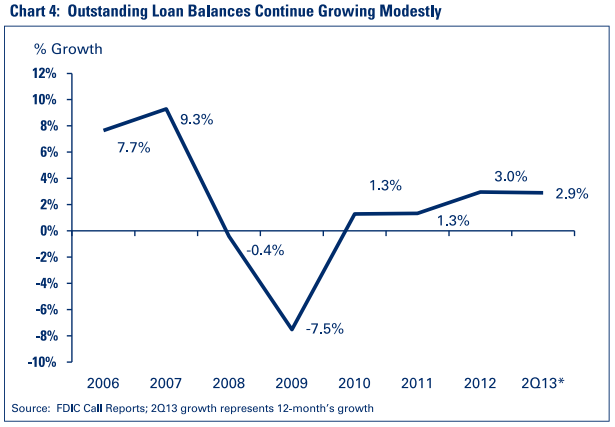
Aggregate loan balances have been rising, even though overall underwriting standards have been tightened. As previously discussed, the frequency of higher-risk practices, such as out-of-area lending, has been reduced. As shown in Chart 4, outstanding loans increased dramatically from 2006 to a peak in mid-2008, and began to decline during the financial crisis. From late 2008 through 2010, the collapse of the credit and housing markets significantly reduced residential mortgage originations and ADC lending.
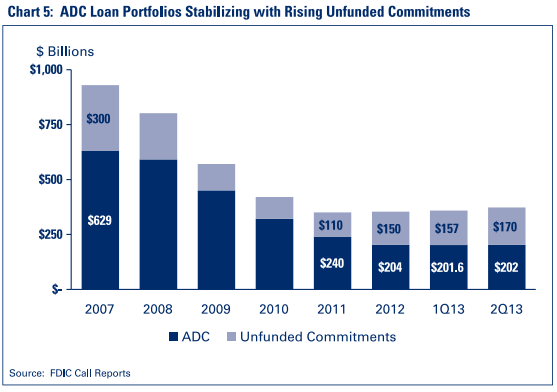
In particular, ADC loan balances have declined more than 65 percent from the peak in first quarter 2008 as lenders continue to write down and transfer loans to ORE. However, in second quarter 2013, ADC loans posted a slight increase in outstanding balances and, more dramatically, in unfunded commitments. Unfunded commitments for commercial real estate projects significantly exceed those for residential projects (see Chart 5 for a breakdown of on-book and off-balance sheet ADC lending).
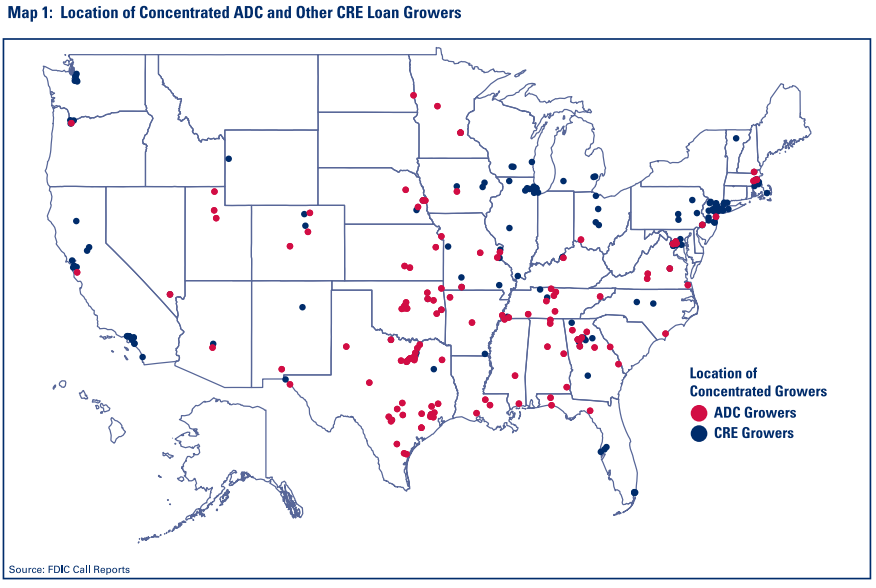
Approximately 300 institutions with concentrated ADC and Other CRE loan portfolios are increasing these portfolios.6 When owner-occupied properties are included, the number of institutions is almost 550. A majority of the concentrated loan growth is in the commercial real estate portfolio with over 170 banks growing concentrated loan portfolios.7 ADCconcentrated growth is on the rise with more than 100 banks growing concentrated portfolios. Map 1 (see page 22) shows where banks are growing concentrated portfolios; many are in states hit hardest during the recent crisis, including Illinois, Florida, California, and Georgia. New Jersey has the greatest percentage of Other CRE-concentrated banks increasing this loan type with 17 percent of that state’s insured institutions;8 Texas has the greatest percentage of ADC-concentrated banks increasing ADC loans at almost 7 percent of the state’s insured institutions.
Coming after a long real estate downturn, a return to growth could be considered a healthy sign, especially since Survey results indicate these banks generally have not loosened underwriting standards. Nevertheless, growth in concentrated portfolios has been an important risk factor in banking crises, such as the farm crisis in the early 1980s, the oil and gas crisis in the mid-1980s, the New England real estate crisis in the early 1990s,9 and the most recent crisis.10 Concentrations of credit require greater levels of risk assessment, monitoring, and management. Moreover, appreciable loan growth should be supported by an appropriate infrastructure of skilled lenders operating under a framework of appropriate underwriting, credit administration, and risk management policies.
Overall Loan Growth and its Influences
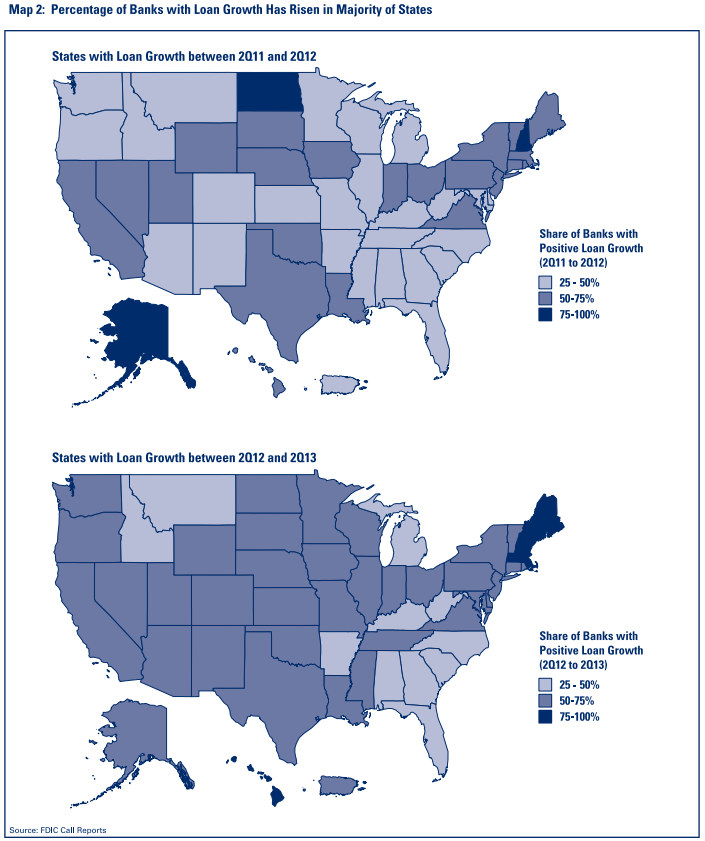
Lending activity is on the rebound across the country, albeit at a modest pace.11 Almost 60 percent of insured depository institutions have grown their loan portfolios between second quarter 2012 and second quarter 2013. As seen in Map 2 (see page 23), loan growth has spread in most states, with a growing percentage of banks within the states increasing their outstanding loan portfolios. The percentage of banks with loan growth was highest in New England, with more than 75 percent of institutions reporting loan growth in the twelve months ending June 30, 2013. In the Northeast, Midwest, and West Coast, more than 50 percent of banks are reporting loan growth. Banks in the Southeast and Michigan (both hard-hit areas during the crisis) are showing signs of a recovery in lending with almost 50 percent of these institutions reporting loan growth. States with the greatest percentage of institutions reporting loan growth were Maine, Massachusetts, Hawaii, and New Hampshire. States with the lowest percentage were Idaho, South Carolina, District of Columbia, Georgia, and North Carolina.
As previously mentioned, Survey results indicate three primary factors influence loan underwriting: changes in economic conditions, changes in the financial condition of institutions, and responses to regulatory observations. During the financial crisis and the ongoing recovery, these factors collectively contributed to a tightening in underwriting standards and reduced loan growth; more recently, however, the influence of these factors appears to be moderating as reflected in an overall increase in outstanding and unfunded loans.
Economic conditions tend to have the greatest impact on commercial as well as consumer-related lending. Loan portfolios, particularly ADC portfolios, declined substantially at many banks from 2008 to 2010.12 The second quarter of 2013 was the first quarter that ADC and unfunded commitments increased since first quarter 2008. This shift from contraction to expansion coincides with continued improvement in the Home Price Index (HPI) and commercial real estate sales as reported by CoreLogic.13
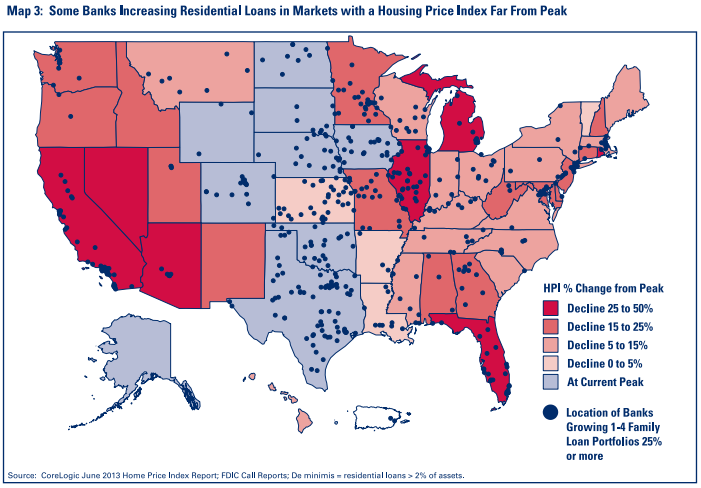
It is noteworthy that even in markets that were hardest hit by the crisis some banks are growing their loan portfolios. For example, in areas where the HPI remains well below peak, banks are increasing their residential loan portfolios. Map 3 (see page 24) shows where banks have grown residential real estate portfolios more than 25 percent during the twelve months ending June 30, 2013, in relation to the state’s HPI peak.
The uptick in loan growth is also being driven in part by improvements in banks’ financial condition. During the crisis, new loan originations often were placed on hold as lenders focused on problem loan workouts, or the bank’s capital position could not support asset growth. However, as the number of problem institutions has declined from a high of 888 to a reported level of 553 as of June 30, 2013,14 loan balances are increasing. As of June 30, 2013, earnings have improved with an aggregate annualized quarterly return on assets of 1.17 percent. Furthermore, aggregate past-due and nonaccrual rates have declined from a high of 7.37 percent in first quarter 2010 to 4.07 percent as of June 30, 2013. Annualized quarterly net loan growth was more than 4 percent as of June 30, 2013.15
The third critical factor influencing lending activity has been response to regulatory observations, such as examination findings, Uniform Financial Institutions Rating System ratings, and enforcement actions. As previously mentioned, the number of problem institutions continues to decline – a sign of overall improvement in the condition of insured depository institutions. Additionally, the number of banks operating under a formal enforcement action has declined from 599 as of June 30, 2011, to 428 as of June 30, 2013. Removal of these actions often removes asset growth limitations, a result of restrictive capital requirements, which enables banks to resume lending. Loan growth was reported by approximately 20 percent of banks operating under a formal enforcement action and by an estimated 63 percent of banks operating without a formal enforcement action.16
Conclusion
Recent Survey results indicate insured institutions are generally reducing credit risk profiles, especially in ADC, C&I, and Other CRE portfolios, as a greater number of institutions are tightening underwriting practices. In addition, a rebound in lending appears to have carried over from 2012 and into 2013. A majority of banks have experienced loan growth during the twelve months ending June 2013, with more than 300 banks reporting growth in concentrated loan portfolios. Led by increased C&I lending, loan growth was generated in many markets across the country, including some institutions reporting growth in areas hardest hit by the financial crisis. The same factors economic conditions, the financial health of institutions, and responses to regulatory observations appear to have influenced changes in underwriting as well as overall lending activity at most institutions captured in the Survey.
Despite growing some traditionally higher-risk portfolios, such as ADC and associated unfunded commitments, bankers have reduced the use of higher-risk practices, such as funding projects on a speculative basis. Survey respondents report that bankers have grown concentrated portfolios without loosening underwriting or changing to a more liberal lending philosophy. However, as stated in the December 2006 Financial Institution Letter titled Guidance on Concentrations in Commercial Real Estate Lending, Sound Risk Management Practices,17 lenders are reminded to establish appropriate policies, procedures, and practices to manage the associated risk from concentrations in credit.
Through use of Survey results combined with other financial and economic data, the FDIC will continue to monitor the financial health of insured institutions as they shake off the recession’s lingering effects and return to a more normalized environment.
Jeffrey A. Forbes
Senior Examination Specialist
jforbes@fdic.gov
Margaret M. Hanrahan
Senior Examination Specialist
mhanrahan@fdic.gov
Larry R. VonArb
Senior Quantitative Risk Analyst
lvonarb@fdic.gov
1 Jeffrey A. Forbes; Margaret M. Hanrahan; Andrea N. Plante; and Paul S. Vigil, “Results from the FDIC’s Credit and Consumer Products/Services Survey: Focus on Lending Trends,” Supervisory Insights, Summer 2012. https://www.fdic.gov/regulations/examinations/supervisory/insights/sisum12/sisummer12-article3.pdf.
2 Jeffrey A. Forbes; David P. Lafleur; Paul S. Vigil; and Kenneth A. Weber, “Insights from the FDIC’s Credit and Consumer Products/Services Survey,” Supervisory Insights, Winter 2010. https://www.fdic.gov/regulations/ examinations/supervisory/insights/siwin10/siwinter10-article2.pdf.
3 This article focuses on surveys completed between January 1, 2012, and June 30, 2013.
4 The Survey asks examiners to assess the risk in nine loan portfolios as “low,” “moderate,” or “high.”
5 FDIC Call Reports.
6 ADC and CRE concentrations of credit are based on the December 12, 2006 Financial Institution Letter FIL 104-2006 – Joint Guidance on Commercial Real Estate Lending: 100 percent of total risk-based capital and 300 percent of total risk-based capital, respectively.
7 Growth for purposes of this article had a de minimis level of 5 percent.
8 For states with total number of banks greater than 10.
9 George Hanc, et al., History of the 80s – Volume 1: An Examination of the Banking Crises of the 1980s and Early 1990s. FDIC, Washington, DC, pp. 3-86. http://www.fdic.gov/bank/historical/history/3_85.pdf.
10 Office of the Inspector General – Report Number MLR 11-010, “Follow-Up Audit of FDIC Supervision Program Enhancements.” https://www.fdicoig.gov/sites/default/files/reports/2022-08/11-010.pdf.
11 FDIC Call Reports.
12 FDIC Call Reports.
13 CoreLogic collects and maintains a comprehensive property and financial services database that includes mortgage-backed securities, property tax data, MLS listings, and traditional and non-traditional credit information. The data are used to predict performance, identify opportunity, gauge trends, and detect risk.
14 FDIC Quarterly Banking Profile, Second Quarter 2013. https://www.fdic.gov/analysis/quarterly-banking-profile/fdic-quarterly/2013-vol7-3/fdic-quarterly-vol7no3.pdf.
15 Ibid.
16 FDIC Call Reports.
17 FDIC Call Reports.