
Amid what many believe is the worst financial crisis since the Great Depression, financial institutions face a challenging credit and earnings cycle. Understandably, many bank managers and boards of directors are focusing efforts on areas of immediate concern, such as liquidity and deteriorating asset quality. However, evidence suggests that more financial institutions currently are taking on higher levels of interest rate risk at a time when short-term rates are near historic lows, which could leave them significantly exposed to changes in interest rates.
Interest rate risk (IRR)—the potential for changes in interest rates to reduce a bank's earnings or economic value—is inherent to banking. However, too much IRR can leave bank capital and earnings vulnerable, particularly for those financial institutions in a weakened financial condition. Interest rate fluctuations affect earnings by changing net interest income and other interest-sensitive income and expense levels. Interest rate changes affect capital by changing the net present value of a bank’s future cash flows, and the cash flows themselves, as rates change.
Recent FDIC Call Report data suggest financial institutions are becoming increasingly liability sensitive and, therefore, more exposed to increases in interest rates. Factors contributing to heightened IRR are earnings pressure to offset losses and higher loan loss provisions; elevated volumes of longer-term, primarily mortgage, assets held in portfolio; and heavy reliance on short-term and wholesale funding sources that are generally more rate sensitive and less stable than traditional deposits. Under these circumstances, a significant increase in interest rates could prove troublesome to financial institutions not actively managing their IRR exposure.
In light of the current environment, it is critical that financial institutions maintain a strong and effective IRR management program that helps mitigate exposure. This article describes the current interest rate environment and its relevance for the banking industry’s IRR profile. The article then reviews IRR measurement systems and cites best practices for measuring, monitoring, and controlling IRR.
Much of the discussion in this article about the management of IRR exposures is drawn from existing interagency guidance, the 1996 Policy Statement on Interest Rate Risk (Policy Statement).1 The article does, however, provide additional observations about best practices for IRR management. The best practices are noted from institutions with strong IRR management frameworks and are drawn from the authors’ experience, as well as observations from FDIC examinations.
The Current Rate Environment and Bank Interest Rate Risk Exposure
In the years before the current crisis, interest rates steadily increased as the Federal Reserve began to tighten monetary policy, which was eased in the wake of the 2001–2002 recession. The onset of the financial crisis in 2007 prompted the Federal Reserve to take a significantly more accommodative policy stance through a reduction in the federal funds rate, among other initiatives. Longer-term interest rates did not decline commensurately, however, so that the yield curve steepened considerably over the last two years (see Chart 1).
Chart 1: The Yield Curve Has Steepened Considerably
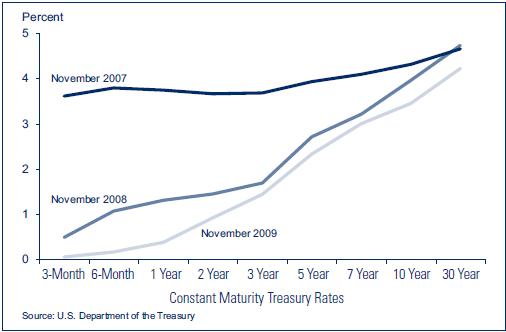
Currently, short-term inflationary expectations are subdued. However, it is widely expected that, as the economy recovers, short-term interest rates will eventually return to more normal levels. For example, one prominent survey of economists forecasts 2010 to end under a higher and flatter yield curve. The forecast projects the federal funds rate to increase gradually while longer-term rates remain at or near current levels.2
A rising rate environment can reflect stronger economic growth, good news for an economy in recession. However, rising short-term rates can compress net interest margins (NIMs) as financial institutions are forced to reprice funding; some assets lose value as a result. Thus, although bank earnings currently are benefiting from a steep yield curve, a change in monetary policy or investor sentiment could have a significant adverse effect on financial institutions not actively managing their IRR exposure.
In fact, recent financial reporting suggests that financial institutions, particularly small to midsize institutions, are becoming more liability sensitive, which elevates their exposure to rising rates. On the liability side of the balance sheet, long-term funds remain scarce due to investor reluctance to lock into such low returns. On the asset side, as a result of the continued dislocation in the secondary and commercial real estate markets, financial institutions are holding longer-term assets, primarily residential mortgage assets.
Maturities of Bank Assets Are Lengthening
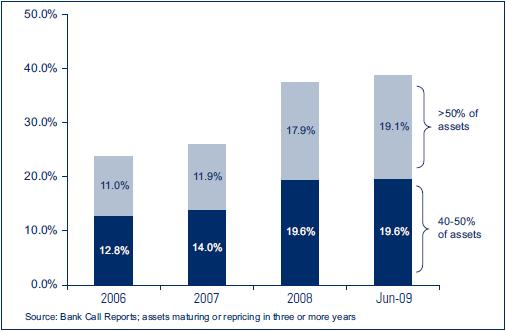
On the asset side of the balance sheet, more financial institutions are holding higher volumes of longer-term assets.3 For almost 20 percent of banks, longer-term assets comprise more than half of assets. This is up from 2006, when longer-term assets made up the majority of assets at only 11 percent of banks (see Chart 2).
Chart 2: A Large Percentage of Banks Have Increased Exposure to Assets with Extended Maturities
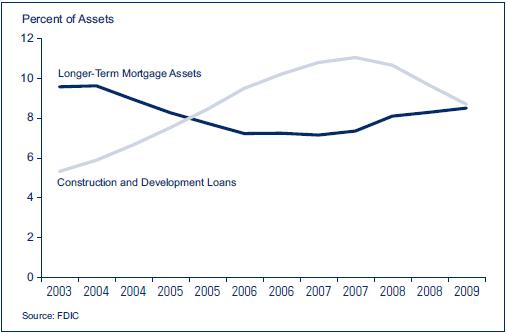
The current lengthening of asset maturities is due in part to market dynamics in the wake of the credit crisis. Before the deterioration of the mortgage markets, a large percentage of small and midsize financial institutions (those with under $10 billion in assets) originated mortgages and sold them to larger financial institutions, which then pooled and securitized the loans. This model, designed to transfer credit risk from financial institutions to the capital markets, resulted in large concentrations of mortgage-related assets at the largest institutions. The largest financial institutions also originated mortgage loans, often offering products with which the community financial institutions could not compete. Instead, small and midsize financial institutions found a niche in commercial real estate lending, specifically construction and development (C&D) loans, which were kept on their books. However, during the past several quarters, small and midsize financial institutions have increased their exposure to long-term mortgage loans and mortgage-related securities and have reduced concentrations in C&D loans. Although this process has been critical to managing credit risk within the industry, replacing C&D loans, which tend to have a shorter duration than mortgage assets, with assets that have similar repricing characteristics has been challenging (see Chart 3).
Chart 3: Institutions with Less than $10 Billion in Assets Are Shrinking C&D Portfolios, but Are Increasing Holdings of Longer-Term Mortgages
The shift in the asset mix increases the interest rate exposure of many institutions, especially those with less than $10 billion in total assets.4 Mortgage-related assets present unique risks because of borrowers’ ability to prepay the mortgages before the contractual term. Because prepayment rates slow when rates rise, the duration of lower-coupon, fixed-rate mortgages will extend, and financial institutions will be locked into these lower-yielding assets for longer periods. Moreover, during the next few years, mortgage exposures at small and midsize financial institutions could increase if federal programs aimed at bolstering the housing market are wound down (see Option Risk text box).5
Use of Less Stable Funding Sources Remains High
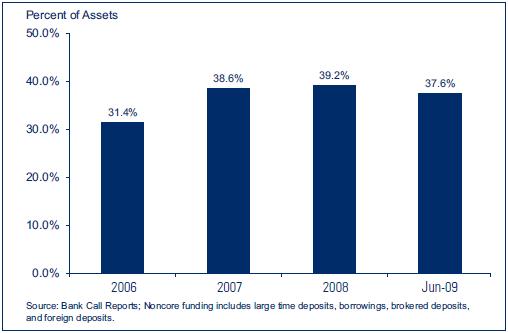
Today, although bank funding sources are more diverse, they continue to be rate sensitive. During the past 15 years, core deposit growth generally has remained flat.6 In response, financial institutions have turned to other funding sources such as noncore deposits and wholesale funding products, which tend to be driven by yield.7 If market conditions change, noncore deposit customers may rapidly transfer funds elsewhere, and wholesale funds may reprice quickly.8 The risk is particularly high for those institutions with a high concentration of longer-term assets, or about 40 percent of the industry (see Chart 4).
Chart 4: Noncore Funding Remains a Significant Funding Source for Institutions Where Longer-Term Assets Are More than 40 Percent of Total Assets
Moreover, some less stable funding sources are fundamentally more complex than core deposits. For example, certain wholesale funding agreements contain embedded options, such as call dates, that would be exercised in a rising rate environment. Embedded options are typically beneficial to the provider of funds. They can be disadvantageous, however, to the recipient of funding who loses a below market cost funding source (see Option Risk text box).
Historically, the primary hedge against IRR for most financial institutions was a stable deposit base over which banks had significant pricing power. Today, however, competition for loans and deposits has diluted pricing power as commercial banks and thrifts compete for customers with credit unions, insurance companies, and other financial firms. Moreover, advances in technology and product delivery channels have limited the relationship and direct contact with many customers. As a result, it is more challenging for institutions to match funding terms with assets or structure the balance sheet mix to offset IRR mismatches effectively. Additionally, banks could see their funding costs rise to maintain and attract deposits.
Another factor that could contribute to higher funding costs in a rising interest rate environment would be the marketplace response to an unwinding of special federal liquidity programs established during the crisis. These government support programs, directed at mitigating the effects of considerable investor risk aversion, effectively reduced the interest spreads financial institutions had to offer to attract funding. As markets normalize, and to the extent emergency federal liquidity programs are phased out, interest spreads offered by financial institutions to attract funds could experience upward pressure.
The confluence of these balance sheet and economic trends has contributed to an increased asset/liability mismatch and set the stage for potential earnings deterioration if interest rates rise. Therefore, it is critical that financial institutions have and maintain on an ongoing basis an effective risk management system.
Principles of Sound Interest Rate Risk Management
To manage IRR exposure effectively, financial institutions must have timely and accurate information about the exposure of their balance sheets to changes in interest rates. The board of directors should set the risk tolerances and set policies that measure, monitor, and control IRR exposures. Senior management is charged with implementing the approved guidelines, using appropriate measurement systems, managing positions to meet established risk limits, and reporting IRR exposure. Management also is charged with providing a system of sound internal controls and appropriate independent reviews to, among other objectives, validate the robustness of their forecasting models.9 The formality and sophistication of an institution’s IRR management should be commensurate with its level of risk exposure and the complexity of its holdings and activities. Management should periodically assess the institution’s business strategies and new products or initiatives and the IRR implications to ensure the risk management process, including the measurement model, remains appropriate.
Financial institutions with the most robust interest rate risk measurement systems quantify IRR by applying various assumptions about future interest rates, economic conditions, and customer behavior to their current balance sheet position.10 The intricacy of the measurement system should vary depending on the size, complexity, and business model of the institution. Three types of measurement tools generally provide the foundation for IRR analysis: gap models, economic valuation of equity (EVE) models, and earnings simulation models.
Different levels of sophistication characterize each model category, and within categories complexity can vary. A model’s sophistication usually depends on the technical and mathematical formulas underlying the measurement system and the characteristics and types of assumptions used. Models differ in how they capture and reflect the four fundamental types of IRR (see text box on Types of Interest Rate Risk). The following is an overview of gap, EVE, and earnings simulation models:
Gap Analysis Models: Gap analysis measures the difference between the amount of interest-sensitive assets and interest-sensitive liabilities that will reprice (on a cumulative basis) during a given time horizon. If a bank has a negative gap, the amount of liabilities repricing in a given period exceeds the amount of assets repricing during the same period, thus decreasing net interest income in a rising rate environment. The gap ratio can be expressed as the percentage risk to net interest income by multiplying the gap ratio by the assumed rate change. The result estimates the change to the NIM. For example, a bank has a negative 15 percent one-year average gap. If rates increase 2 percent, then the NIM will decline 30 basis points (15 percent x .02). This estimate assumes a static balance sheet and an immediate, sustained interest rate shift.
Gap models are relatively simple to prepare and understand. However, they are limited, as they typically cannot measure the effects of embedded options, yield curve twists, and basis risk.11 Gap analysis can help management visualize the time frames in which repricing risk may occur, but it should not be the primary analytical tool for assessing IRR.
Economic Value of Equity Models: EVE models reflect the net present value of the institution’s assets, liabilities, and off-balance sheet cash flows. EVE models provide insights into a bank’s longer-term IRR position. More advanced versions of EVE models, if administered correctly, can capture all types of IRR. Financial institutions should use EVE models capable of capturing the level of risk and optionality they have assumed.
EVE models range from simple to sophisticated, depending on the assumptions used to derive outputs, and have advantages and shortcomings. The most basic EVE models use straightforward rate and cash flow assumptions that are simple to understand and easy to design. Basic EVE models work well for noncomplex financial institutions with simple balance sheets. However, these simple models often provide inaccurate valuations of embedded options, possibly understating risk, and should not be used to assess more complex instruments.
Earnings Simulation Models: Earnings simulation models measure the effects interest rate changes will have on interest income or net income. Simulation models reflect a bank’s income performance over time and can, if properly calibrated, capture the four types of IRR. Earnings simulation models show the estimated potential effects on earnings and often are regarded by financial institutions as having more utility than other models. Many financial institutions rely on earnings simulation as the primary tool to measure, manage, and control IRR exposure. However, managers should be aware that some optimistic assumptions can be embedded in these models that can affect their output. Managers who review these models should outline the rationale for determining key assumptions and any changes to assumptions and report to the Asset/Liability Management Committee (ALCO), or similar management committee.
Model outputs should proactively identify risks that could deplete current capital buffers or indicate the level of future earnings at risk. Further, measurement systems should enable management to recognize risks stemming from new and existing business strategies and have clear and well-understood linkages between changes in interest rates and resulting changes in earnings and capital (see text box on Interest Rate Risk Mitigation Strategies).12 To properly measure IRR, models should be calibrated to reflect that not all assets will reprice simultaneously. For example, variable-rate assets with embedded caps or floors, where the current interest rate is well beyond the repricing limit, will behave more like fixed-rate assets until interest rates again approach the band where they can adjust.
Scenario Analysis and Stress Testing
IRR should be considered under a range of potential scenarios, including ones in which the balance sheet is stressed or shocked significantly. Stressed situations are those that reflect significant movements in interest rates. The output should reflect the subsequent effect of such scenarios on earnings (earnings simulation results) and the underlying economic value of the bank’s assets, liabilities, and off-balance sheet items (EVE results).
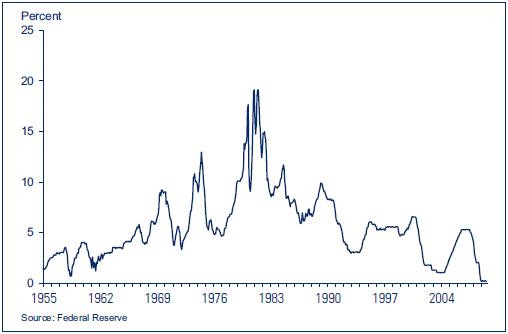
The goal of stress testing is to identify risk, not necessarily to estimate the most likely interest rate scenario. The 1996 Interagency Policy Statement requires that management consider “meaningful stress situations” when modeling IRR, providing for illustrative purposes a ±200 basis point rate change over a one-year period. Many institutions have adopted this scenario as the basis for stress testing. However, in many cases, a ±200 basis point parallel shock will not be sufficient for stress testing exposures. An interest rate shock of at least ±300 basis points would be more representative of a severe movement in interest rates, given the frequency and magnitude of observed historical interest rate movements. For example, 30 percent of one-year periods between 1955 and 2008 have experienced changes in interest rates of more than 200 basis points.13 Further, during that extended period, rates changed by more than 300 basis points almost 16 percent of the time, and more than 400 basis points about 9 percent of the time (see Chart 5).
Chart 5: The Fed Funds Rate Has Spiked in Multiple Periods Over the Past 55 Years
Examiners have observed that financial institutions with the strongest IRR identification and risk management programs have used interest rate shocks of ±400 basis points or more as a benchmark and run multiple interest rate change scenarios. Scenarios also should include immediate interest rate changes, which are necessary to capture all of the bank’s option risk (such as call and prepayment risks), which may be harder to detect in scenarios that assume gradual increases in rates. Additionally, scenarios that consider non-parallel changes in the slope of the yield curve and at different points across the curve are recommended.
The risk profile of an institution will influence the types of stress testing scenarios that will be necessary to measure exposures adequately. As such, smaller institutions and those with less complex risk profiles may be able to run fewer and less complicated scenarios.
Assumption Testing
Robust measurement of IRR requires that management frequently assess the reasonableness of a model’s underlying assumptions. Although this may seem basic, a best practice for strong IRR management is ensuring that the assumptions match the characteristics of the bank’s profile. Management assumptions should reflect the characteristics of bank assets and liabilities and not categorically rely on generic assumptions provided by a vendor. In fact, reliance on vendor-provided assumptions that do not reflect the bank’s profile is a common IRR management weakness cited by FDIC examiners.
It is important that management use model assumptions that adequately reflect the risk profile of the institution’s positions and products. Effective management regularly reviews model assumptions to ensure they are reasonable and accurate. Assumptions should be well documented. Backtesting, or comparing model-predicted output to actual results, is one way to check the reasonableness of assumptions. Preferably, the backtesting period will be a period of stress or large rate changes. If past estimates of IRR exposure deviate significantly from actual performance, different assumptions may be appropriate. In such cases, management should recalibrate its assumptions to ensure the model remains effective.
A model may have many assumptions. At a minimum, two basic assumptions that should be included and continually evaluated for reasonableness are asset prepayments and non-maturity deposit price sensitivity/decay rates. Customer behaviors differ in various markets. As a result, financial institutions with robust IRR measurement systems perform both historical and forward-looking analyses to develop supportable assumptions that are relevant to their market and business plan.
Earnings simulations are dependent on new business assumptions—mix, maturity, and options. Assumptions about product growth can mask IRR exposure that exists in the balance sheet and off-balance sheet positions. For instance, a liability-sensitive bank may show earnings increases during periods of rising interest rates if favorable new business product assumptions are used in the model. Alternatively, earning asset growth funded with wholesale liabilities (leverage strategy) can earn higher yields, despite adverse changes in interest rates. Therefore, well-managed institutions will run and report to their ALCO or similar committee a static or “no growth” scenario. To gain additional insight, some financial institutions choose to supplement the static model with a dynamic model that assumes growth in new business. However, such dynamic models may be more relevant for profit planning than for identifying IRR risk. Additionally, other items should be considered when setting assumptions and running model scenarios, such as yield curve shifts and twists, how asset quality under changing rate scenarios can influence assumptions, customer behavior, and non-interest income fluctuations under changing rates (see Assumptions text box).
One method used to determine the implications of model assumptions is sensitivity testing. A sensitivity test alters a key assumption to show how such a change can affect model output. Effective risk managers use sensitivity testing to pinpoint the critical assumptions, which offers them insights about how assumptions influence measurement results. To be meaningful, a sensitivity test must alter the key assumptions significantly enough to change model output. As a best practice, assumption sensitivity testing should be done at least annually and results should be presented to the ALCO or a similar senior management committee, and the board.
Internal Controls
An effective system of internal controls should include enforcing official lines of authority and appropriate segregation of duties. The system of internal controls should also include periodic independent review and validation of the measurement system. Independent review, which may be included in the internal or external audit function, should be performed on a regular basis to ensure the integrity and accuracy of the IRR management process, including board reporting. One of the most common IRR management weaknesses cited by FDIC examiners is the lack of an adequate independent review.
Although the scope and formality of the independent review and model validation will depend on the size and complexity of the institution, its activities, and balance sheet composition, even smaller financial institutions should ensure that an independent party is reviewing the IRR measurement and reporting. Smaller institutions that do not have internal audit functions or lack the resources to outsource reviews can meet the 1996 Policy Statement guidelines by having a qualified staff member—independent of the IRR process—perform the reviews.
Internal control review should assess data inputs and assumptions for accuracy, completeness, and reasonableness. As illustrated earlier, assumptions can make or break the model output and are critical to generating sound estimates of IRR exposure.
In the absence of a third party, validation testing may also be performed by members of management who are independent of the primary IRR management function. Many institutions use backtesting to help them validate risk measurement calculations and model outputs. In-depth validation of the mathematical code and technical aspects of the model is typically not performed at smaller, noncomplex institutions, which often rely on third-party vendors and software packages to measure IRR. Instead, these institutions should request third-party review reports or audits of the service provider’s model. Third-party vendors typically provide such reports to clients upon request as a matter of course. The FDIC considers it a best practice for institutions to request and, if available, review such reports on an annual basis.
Alternatively, the validation review could include a review of the model by a separate entity, or a run of a separate model from that used at the institution. The latter process can offer insight about a model?s validity and is referred to as “benchmarking.” The models and inputs will not be identical but should be similar. The results of the alternate (benchmark) model are compared to the results of the model used for IRR management to identify any potential inconsistencies. This process may be costly, but it is often used by larger or more complex financial institutions or those with significant IRR exposure.
Financial institutions with large IRR exposures or with concerns about internal controls, model management, or model efficacy may be required to engage in a more formal external review. This would likely involve one or both of the methods described above.
Conclusion
Financial institutions should be vigilant in their oversight and control of IRR exposures. Given the current low interest rate environment, it is important that financial institutions plan for likely increases in interest rates and take steps to mitigate and control the associated risks. Concentrations of longer-maturity assets funded with shorter-maturity liabilities can stress an institution’s earnings, liquidity, and capital in a rising rate environment. Financial institutions should be prepared to manage the risk of declining yield spreads between longer-term investments, loans, and other assets and shorter-term deposits and other liabilities. If capital and earnings provide insufficient protection against adverse changes in interest rates, a bank should take steps to reduce its IRR exposure, increase capital, or both.
Suzanne L. Clair
Senior Capital Markets
Specialist
Division of Supervision and Consumer Protection
sclair@fdic.gov
Alison T. Touhey
Financial Economist
Division of Supervision and Consumer Protection
atouhey@fdic.gov
Lemoine J. Turbeville
Senior Examiner
Division of Supervision and Consumer Protection
lturbeville@fdic.gov
The authors wish to thank Andrea N. Plante, Senior Quantitative Risk Analyst, Division of Supervision and Consumer Protection, for her valuable contributions to this article.
1 The 1996 interagency Policy Statement on Interest Rate Risk remains the primary supervisory tool for assessing an institution's IRR management framework and position. The guidance was released under FDIC Financial Institution Letter (FIL)-52-1996, titled "Joint Agency Policy Statement on Interest Rate Risk," (http://www.fdic.gov/news/news/financial/1996/fil9652a.html). Also, see the FDIC Risk Management Manual of Examination Policies (section 7.1), https://www.fdic.gov/regulations/safety/manual/. International standards are set forth in the Basel Committee on Banking Supervision's 2004 Principles for the Management and Supervision of Interest Rate Risk, http://www.bis.org/publ/bcbs108.pdf?noframes=1.
2 Blue Chip Financial Forecast, Vol. 28, No. 11 (November 1, 2009).
3 Longer-term assets are defined here as those maturing or repricing in three or more years.
4 The decline of adjustable-rate mortgage originations and the process of large financial institutions bringing off-balance sheet (for example, structured investment vehicle) assets on balance sheet also are factors driving the increase in longer-term assets.
5 To free up liquidity among mortgage originators, the Federal Reserve established the Mortgage-Backed Securities (MBS) Purchase Program beginning January 5, 2009 and set a goal of buying up to $1.25 trillion of agency MBS, which also helped lower mortgage rates. The New York Fed has purchased more than $790 billion of agency MBS since the program began, which represents nearly half of all domestic mortgage originations in 2009. As the federal programs are scaled back, MBS prices and yields will normalize, and MBS bank holdings are anticipated to continue to increase.
6 In the wake of the financial crisis and implementation of higher insurance limits and programs such as the Temporary Liquidity Guarantee Program, which guaranteed non-interest bearing transaction deposits, a significant amount of deposits came into the banking system. Going forward, it is anticipated that some portion of deposits will leave the banking system as customers search for higher yields.
7 Generally, the relative stability of funding is difficult to determine with precision from Call Report data, and "noncore" funding cited here is only a rough estimate. The stability of each bank’s funding mix should be assessed on a case-by-case basis using all available data on product characteristics, including management deposit stability studies.
8 Many financial institutions offer certificates of deposit through listing services and deposit accounts through Internet channels. These deposits, if less than $100,000, will not fall within the technical definition of "brokered" or "noncore," and are not identified as volatile funding sources in regulatory reports. Nevertheless, these deposits exhibit many of the same rate sensitive and volatility characteristics as brokered deposits. Therefore, Chart 4 likely understates the actual increase in dependency on volatile funding sources. These points re-emphasize the importance of a closer evaluation of deposit stability characteristics.
9 "Joint Agency Policy Statement on Interest Rate Risk," http://www.fdic.gov/news/news/financial/1996/fil9652a.html.
10 The assumptions used to derive output are key components of a bank's measurement system. Numerous assumptions can be included in IRR measurement systems, including the projected level of interest rates, non-maturity deposit price sensitivity/decay rates, prepayment speeds, and customer behavior.
11 Some variations of gap, known as “dynamic gap” models, do attempt to capture some of these risks.
12 Financial institutions should use caution when combining budgeting and IRR modeling methodologies. Financial planning and budgeting models often contain loan growth and funding assumptions that, when incorporated into interest rate measurement models, can mask underlying risk exposures. Management should run a "no growth" scenario to ensure the current position is measured. Since budgeting and risk management have different objectives, they should be evaluated differently.
13 Several exchange-traded hedging options are available to community banks that in certain circumstances could help reduce a bank's exposure to IRR. For example, the Chicago Mercantile Exchange and affiliated Chicago Board of Trade offer swaps, options, and futures based on LIBOR and U.S. Treasury notes, as well as other interest rates. Over-the-counter (OTC) or bilateral agreements are another option, often available to community banks through correspondent banks and sometimes Federal Home Loan Banks. Although they are currently more widely used and often are simpler for banks to manage, OTC derivatives can present larger counterparty risk (the risk that the party holding the other side of a transaction will not be able to make good on its commitment) than those traded on an exchange.
14 See "Guidance for Managing Third-Party Risk," FDIC FIL 44-2008, https://www.fdic.gov/news/inactive-financial-institution-letters/2008/fil08044.html.
15 Year-over-year change in the effective Fed Funds rate. Federal Reserve H.15 data.
16 The three-year pivot point example is an observed practice at certain institutions running effective non-parallel yield curve twists. If a bank has more pronounced balance sheet exposure a different durations, then the use of a different pivot point could be justified.