
Introduction
The FDIC recently has observed instances of liquidity stress at a small number of insured banks.1 Although these have been isolated instances, they illustrate the importance of liquidity risk management as many banks continue to increase lending and reduce their holdings of liquid assets. It is important for bankers to be aware of funding issues that can arise in stress situations, especially as they develop or review their contingency funding plans (CFPs). This article is intended as a resource for bankers who wish to heighten awareness of such issues and should not be viewed as supervisory guidance or required reading.
The article begins with a broad overview of trends in smaller banks’ (those with less than $10 billion in assets) balance sheets, which suggest that as the current business cycle progresses, liquidity risk is generally increasing for these institutions as a group. This is followed by a more detailed discussion of a number of specific funding issues that can give rise to liquidity stress, especially for institutions experiencing credit quality issues or more watchful counterparties seeking higher collateral and terms to protect their exposure. The article concludes with a discussion of the use of contingency funding plans and cash flow projections by bankers to help determine the size of their liquidity cushions and to otherwise plan for future success.
Trends in Liquidity Risk - Overview
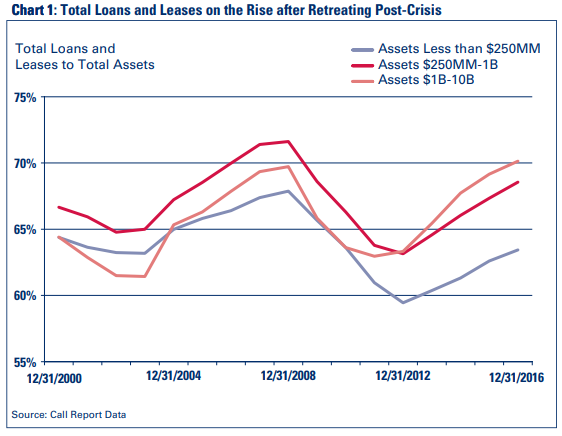
Bank loan growth has picked up considerably in recent years. Chart 1 illustrates that following the steady loan run-off and slowdown in originations since the financial crisis, the ratio of total loans to total assets has rebounded sharply since 2012 for institutions with less than $10 billion in assets.
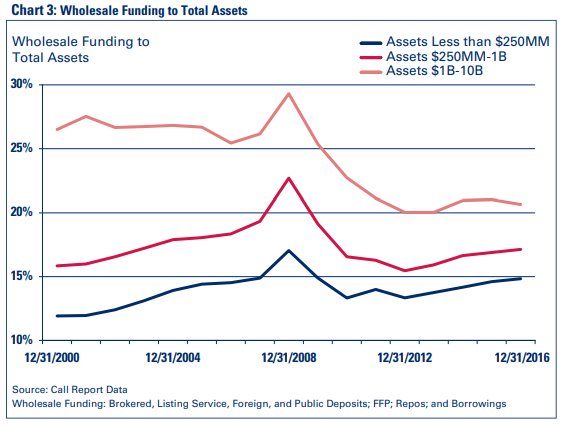
Loan growth has been accompanied by a decrease in liquid asset holdings. Further, a number of community banks have increased reliance on non-core and wholesale sources 2 to fund loan growth. Charts 2 and 3 illustrate trends in liquid assets and wholesale funding since 2001.
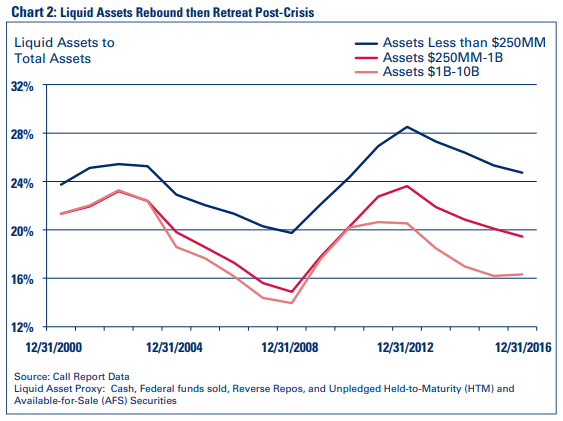
While many well-managed institutions have successfully integrated non-core or wholesale sources and borrowings as a component of their liquidity and funding strategy, some have used these funding sources in concentrated amounts as part of aggressive loan growth or other leverage strategies. Although these sources can be part of a well-managed funding strategy, they may also be problematic when institutions overly rely upon them. For example, during periods of financial stress, many of these funding sources are subject to counterparty requirements and certain legal and regulatory restrictions, especially if capital levels deteriorate. The declining liquid asset cushions and increased use of potentially non-stable liquidity sources depicted respectively in Charts 2 and 3 suggest that small banks as a group are increasing their liquidity risk profiles as the current business cycle progresses.
Unencumbered Liquid Assets - A Pillar of Strength in Crisis
Based on the FDIC’s experience, the first line of defense for responding to a liquidity event is a cushion of unencumbered liquid assets (i.e., assets free from legal, regulatory, or operational impediments). A number of recent cases indicate that an insufficient level of unencumbered liquid assets can compound liquidity troubles. As illustrated in Chart 2, overall trends indicate that some community banks are experiencing a drop in liquid asset levels.
In a stress scenario, accessibility of liquid assets is important. It is typically easier for an institution to sell a readily marketable security or withdraw a Federal Reserve district bank deposit than to request an advance from a funds provider that may be aware of an institution’s financial problems and worrying about the volume of pledged collateral. The most marketable and liquid assets typically consist of U.S. Treasury and agency securities, short- term, investment-quality, money- market instruments, and Federal Reserve or correspondent deposits. These highly liquid, on-balance sheet resources can generally be sold or pledged at little or no discount and serve as a banking institution’s lifeblood in a crisis situation. The liquid asset pool is most useful when the assets are free of encumbrance, meaning no party has collateral or other claim at present or on a standby/contingent basis.
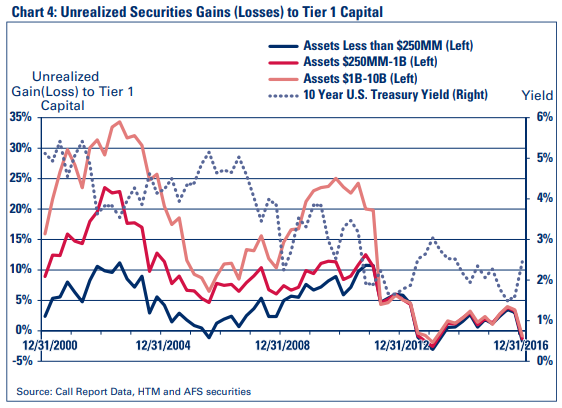
Additionally, when considering availability of the liquid asset pool, it is important to recognize potential market risk in the fixed-income portfolio. As interest rates increase, the price of fixed-income instruments tends to decline. In the current rising rate environment, unrealized depreciation in the liquid asset pool could result in a loss of principal if the securities are sold, further constraining on-balance sheet resources. Chart 4 illustrates the long-term declining trend in unrealized gain and loss positions of held-to-maturity and available-for-sale securities. Even if a bank’s investment portfolio consists of very liquid, unencumbered securities, factors such as the interest rate environment could result in realized losses if securities are liquidated. Unrealized losses in such portfolios would lead to lower collateral amounts available to secure future borrowings.
Liability and Funding Considerations
A “core” customer deposit base serves as the primary funding source for most community financial institutions. These deposits are generally stable, lower-cost, and tend to re-price in a more favorable manner than other instruments when bank-specific conditions or market conditions change. However, when core deposits are unavailable or are not preferred in a funds management strategy, some financial institutions turn to funding from non-core or wholesale sources.
For purposes of this discussion of liquidity risk, the terms non-core and wholesale funding sources refer to funding sources other than insured core deposits. Such funding sources are typically more expensive and less stable than insured core deposits. Further, these funding sources may be difficult or more costly to replace, especially if the institution becomes less than well capitalized and subject to certain legal restrictions detailed later. Non-core and wholesale funding sources may include borrowings, as well as brokered, listing service,3 Internet, and uninsured deposits. These deposit categories are not mutually exclusive, and this article will not address the regulations and legal interpretations addressing when a deposit is or is not brokered.
In some recent instances, institutions that had concentrated positions in less stable funding sources have experienced liquidity stress. Weak contingency funding planning and cash flow forecasting also contributed to liquidity strain, leaving some institutions unable to effectively respond to the funding crisis at hand. Some of these potentially volatile funding sources and their risks are described later to illustrate recent developments. The information is not intended to represent any negative views toward these funding sources. Many banks use these sources successfully as part of a prudent asset-liability management program marked by strong risk management, monitoring, and controls. Thus, the information later is based on recent observations and should be viewed as “lessons learned” from recent experiences. Further, the descriptions contain footnotes to applicable rules and guidelines, and readers should not construe the discussion as supervisory guidance.
Brokered Deposits
A brokered deposit is generally a deposit obtained, directly or indirectly, from or through a deposit broker.4 Brokered deposits can complement core deposits and other sources as part of a comprehensive funding program. However, the FDIC has observed that rapid asset growth funded by brokered deposits has been directly associated with a higher incidence of problem banks and failures.5 The proportion of banks materially utilizing the brokered deposit market as a funding source has been trending slightly higher for the past several years, as indicated by Chart 5.
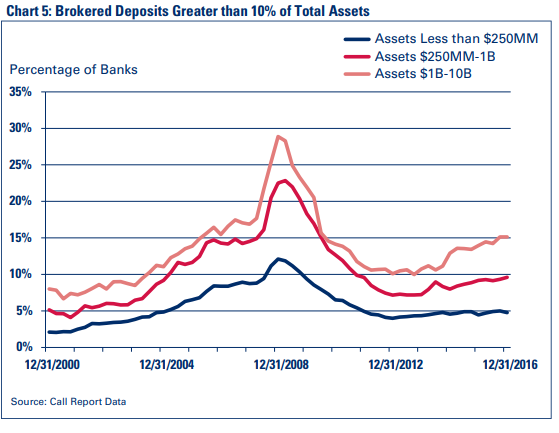
Brokered deposits can be more rate sensitive than other funding sources and have substantial run-off risk after maturity if competitive interest rates are not offered. Further, if the bank falls below well capitalized, brokered deposit restrictions, as well as interest rate restrictions on all the bank’s deposits, can severely limit the bank’s ability to access, retain, or rollover deposits.
The restriction on the use of brokered deposits, and the separate restriction on the interest rates paid on deposits more generally, are triggered when a bank becomes less than well capitalized under the PCA capital regulations. This typically is the result of significant asset quality or earnings deterioration. As such, these two restrictions are often triggered at the same time other funding counterparties reduce credit or demand higher collateral margins. Banks in this situation can find it difficult and costly to replace deposit run-off with other funding while their institution is subject to stress. This can lead to a liquidity squeeze, forcing management to scramble to identify alternative funding.
Listing Service Deposits
Banks obtain deposits from listing services by posting interest rates with a listing service marketplace to attract funds from the national deposit market. This is a relatively easy process as funds can be attracted quickly by offering competitive deposit rates. Listing service deposits and brokered deposits are not mutually exclusive categories: a listing service deposit may or may not be a brokered deposit depending on the features of the program. For purposes of liquidity risk management, however, bank management needs to be aware that funds gathered from listing services can have rate sensitivity characteristics similar to other non-core deposits because they often involve customers who have no other relationship with the institution and solely are seeking to maximize return.
Over the years, many banks have used listing service deposits in a safe-and-sound manner, but some have relied heavily on listing service deposits without proper risk- management monitoring and controls. If a bank’s financial condition and PCA capital category deteriorated, listing service deposits may be difficult to obtain. For example, if competitive rates are above the national rate cap, the bank may not be able to attract its desired amount of funds. Notably, deposit rates reported by some listing services since early 2016 have been above the national rate cap for certificates of deposit of various maturities.
Other Potentially Rate-Sensitive Deposits
The national rate cap (or prevailing rate as applicable) would apply to other potentially interest-rate sensitive deposits when a bank falls below the well-capitalized PCA category. Examples may include Internet deposits, or CDs or other locally gathered deposits that banks attracted primarily by the offer of higher interest rates. Such deposits could be more interest-rate sensitive, resulting in net interest margin pressure during a rising rate environment. In the event an institution becomes less than well capitalized, interest rate restrictions may create significant replacement funding and other challenges. Consequently, risk-management processes applicable to brokered and listing service deposits generally apply to other potentially interest-rate sensitive deposits as well.
Uninsured Deposits
For a variety of business or economic reasons, depositors may place funds in financial institutions in an amount that exceeds federal deposit insurance limits. When an institution is in strong financial condition, uninsured depositors may behave similarly to insured depositors as a result of a bank’s perceived safety. However, if an institution encounters financial stress or negative public attention, uninsured depositors could make significant withdrawals.
Standby Credit Facilities Supporting Uninsured Public Deposits
States, counties, and other municipal authorities place deposits in insured depository institutions to safeguard public funds, access payment systems, and produce a reasonable yield. According to state law in many jurisdictions, these deposits must be fully protected by deposit insurance; a pledge of obligations issued by the U.S. Treasury, U.S. government agencies, or state and local governments; or standby letters of credit (SBLC), issued by a Federal Home Loan Bank (FHLB). Some financial institutions favor the use of FHLB SBLC over the pledge of bank-owned securities as part of a liability-based liquidity strategy. This practice is not without risk. FHLB SBLC encumber assets at the time of commitment through the life of the instrument. As a result, the assets pledged are unavailable for conversion to cash or to use as collateral, and any deterioration in the underlying assets or in the institution’s condition may result in a call from the FHLB to post more collateral to secure the SBLC. This would likely occur when the institution has the greatest need for liquidity; this possibility should be fully considered in a bank’s CFP.
Furthermore, marshaling funds to cover a public deposit withdrawal could be difficult in a stress event as loans pledged against a SBLC may be more difficult to convert to cash than securities. If the public deposits are withdrawn, replacing them with borrowings (secured by the same collateral that was previously securing the SBLC) could also become more onerous if the institution has become troubled.
FDIC supervisory staff does not discourage the use of such FHLB SBLC facilities, and many institutions have used the products effectively, without adverse liquidity implications. Strong risk managers are familiar with the collateral implications and consider it in their stress scenario and contingency scenario planning.
Note: SBLC to secure public deposits should be listed in the Call Report RC – L Contingent Liabilities, under item 9 (2) if the amount is 25% or more of tier 1 capital.
Borrowings - A Supplemental Wholesale Funding Source
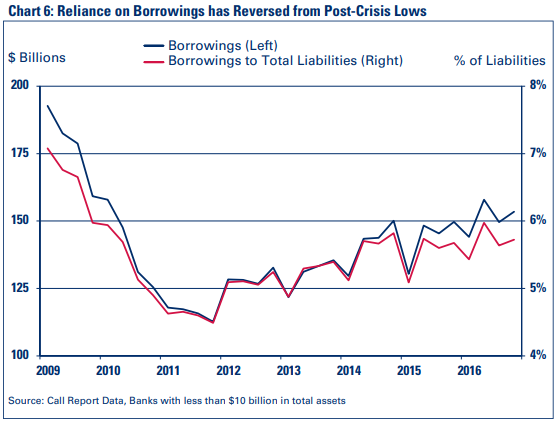
Community banks frequently use borrowings to supplement deposit gathering efforts. Borrowings, which include Federal funds purchases, FHLB advances, repurchase agreements, and other credit facilities, can be an effective funding source when integrated into a comprehensive asset-liability management program. While borrowing sources have helped banks successfully manage growth, examiners have observed that institutions with asset quality or capital problems may encounter issues with borrowings when collateral requirements or reduced borrowing capacity affects liquidity. Generally, borrowings are not a substitute for core deposits; instead, they are a complementary funding resource.
During the post-crisis period, many banks have increased reliance on borrowings to address earnings objectives, loan demand, and a moderation in deposit growth. Chart 6 illustrates how borrowings increased in the years following the financial crisis, as institutions have grown balance sheets with non-deposit funding sources.
In a favorable economic environment, profitable, well-capitalized banks generally have a wide capacity to borrow as they can secure wholesale credit with a pledge of loans or securities. This ample borrowing capacity enables growth and allows management to pursue specific investment strategies. In some cases, banks provide a blanket lien on their mortgage loans and other assets to secure credit. When asset quality and on-balance sheet liquidity are strong, use of secured wholesale credit can be reliable and cost-effective.
However, examiners have observed unexpected, significant liquidity strains when asset quality, capital, and earnings deficiencies limit an institution’s capacity to borrow and pledge collateral. In certain cases, even moderate levels of borrowings have adversely affected banks’ flexibility as additional collateral is requested, and the terms and availability of funding are tightened.
Further, institutions that have pledged a blanket lien on the loan portfolio have encountered administrative and other challenges in seeking the release of collateral for sale or pledging to other counterparties. For example, key lenders, such as the FHLBs and the Federal Reserve Discount Window, have unique collateral acceptance requirements. Some creditors may only accept original inked-signature mortgage documents rather than electronic or facsimile signatures. Accordingly, it is important to understand the terms, structure, and collateral requirements of borrowings in relation to a bank’s overall asset-liability management strategy and potential stress needs.
Overall, management can balance the use of non-core and wholesale funding with prudent capital, earnings, and liquidity considerations through the prism of the institution’s approved risk tolerance. For banks relying heavily on brokered and other potentially volatile funding, it is important that risk tolerances and recovery strategies are sufficiently reflected in the asset-liability management program and CFP. Next, the article will address observations regarding CFPs, emphasizing the findings regarding recent examinations of institutions with heavy reliance on potentially non-stable funding sources and weak liquidity risk management.
The Contingency Funding Plan – Strategies for Unexpected Circumstances
A CFP is a tactical strategy to address unexpected liquidity shortfalls caused by internal or external circumstances. Liquidity strains are often linked to financial weaknesses on multiple fronts (credit quality, capital adequacy, funding), and a comprehensive and up-to-to date CFP helps bank management navigate funding and liquidity stress at a time when their resources and attention are dedicated to addressing a number of issues. Examiners have recently identified CFP weaknesses at several institutions that are relying on less stable funding sources to pursue outsized growth. To address the CFP deficiencies, the supervisory responses at these institutions include recommendations such as enhancing scenario testing, including consideration of deposit restrictions that apply to banks that are not well capitalized for PCA purposes, understanding asset encumbrance and back-up line availability, and aligning the CFP with the risk profile and activities of the institution.
It is important for CFPs to describe the institution’s strategy for addressing a potential deteriorating liquidity position or cash shortfall. The 2010 Interagency Policy Statement on Funding and Liquidity Risk Management9 (Interagency Policy Statement) and the FDIC Risk Management Supervision Manual of Examination Policies 10 suggest that a well-developed CFP can outline policies and risk mitigation actions to navigate a range of stress scenarios by establishing clear lines of responsibility and articulating implementation, escalation, and communication procedures. A comprehensive CFP addresses triggering mechanisms and early warning indicators as well as remediation steps explaining how contingent funding sources would be used. The CFP is an evolving process that is updated as conditions or the bank’s activities change.
In addition, banks typically establish secondary and, in certain instances, tertiary funding resources in the event liquidity reserves become exhausted or unavailable. The Interagency Policy Statement suggests that institutions identify alternative sources of liquidity and ensure ready access to contingent funding as liquidity pressures may spread from one source to another during a significant stress event. Generally, secondary or back-up funds providers include FHLBs, correspondent institutions, and other counterparties that facilitate repurchase agreements or other money market transactions. The Federal Reserve’s Discount Window is also a contingent source of funding. Institutions considering the Discount Window for CFP purposes may want to be aware of the differences between “Primary” and “Secondary” credit, as eligibility and term restrictions may be influenced by a bank’s financial condition and regulatory ratings.11
Community bank CFPs are customized to the institution’s business lines, potential funding vulnerabilities, and the strength of its liquid asset buffer. There is no single method for designing a CFP, and examiners will not criticize a bank’s plan based solely on its brevity. Banks with more complex activities, products and funding structures generally have detailed CFPs, with cash flow forecasting and scenarios that reflect the complexity. For instance, an institution relying on a rate-sensitive funding source can consider how it would manage rate restrictions in a scenario in which the PCA category falls below well capitalized.
Determining the Size of the Liquidity Buffer
A number of recent examinations have noted declines in liquid asset buffers, and overall trends show that community banks’ liquid assets are declining. The size of the liquid asset buffer is an institution-specific determination that reflects the risk profile and scope of activities of the bank. It is important to consider the bank’s minimum operating liquidity level and potential sources of stress given its operations and business plans.
Banks with elevated balance sheet risk and more complex activities tend to experience amplified liquidity stress when they hold minimal liquid assets. Some institutions, including those with more complex funding structures, may struggle to determine the size of the liquid asset cushion.
Certain cash outflows may be very familiar to the bank, such as expected deposit runoff or maturities, borrowings scheduled for refinancing, or large credit commitments, which require funding. However, unanticipated events or stresses can lead to severe liquidity shortfalls. Such strain may be caused by rising credit defaults, operational losses or reputation issues, a disruption in deposit gathering, interest rate or brokered deposit restrictions imposed by statute, or reluctance of counterparties to roll over debt. And of course, time could be needed to sell assets, establish repurchase arrangements or otherwise replace funding sources.
Assessing the peak historical cash flow needs during normal business conditions is a good starting point for a risk manager trying to “size” the liquidity buffer. From there, the cushion could be specified by projecting expected or unexpected needs as measured by liquidity cash- flow forecasts. The liquid asset buffer can provide liquidity (within policy limits and free of encumbrance) during a time of stress, complemented by secondary and tertiary funding sources. The following section offers sample cash flow projection templates, which can help a bank develop templates to maintain an appropriate liquid asset cushion.
Liquidity Cash Flow Forecasting
Safety-and-soundness principles for pro forma cash flow analyses are outlined in the Interagency Policy Statement and are a valuable risk- management process, especially for institutions that rely heavily on non-core funding sources or other market-sensitive sources, such as securitization. The sophistication of “what-if” scenarios should correspond to the bank’s risk profile and activities. Bank management teams who prioritize measuring the adequacy of the liquidity position and evaluating plausible stress scenarios on an ongoing basis can help ensure that the liquid asset cushion and alternative funding sources prudently sustain the institution’s operation.
Community bank managers often devise liquidity cash flow forecasts to estimate expected inflows and outflows under a base-case scenario as well as a stressed environment. Examiners have noted some institutions that employ more complex funding structures or concentrated sources are missing important scenario assumptions and potential stresses in their analyses. The following example of cash flow forecasting is presented to illustrate how an institution could employ cash flow forecasting to reflect stress scenarios, build out the contingency funding plan, and help determine the size of the liquid asset cushion.
An example of pro forma cash flow analysis for a hypothetical $200 million institution is presented in Table 1 and Table 2 with a base-case forecast and a stress scenario, respectively. The example bank is traditional in nature, focusing on local lending funded by core deposits and several non-core sources, including brokered deposits and borrowings. The examples shown are not a supervisory standard or expectation for such analyses, but illustrate how management might approach this exercise from a high level. Institutions can tailor such analyses based on their complexity.
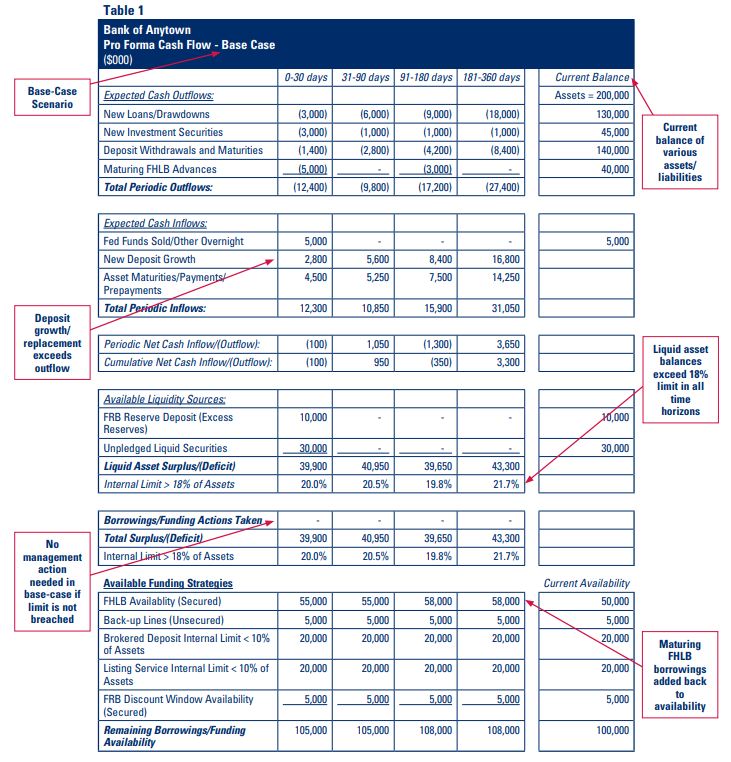
The sample pro forma cash flow is presented across a 12-month time frame with a 30-day short-term liquidity calculation, and cumulative “surplus/deficit” forecasts in the intermediate 90-day and 180-day periods. The rationale for these time horizons is that liquidity crises can be rapid, short-term shocks, or intermediate-term gradual tightening of conditions and funding. For banks with limited liquidity, shorter time frames may be warranted. The pro forma presents expected cash flows at a high level from loan, investment, and funding inflows balanced against outflows from investments and loan renewals as well as deposit withdrawals and repayment of borrowings. On-balance sheet sources of liquidity (unencumbered liquid assets) are included to illustrate the first line of liquidity support. Committed funding lines are not included in the surplus/ deficit measure, but are presented as secondary and tertiary sources when needed to address unanticipated growth, deposit runoff, or other stress.
Liquidity policy limits are presented to measure compliance with the board’s risk tolerance and as benchmarks for cash flow sufficiency. Limits in the accompanying tables are hypothetical examples only, and are not regulatory standards. If breached, CFP intervention would be triggered, requiring a managerial response with appropriate action steps and board involvement. In addition, internal limits on brokered and listing service deposits are presented to gauge the availability of these potentially volatile and restricted funding sources within board risk tolerances. If management determined that additional brokered or listing service deposits should be used to fund growth or replenish run-off, a limit exception and its justification would be presented to and ratified by the board of directors with subsequent analytical follow-up as appropriate.
In the base case, the institution has a reasonable liquidity surplus position that is above its internal policy limit. This is a business-as-usual position with regular cash inflows to support obligations and profitability objectives. The balance sheet is projected to provide a sufficient liquidity cushion above the limit. Still, the table illustrates the availability of alternative funding strategies, if necessary, within limitations imposed by collateral requirements and internal policy.
The bank’s asset-liability committee (ALCO) and board would review the base-case, pro forma cash-flow analysis periodically to be adequately informed of the projected near- and intermediate-term liquidity position. The magnitude and frequency of cash- flow analysis are often matched to the complexity of the financial institution and the level of its risk exposures.
As an accompaniment to the base- case cash-flow analysis, a pro forma stressed forecast can be developed to simulate an unexpected, harsh operating condition. To determine the most likely stress scenarios that the institution could face, management can use its unique insight to envision adverse circumstances based on the nature of the institution’s business, funding structure, and market considerations. Multiple scenarios can be developed, and changes to these analyses over time may be appropriate as conditions and sources of stress evolve. Ideally, the CFP will identify and quantify these events and explain why they are relevant.
The pro forma stress cash-flow analysis presented in Table 2 depicts a more challenging liquidity situation for the example institution. As background, the stress scenario assumed an unexpected increase in delinquent loans, while market interest rates increased at the same time. Loan repayment problems were exacerbated by the higher payments due from variable-rate borrowers, while cash flows from prepayments on fixed rate loans slowed. These issues adversely affected liquidity, as overall asset cash flows declined by 10 percent. Furthermore, higher interest rates caused a migration of non-maturity deposits to higher-rate certificates of deposit, and some depositors withdrew their funds to seek higher yields offered by competitors. Deposit outflows increased significantly from the base-case to the stress scenario.
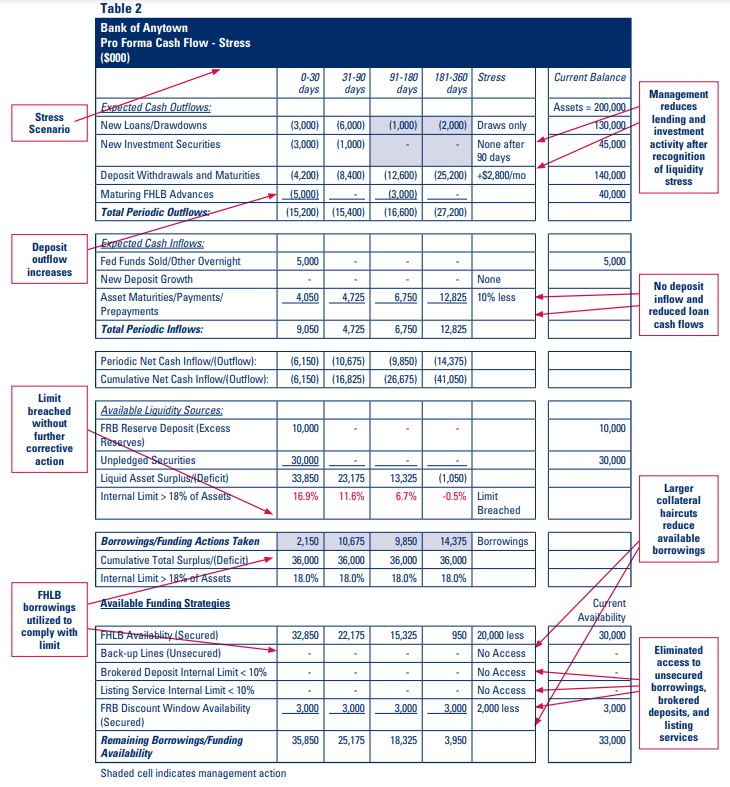
As a result of several quarterly operating losses and a declining leverage ratio, the institution was re-categorized as less than well capitalized for PCA purposes. Accordingly, secured creditors demanded additional collateral margins, and unsecured back-up credit lines were terminated. In addition, access to brokered and high-rate deposits was limited.
The stress scenario shown in Table 2 illustrates the impact of the stress factors and management’s mitigating actions (in shaded cells). The Liquid Asset Surplus/(Deficit) ratio fell below management’s target limit (18 percent of total assets) beginning in the first 30 days. It is assumed that management recognizes a liquidity strain is occurring and, after the loan pipeline completes funding, no new loans are originated or investments purchased after 90 days. Even with this management action, the limit continues to be breached during the entire forecast horizon. Additional management action is shown in the row titled “Borrowings/Funding Actions Taken.” This row shows the amount of additional funding needed during each time period which management used to return the institution to compliance with its 18 percent limit. At the end of the forecast period, the bank is left with $9.1 million in borrowing capacity.
Based on the results of their own base-case and stress cash flow forecasts, management teams can reflect on the efficacy of their liquidity governance and limit framework, unencumbered liquid asset position, reliance on non-core funding, and preparedness to take action in a stress event. Some post-analysis questions for management’s consideration might be:
- Are cash flow surplus limits consistent with the board’s risk tolerance relative to other risks facing the institution?
- Do the pro forma cash-flow analyses illustrate mitigating actions management can take to bring liquidity back in line with limits during stress scenarios?
- Can capital levels absorb losses from the forced liquidation of assets at a discount from current values?
- Are non-core funding limits appropriate given base-case and stress cash-flow projections?
- Is a PCA category downgrade appropriately incorporated into the stress scenario regarding brokered and high-rate deposit restrictions?
- Are off-balance sheet exposures incorporated into the analysis, and do they have a liquidity impact?
- Are back-up borrowing lines sufficient relative to potential cash flow needs during a significant adverse event?
- Is the volume of encumbered assets consistent with management’s goals regarding a balance between reliance on liquid assets and contingent funding availability?
- How liquid are the various securities in the investment portfolio, and can they be relied upon as a primary source of funding during significant cash outflows?
- How reliable are rate-sensitive liabilities and committed contingency funding lines in stress?
Conclusion
Maintaining a healthy liquidity position in good times and bad promotes resilience and strengthens a community bank’s ability to provide critical financial services. Many community bank management teams have worked diligently to strengthen their liquidity risk-management processes since the financial crisis, and these steps can help mitigate the effects of an unexpected stress event or cash shortfall. FDIC examiners have observed balance sheet trends and risk-management practices that raise concerns about rising liquidity risk exposure in a subset of community banks. These institutions have grown their assets using higher levels of potentially non-stable funding sources, which could cause prospective financial strain or liquidity stress.
It is important for management teams that pursue more complex funding and aggressive growth strategies to ensure strong liquidity monitoring and governance efforts, coupled with an appropriate liquid asset cushion and contingency planning. These building blocks are necessary to facilitate safe-and-sound operations in a range of normal and unanticipated business conditions. Additionally, the observations and examples in this article may also help raise awareness about certain limitations and operational considerations that could influence the execution of CFPs in a time of stress.
Suzanne L. Clair
Chief, Examination Support
Division of Risk Management Supervision (RMS)
sclair@fdic.gov
William R. Baxter
Senior Policy Analyst, RMS
wbaxter@fdic.gov
Brian J. Cox
Capital Markets Policy Analyst, RMS
brcox@fdic.gov
Andrew Minor III
Capital Markets Policy Analyst, RMS
aminor@fdic.gov
The authors thank Ryan Billingsley, James Haas, Irina Leonova, Eric Reither, and Patrick Mancoske for their critical contributions to the writing of this article.
1 Throughout this article, the word “bank” is used synonymously and interchangeably with the words “insured depository institution,” unless the context requires or suggests otherwise.
2 Non-core funding may include, but is not limited to, borrowed money such as Federal Home Loan Bank (FHLB) advances, short-term correspondent loans, and other credit facilities, as well as brokered certificates of deposit (CDs) and CDs larger than $250,000. Wholesale funding includes, but is not limited to, brokered deposits, Internet deposits, deposits obtained through listing services, foreign deposits, public funds, Federal funds purchased (FFP), FHLB advances, correspondent credit lines, and other borrowings. High-rate and uninsured deposit accounts are also potentially volatile in certain cases and may have characteristics similar to non-core or wholesale funding. These potentially volatile funding sources are addressed in the FDIC Manual of Examination Policies, Section 6.1 - Liquidity and Funds Management, Pages 8-17. See www.fdic.gov/ regulations/safety/manual/section6-1.pdf.
3 Note that Section 29 of the Federal Deposit Insurance Act does not exclude “listing services” from the definition of “deposit broker.” 12 U.S.C. §1831f. Staff has previously opined that deposits gathered from “passive” listing services may not be considered brokered deposits. See FDIC Advisory Op. 04-04 (July 28, 2004). However, if the listing service places deposits or facilitates the placement of deposits (in addition to compiling and publishing information on interest rates and other features of deposit accounts), the listing service is a deposit broker, and the deposits should be reported as brokered deposits.
4 Section 29 of the FDI Act (Section 29) defines the term “deposit broker” as (A) any person engaged in the business of placing deposits, or facilitating the placement of deposits, of third parties with insured depository institutions or the business of placing deposits with insured depository institutions for the purpose of selling interests in those deposits to third parties; and (B) an agent or trustee who establishes a deposit account to facilitate a business arrangement with an insured depository institution to use the proceeds of the account to fund a prearranged loan. See 12 U.S.C. § 1831f.
5 “On average, institutions that use brokered deposits typically use lower shares of core deposit funds than institutions that do not, and, as a result, they face a higher probability of default. The FDIC’s statistical analyses also show that brokered deposits are an indicator of higher risk appetite. Banks that use brokered deposits have higher growth and higher subsequent nonperforming loan ratios, which are both associated with a higher probability of failure.” See FDIC’s Study on Core Deposits and Brokered Deposits, Page 47, July 8, 2011, www.fdic.gov/regulations/reform/coredeposit-study.pdf.
6 Section 337.6 of the FDIC Rules and Regulations (12 CFR 337.6(b)) “Brokered Deposits” is available at www. fdic.gov/regulations/laws/rules/2000-5900.html. As a resource, in 2015, the FDIC published a set of Frequently Asked Questions (FAQs) on brokered deposits as a plain language summary of previously issued guidance. In June 2016, the FDIC finalized updates to the FAQs in FIL-42-16, Frequently Asked Questions on Identifying, Accepting, and Reporting Brokered Deposits, June 30, 2016, www.fdic.gov/news/news/financial/2016/fil16042.html.
7 An institution subject to interest rate restrictions under Section 29 of the FDI Act and its implementing regulations (12 CFR 337.6) is required to use the “national rate” to determine conformance with the restrictions unless it has been granted a determination that it is operating in a high-rate area. In that event, “local deposit rates must not significantly exceed (no more than 75 basis points) the prevailing rate cap for the institution’s market area.” See FIL-69-09, Process for Determining If An Institution Subject to Interest-Rate Restrictions is Operating in a High-Rate Area, December 4, 2009, www.fdic.gov/news/news/ financial/2009/fil09069.html. The national rate is a simple average of rates paid by all banks and branches for a variety of deposit products in a number of maturity categories. National rate caps are posted by the FDIC weekly at https://www.fdic.gov/regulations/resources/rates/.
8 See FDIC’s Study on Core Deposits and Brokered Deposits, Page 3 July 8, 2011.
9 75 Federal Register 13656 (Mar. 22, 2010).
10 FDIC Manual of Examination Policies, Section 6.1, Liquidity and Funds Management, available at: https://www.fdic.gov/regulations/safety/manual/section6-1.pdf.
11 Hendry, Pam, “The Federal Reserve’s Discount Window: What It Is and How It Works,” Community Banking Connections, Federal Reserve System, Second Issue, 2016. https://www.communitybankingconnections.org/articles/2016/i2/federal-reserve-discount-window.