
Quarterly Banking Profile - First Quarter 2024
Good morning and welcome to our release of first quarter 2024 performance results for FDIC-insured institutions.
The banking industry continued to show resilience in the first quarter. Net income rebounded from the non-recurring expenses that affected earnings last quarter, asset quality metrics remained generally favorable, and the industry’s liquidity was stable. However, the industry’s net interest margin declined as competition continued to pressure rates paid on deposits and asset yields declined.
The banking industry’s net income of $64.2 billion in the first quarter was an increase of 79.5 percent from the prior quarter, mainly due to lower expense related to the FDIC special assessment and lower goodwill writedowns. Otherwise, net income in the first quarter would have increased 14.3 percent from the prior quarter as higher noninterest income and lower provision expenses more than offset a decline in net interest income.
Community banks reported net income of $6.3 billion, a quarterly increase of 6.1 percent, driven by better results on the sale of securities and lower noninterest and provision expenses.
The industry’s net interest margin declined by 10 basis points to 3.17 percent, below the pre-pandemic average of 3.25 percent.1 Continued deposit competition caused funding costs to increase during the quarter while the yield on earning assets declined. The net interest margin for community banks also declined in the first quarter and remains below its pre-pandemic average.
Unrealized losses on available-for-sale and held-to-maturity securities increased by $39 billion to $517 billion in the first quarter. Higher unrealized losses on residential mortgage-backed securities, resulting from higher mortgage rates in the first quarter, drove the overall increase. This is the ninth straight quarter of unusually high unrealized losses since the Federal Reserve began to raise interest rates in first quarter 2022.
The industry’s total loans declined by $35 billion, or 0.3 percent, in the first quarter. Most of the decline was reported by the largest banks, in line with a seasonal decline in credit card loans and lower auto loan balances. The industry’s year-over-year loan growth rate of 1.7 percent, the slowest rate of annual growth since third quarter 2021, has steadily declined over the past year. The annual increase was led by credit card loans and CRE loans. Loan growth at community banks was more robust, increasing 0.9 percent from the prior quarter and 7.1 percent from the prior year, led by CRE and residential mortgage loans.
Asset quality metrics were generally favorable with the exception of material deterioration in CRE and credit card portfolios.2 The industry’s noncurrent rate increased five basis points from the prior quarter to 0.91 percent, a level still well below the pre-pandemic average noncurrent rate of 1.28 percent.3
The increase in noncurrent loan balances continued among non-owner occupied CRE loans, driven by office loans at the largest banks, those with assets greater than $250 billion. The next tier of banks, those with total assets between $10 billion and $250 billion in assets, is also showing some stress in non-owner occupied CRE loans. Weak demand for office space is softening property values, and higher interest rates are affecting the credit quality and refinancing ability of office and other types of CRE loans. As a result, the noncurrent rate for non-owner occupied CRE loans is now at its highest level since fourth quarter 2013.
Driven by write-downs on credit cards, the industry’s quarterly net charge-off rate remained at 0.65 percent for the second straight quarter, 24 basis points higher than the prior year’s rate. The current net charge-off rate is 17 basis points higher than the pre-pandemic average. The credit card net charge-off rate was the highest rate since third quarter 2011.
Domestic deposits increased for a second consecutive quarter, this quarter by $191 billion, driven by growth in transaction accounts. The shift away from noninterest-bearing deposits toward interest-bearing deposits continued, as interest-bearing deposits increased 1.7 percent quarter over quarter and noninterest-bearing deposits declined for the eighth consecutive quarter. Estimated uninsured deposits increased $63 billion in the quarter, representing the first reported increase since fourth quarter 2021.
The number of banks on the Problem Bank List, those with a CAMELS composite rating of “4” or “5,” increased from 52 in fourth quarter 2023 to 63 in first quarter 2024. The number of problem banks represented 1.4 percent of total banks, which was within the normal range for non-crisis periods of one to two percent of all banks. Total assets held by problem banks increased $15.8 billion to $82.1 billion during the quarter.
The Deposit Insurance Fund (DIF) balance was $125.3 billion on March 31, up $3.5 billion from the end of the fourth quarter. Insured deposits increased by 1.1 percent, about half of typical growth in the first quarter. The reserve ratio, or the fund balance relative to insured deposits, increased by two basis points to 1.17 percent. The reserve ratio currently remains on track to reach the 1.35 percent minimum reserve ratio by the statutory deadline of September 30, 2028.
In conclusion, the banking industry continued to show resilience in the first quarter. However, the banking industry still faces significant downside risks from the continued effects of inflation, volatility in market interest rates, and geopolitical uncertainty. These issues could cause credit quality, earnings, and liquidity challenges for the industry. In addition, deterioration in certain loan portfolios, particularly office properties and credit card loans, continues to warrant monitoring. These issues, together with funding and margin pressures, will remain matters of ongoing supervisory attention by the FDIC.
Thank you.
I am happy to take your questions.
Chart 1:
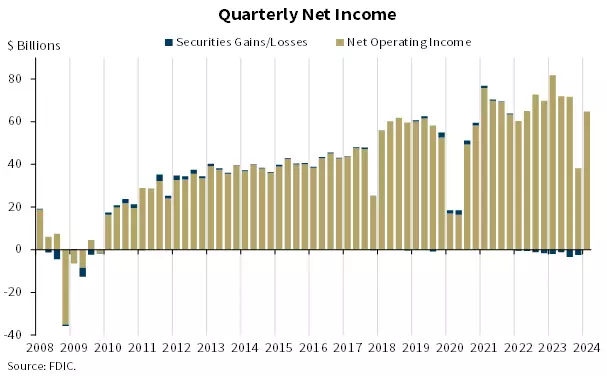
Our first chart shows that the banking industry reported quarterly net income of $64.2 billion, an increase of $28.4 billion, or 79.5 percent, from the prior quarter. A large decline in noninterest expense, primarily due to lower expense related to the FDIC special assessment and lower goodwill writedowns, coupled with higher noninterest income and lower provision expenses, contributed to the increase in quarterly net income.4
Community bank quarterly net income increased 6.1 percent from the prior quarter to $6.3 billion, driven by better results on the sale of securities and lower noninterest and provision expenses.
Chart 2:
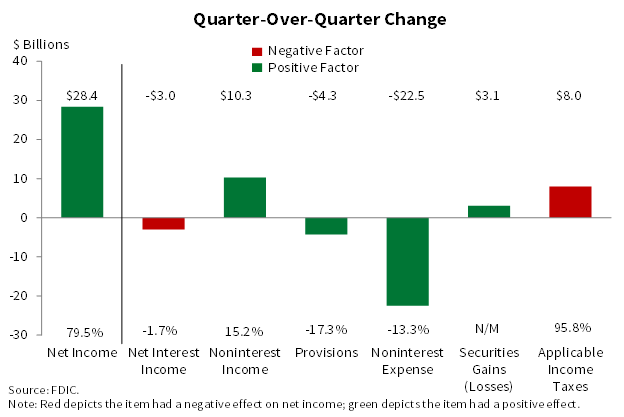
Our next chart shows the breakdown of the changes in industry net income quarter over quarter. The main driver of the industry’s $28.4 billion increase in net income was noninterest expense, which fell by $22.5 billion, or 13.3 percent, quarter over quarter. Noninterest income increased by $10.3 billion during the quarter. An increase in trading revenue and “all other noninterest income” contributed to the quarterly increase in noninterest income.
Much of the change in quarter-over-quarter net income was from an estimated $12 billion reduction in the FDIC special assessment expense and $8.5 billion in goodwill write-downs by two large banks in fourth quarter 2023. Excluding these expenses, net income would have still increased $8.6 billion, or 14.3 percent, from the prior quarter on stronger noninterest income and lower provision expenses.
Chart 3:
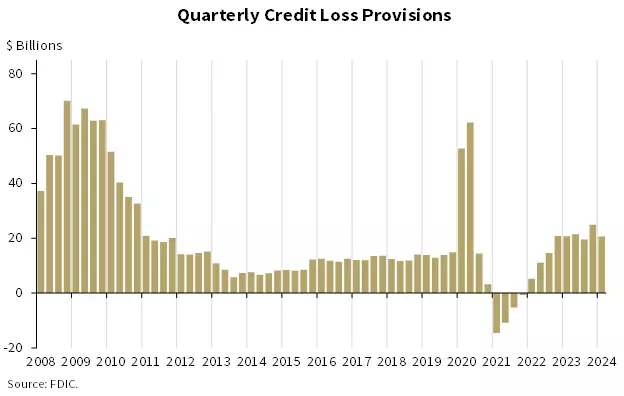
The next chart shows that the industry’s provision expense was $20.6 billion in the first quarter, down $4.3 billion from the fourth quarter. Despite the quarter over-quarter-decline, provision expenses have been higher than the pre-pandemic average for the past seven quarters.
Chart 4:
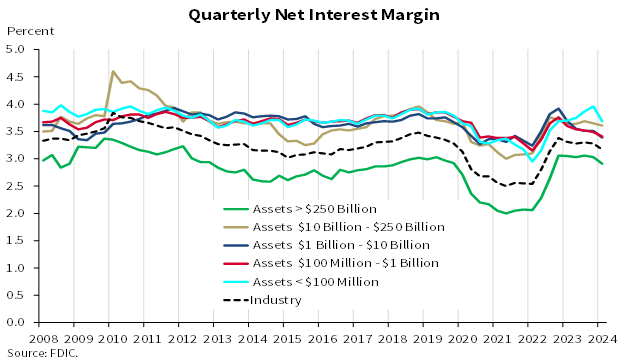
The next chart shows the average net interest margin for the industry and the five asset size groups on which the QBP reports. The industry’s net interest margin fell 10 basis points from last quarter to 3.17 percent, below the pre-pandemic average of 3.25 percent, as funding costs continued to increase while earning asset yields declined in line with seasonal declines in credit card lending. All asset-size groups reported a quarter-over-quarter decline in their net interest margins.
The community bank net interest margin of 3.23 percent also declined during the quarter, down 12 basis points from the prior quarter.
Chart 5:
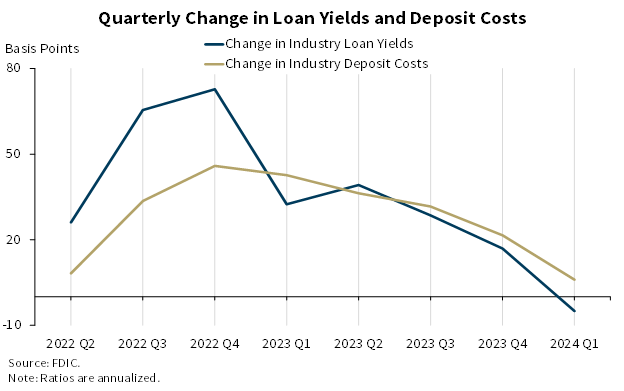
The next chart shows the quarter-over-quarter change in the industry’s average yield on loans and average cost of deposits, which helps to explain the industry’s decline in net interest margin this quarter. During the quarter, deposit costs increased 6 basis points while loan yields declined 5 basis points. Loan yields were affected by a seasonal decline in credit card lending.
Chart 6:
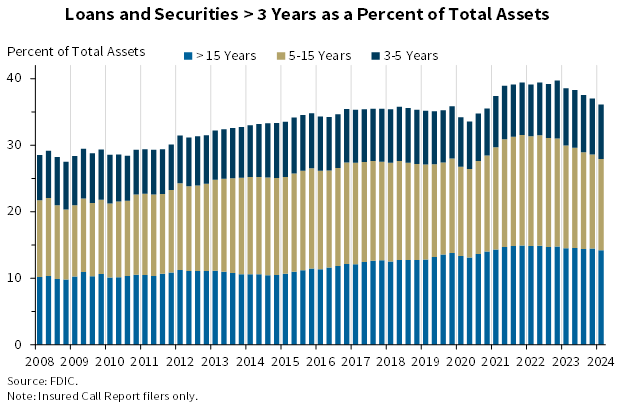
The next chart shows that the banking industry’s share of longer-term loans and securities fell for the fifth consecutive quarter to 36.1 percent after peaking at 39.7 percent in fourth quarter 2022. The industry’s share of longer-term assets is still above the pre-pandemic average of 35.0 percent.
Community banks’ share of longer-term loans and securities was 49.6 percent in first quarter 2024, down from 51.0 percent last quarter and a peak of 54.7 percent in fourth quarter 2022.
Chart 7:
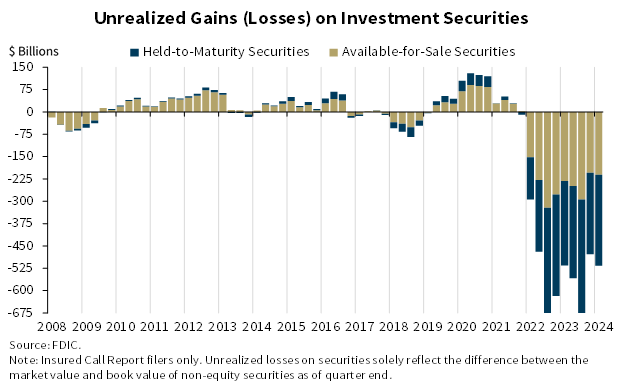
Our next chart shows the level of unrealized losses on held-to-maturity and available-for-sale securities portfolios. Total unrealized losses of $516.5 billion were $38.9 billion higher than the previous quarter. Higher unrealized losses on residential mortgage-backed securities drove the increase, as mortgage rates increased in the first quarter, putting downward pressure on the prices of such investments.
Chart 8:
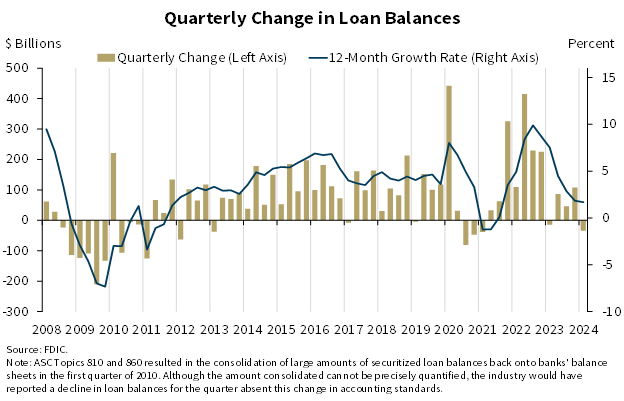
The next chart shows the change in loan balances on a quarterly and annual basis. The industry reported a decline in total loans of $34.8 billion, or 0.3 percent, in the first quarter. Most of the decline was from the largest banks, and the quarterly decline was primarily caused by a seasonal decline in credit card loans as well as a decline in auto loans.
The industry’s annual rate of loan growth continued to decline in the first quarter. Loan balances increased 1.7 percent from the prior year, the slowest rate of annual loan growth since third quarter 2021. The annual increase was led by credit card loans and CRE loans.
Loan growth at community banks has been more robust, increasing 0.9 percent from the prior quarter and 7.1 percent from the prior year. Growth in CRE loans and 1-4 family residential mortgage loan balances drove both the quarterly and annual increases in loan and lease balances.
Chart 9:
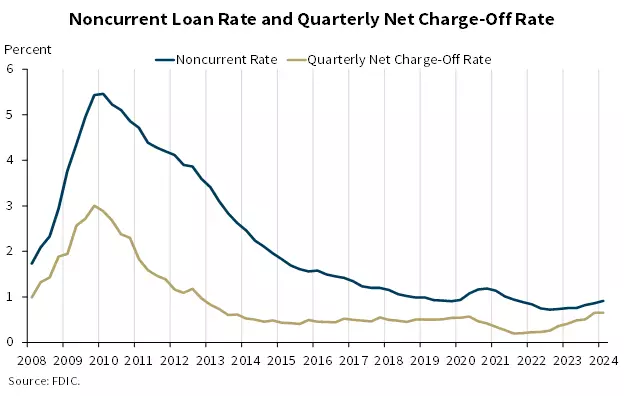
Our next chart shows asset quality metrics for the industry remained generally favorable despite material deterioration in non-owner occupied CRE and credit card portfolios. The noncurrent rate increased five basis points from the prior quarter to 0.91 percent, a level still well below the pre-pandemic average noncurrent rate of 1.28 percent. The quarterly increase was led by C&I loans and non-owner-occupied CRE loans. The noncurrent rate for non-owner occupied CRE loans of 1.59 percent is now at its highest level since fourth quarter 2013, driven by office portfolios at the largest banks.
The quarterly net charge-off rate of 0.65 percent was flat from the fourth quarter but 24 basis points higher than first quarter 2023. This rate is now 17 basis points higher than the pre-pandemic average net charge-off rate. Credit cards drove the annual increase in net charge-off balances. The credit card net charge-off rate was 4.70 percent in the first quarter, 122 basis points higher than its pre-pandemic average and the highest rate since third quarter 2011.
Chart 10:
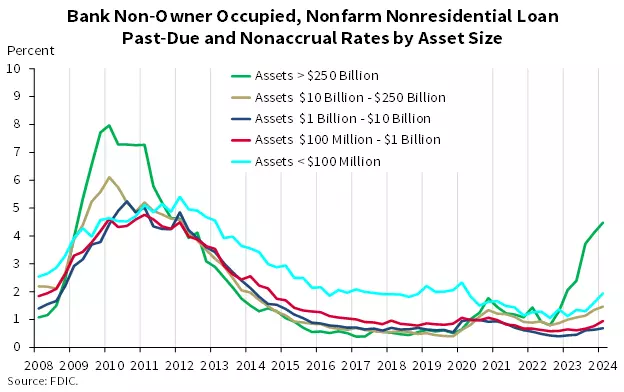
Looking more closely at CRE portfolios, the upward trend in past due and nonaccrual non-owner-occupied property loans continued in the first quarter. The industry’s volume of past due and nonaccrual (PDNA) non-owner occupied CRE loans increased by $1.8 billion, or 9.0 percent, quarter over quarter. As seen in this chart, deterioration is concentrated in the largest banks, which reported a PDNA rate of 4.48 percent, well above their pre-pandemic average rate of 0.59 percent. The next tier of banks, those with between $10 billion and $250 billion in assets, is also showing some stress in non-owner-occupied property loans. This cohort’s PDNA rate was 1.47 percent in the first quarter, up from 1.35 percent in the fourth quarter and above its pre-pandemic rate of 0.66 percent.
Chart 11:
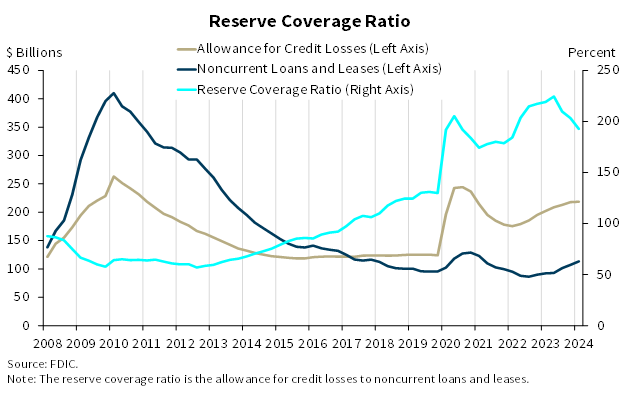
The next chart shows that the noncurrent loan balances grew at a faster pace than the allowance for credit losses, resulting in a decline in the reserve coverage ratio. The ratio of the allowance for credit losses to noncurrent loans fell from 203.3 percent in the fourth quarter to 192.8 percent this quarter. This is still a much higher coverage ratio than the pre-pandemic average.
The reserve coverage ratio at community banks was 209.6 percent.
Chart 12:

Next chart shows that domestic deposits increased for a second consecutive quarter, rising $190.7 billion, or 1.1 percent, during the first quarter. Uninsured deposits increased $63.3 billion, or 0.9 percent, the first reported quarterly increase since fourth quarter 2021.
Banks continue to shift away from noninterest-bearing deposits toward interest-bearing deposits. Noninterest-bearing deposits declined for the eighth consecutive quarter, while interest-bearing deposits increased 1.7 percent. After seven consecutive quarters of increases, brokered deposits declined $10.2 billion (0.8 percent) from the prior quarter.
Nondeposit liabilities rose by $84 billion from the prior quarter, driven by an increase in fed funds purchased and repurchase agreements.
Chart 13:
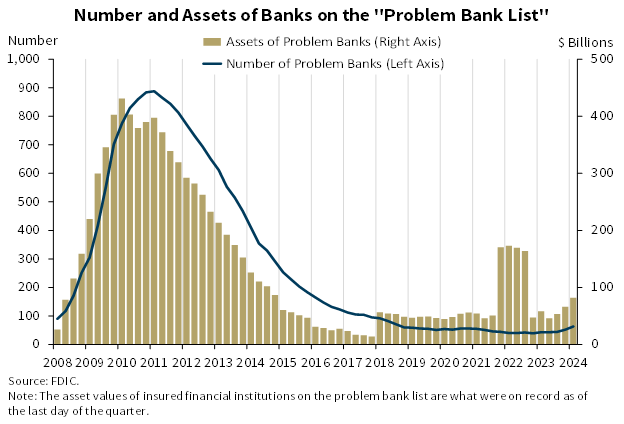
Chart 13 shows the number and total assets of banks on the FDIC’s “Problem Bank List.” Banks on this list have a CAMELS composite rating of “4” or “5” due to financial, operational, or managerial weaknesses, or a combination of such issues. The number of banks on the list increased from 52 in fourth quarter 2023 to 63 in first quarter 2024. Total assets held by problem banks increased $15.8 billion to $82.1 billion. The number of problem banks represent 1.4 percent of total banks, which is within the normal range for non-crisis periods of one to two percent of all banks. No banks failed during the first quarter.
Chart 14:
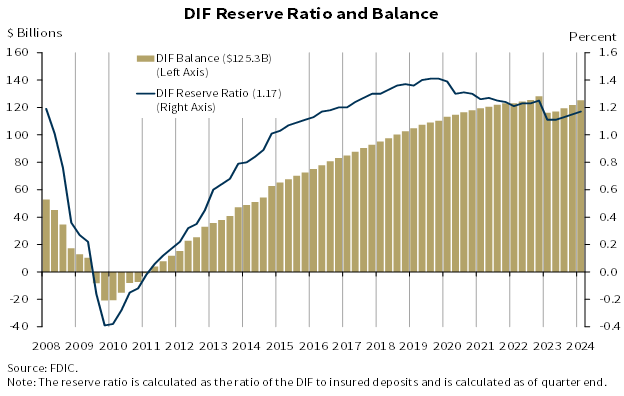
Our final chart shows that the DIF balance was $125.3 billion on March 31, 2024, up $3.5 billion from the fourth quarter. Assessment revenue was the primary driver of the increase in the fund.
The net change in the DIF balance does not include the cost of protecting uninsured depositors pursuant to the systemic risk determination made for the two bank failures that occurred in March 2023, as the FDIC is required by statute to recover those losses through a special assessment. As of March 31, 2024, the total loss estimate for Silicon Valley Bank and Signature Bank was $22.5 billion, of which $19.2 billion is attributable to the protection of uninsured depositors pursuant to the systemic risk determination and will be recovered through the special assessment. As with all receiverships, loss estimates will be periodically adjusted as the FDIC as receiver of failed banks sells assets, satisfies liabilities, and incurs receivership expenses.
Insured deposits increased by 1.1 percent during the first quarter, and year-over-year insured deposit growth was 2.5 percent. The reserve ratio increased by two basis points in the first quarter to 1.17 percent and was 6 basis points higher than a year ago.
The FDIC adopted a DIF Restoration Plan on September 15, 2020, to return the reserve ratio to the statutory minimum of 1.35 percent by September 30, 2028, as required by law. Based on FDIC projections, the reserve ratio remains on track to reach 1.35 percent by the statutory deadline. The FDIC will continue to monitor factors affecting the reserve ratio, including but not limited to, insured deposit growth and potential losses due to bank failures and related reserves.
In conclusion, the banking industry continued to show resilience in the first quarter, as net income rebounded, asset quality metrics remained generally favorable, and the industry’s liquidity was stable.
However, ongoing economic and geopolitical uncertainty, continuing inflationary pressures, volatility in market interest rates, and emerging risks in some bank loan portfolios pose significant downside risks to the banking industry. These issues, together with funding and margin pressures, will be matters of close supervisory attention by the FDIC in 2024.
| 1 | The “pre-pandemic average” is calculated as the average from first quarter 2015 through fourth quarter 2019. |
| 2 | In this statement, the term “commercial real estate loans,” or CRE loans, is used to describe nonfarm, nonresidential loans. |
| 3 | Noncurrent loans are those that are 90 or more days past due or are on nonaccrual status. |
| 4 | In November 2023, the FDIC finalized a special assessment to recover the loss to the Deposit Insurance Fund (DIF) attributable to the protection of uninsured depositors pursuant to the systemic risk determination announced on March 12, 2023, following the closures of two large banks. |