
FDIC Quarterly Banking Profile Fourth Quarter 2025
Today, the FDIC is releasing the full-year and fourth quarter 2025 performance results for FDIC-insured institutions.
The banking industry finished the year with strong earnings, resulting in a return on assets (ROA) ratio of 1.20 percent for the full year. Loan growth accelerated in 2025, as did domestic deposit growth. Asset quality metrics remained favorable overall despite continued weakness in certain portfolios, which the FDIC continues to monitor closely. Unrealized losses declined but remained elevated.
The banking industry continued to have strong capital and liquidity levels, which support lending and protect against potential losses.
Chart 1
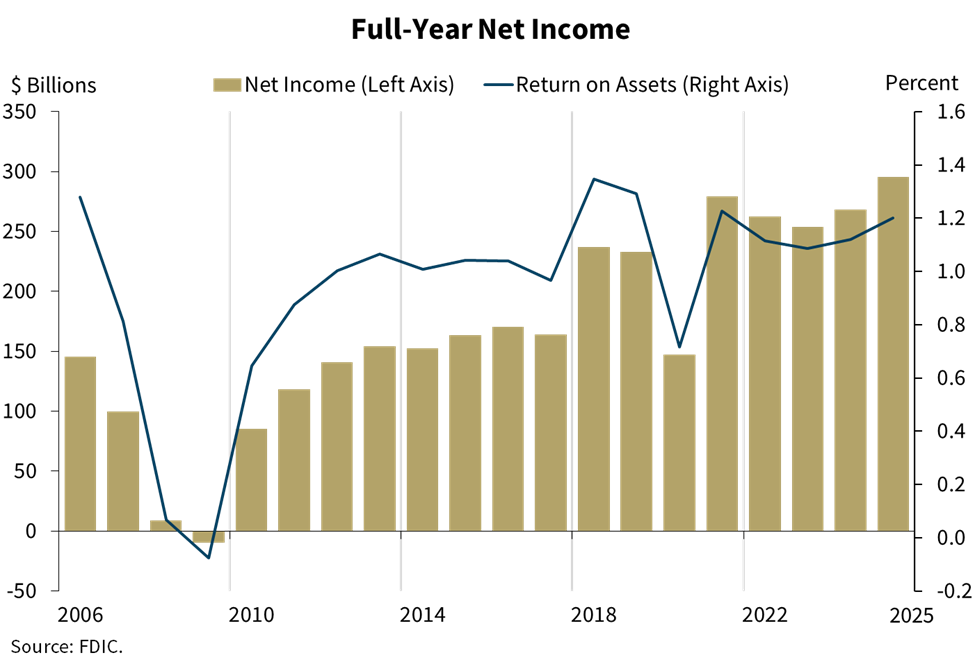
As shown in this chart, full-year 2025 banking industry net income increased from 2024. The industry’s ROA increased 8 basis points to 1.20 percent as net income of $295.6 billion was up 10.2 percent from 2024. The increase was driven by higher net interest income and higher noninterest income, which offset higher noninterest expense.
Community banks reported a full-year pre-tax ROA of 1.32 percent in 2025, up 18 basis points from 2024. Community banks reported full-year net income of $29.9 billion, up 22.5 percent from 2024. The increase in community bank net income was primarily attributable to higher net interest income.
Chart 2
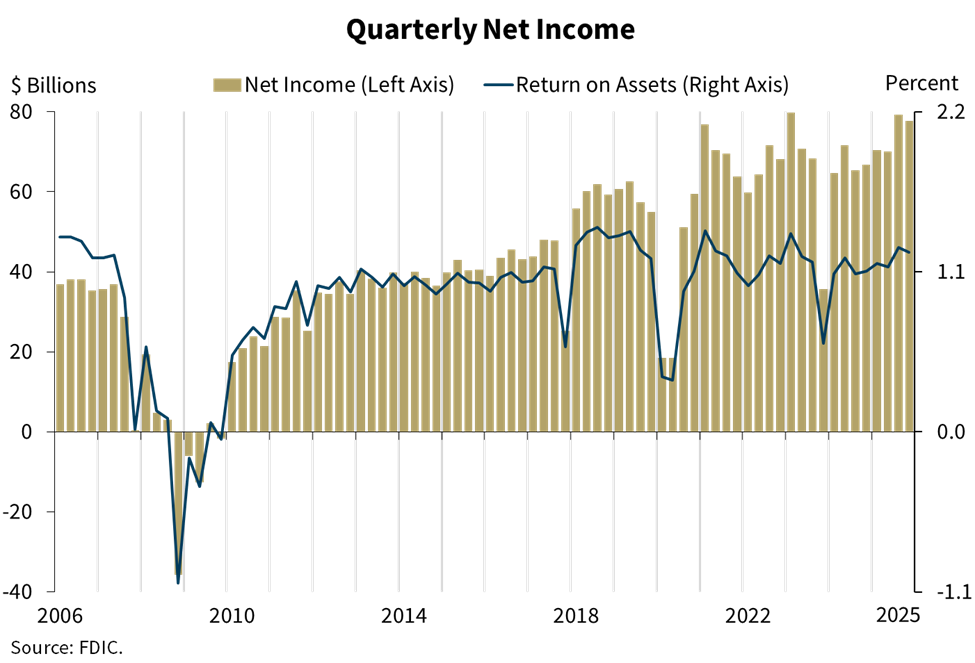
Chart 2 shows that the banking industry reported quarterly net income of $77.7 billion in the fourth quarter, a decrease of $1.6 billion, or 2.0 percent, from the prior quarter. Larger noninterest expense and non-recurring items at several larger banks were the primary contributors to the decline. The banking industry reported an ROA of 1.24 percent in fourth quarter 2025, down 3 basis points from the prior quarter but up 13 basis points from the year-ago quarter.
Community bank quarterly net income decreased 3.8 percent from the prior quarter to $7.9 billion, driven by higher noninterest expense and higher securities losses. The quarterly pretax ROA at community banks decreased 11 basis points from the prior quarter but increased 28 basis points from the year-ago quarter to 1.35 percent.
Chart 3
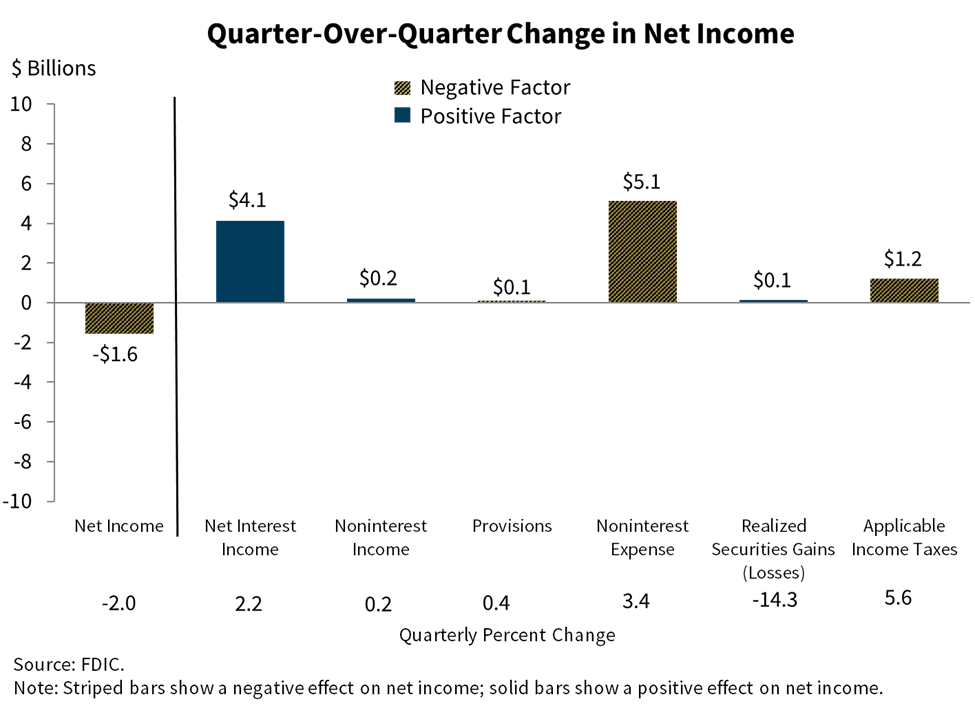
Chart 3 shows the breakdown of the changes in the industry’s net income quarter-over-quarter. The primary driver of the industry’s $1.6 billion decrease in net income was higher noninterest expense, which increased $5.1 billion, or 3.4 percent. The increase in noninterest expense was broad-based and offset strong net interest income growth during the quarter. One-time items at large banks also negatively affected net income.
Chart 4
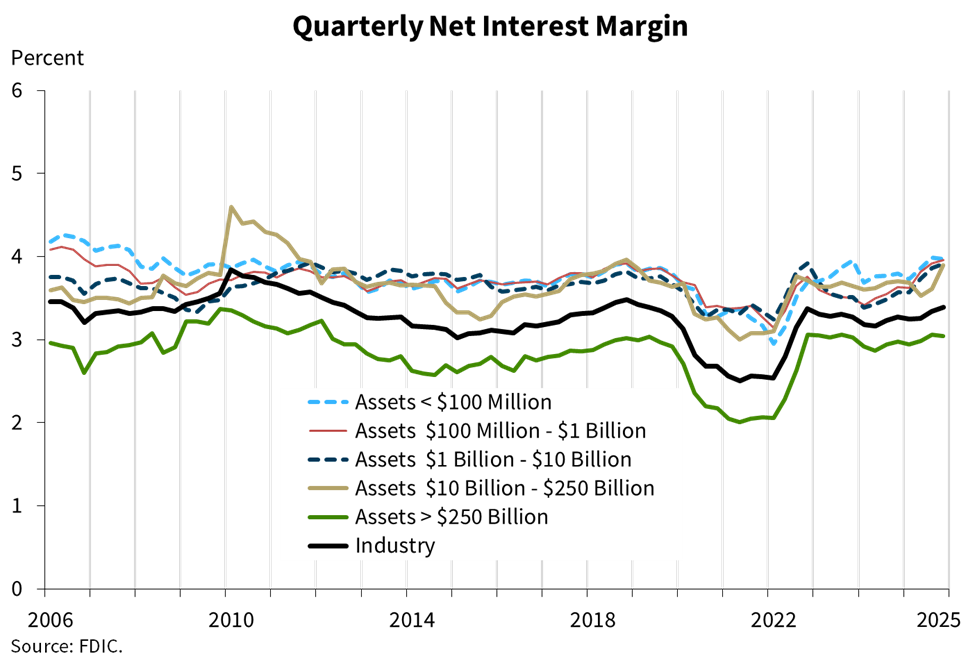
Chart 4 shows the average net interest margin (NIM) for the industry and the five asset-size groups on which the Quarterly Banking Profile reports. The industry’s NIM increased 5 basis points from the prior quarter to 3.39 percent, the highest level since 2019. NIM increased across most asset-size cohorts.
The community bank NIM increased to 3.77 percent, up 4 basis points from the prior quarter to the highest level since 2018.
Chart 5
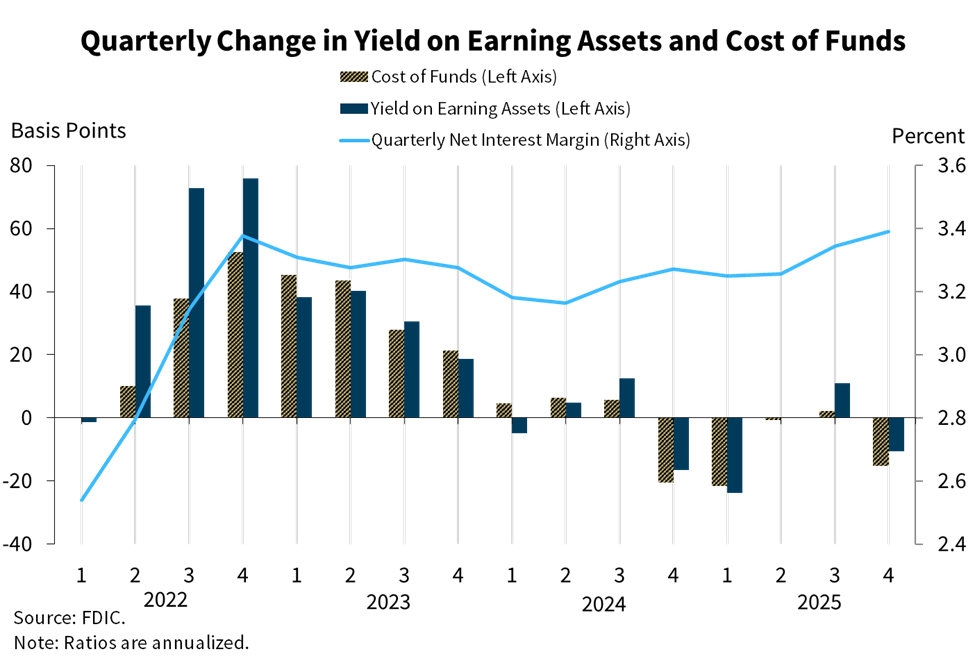
Chart 5 shows the quarter-over-quarter changes in the industry’s average yield on earning assets and average cost of funds. During the quarter, the cost of funds decreased more than the yield on earning assets. This resulted in a 5 basis point increase in the industry’s NIM in fourth quarter 2025.
The 4 basis point increase in community bank NIM in the fourth quarter was driven by a 9 basis point decrease in the cost of funds that outpaced a 5 basis point decrease in the yield on earning assets.
Chart 6
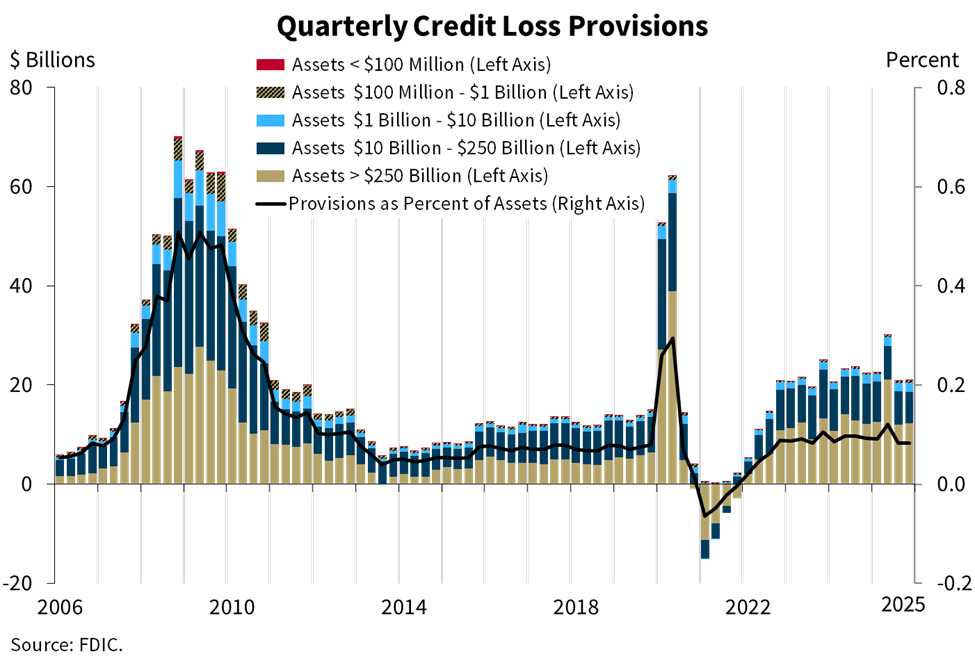
Chart 6 shows that the industry’s provision expense was $20.9 billion in the fourth quarter, roughly in line with the prior quarter. Provision expenses equaled total net charge-offs during the quarter.
Chart 7
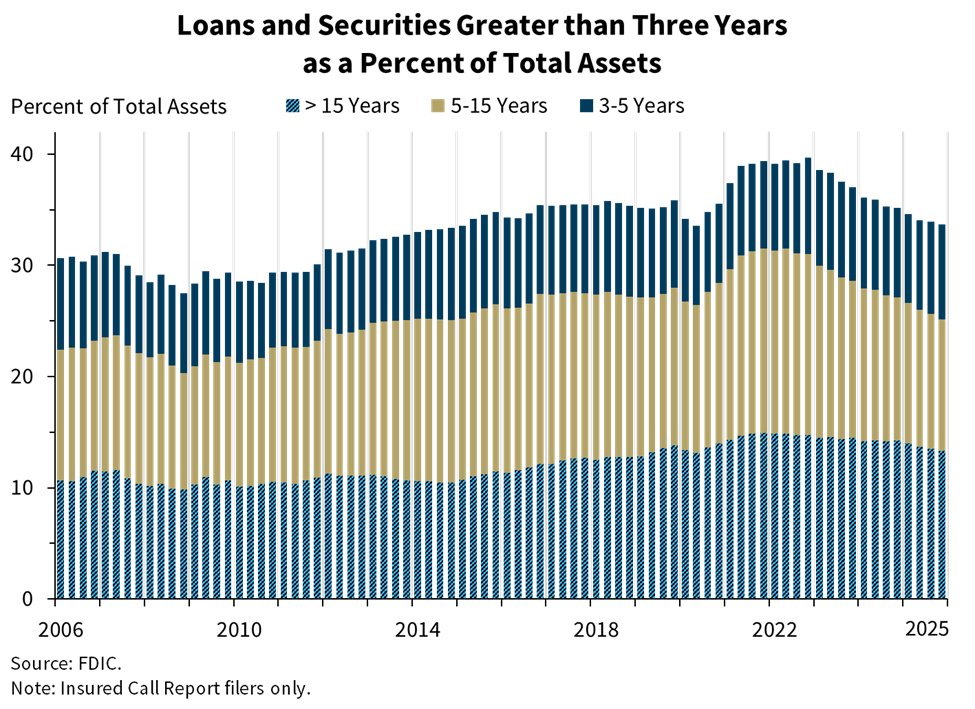
Chart 7 shows that longer-term loans and securities as a share of the banking industry’s total assets fell for the 12th consecutive quarter to 33.7 percent after peaking at 39.7 percent in fourth quarter 2022. The industry’s longer-term assets as a share of total assets were the lowest since 2020.
At community banks, longer-term loans and securities made up 42.9 percent of total assets in fourth quarter 2025, down from 43.0 percent in the prior quarter.
Chart 8
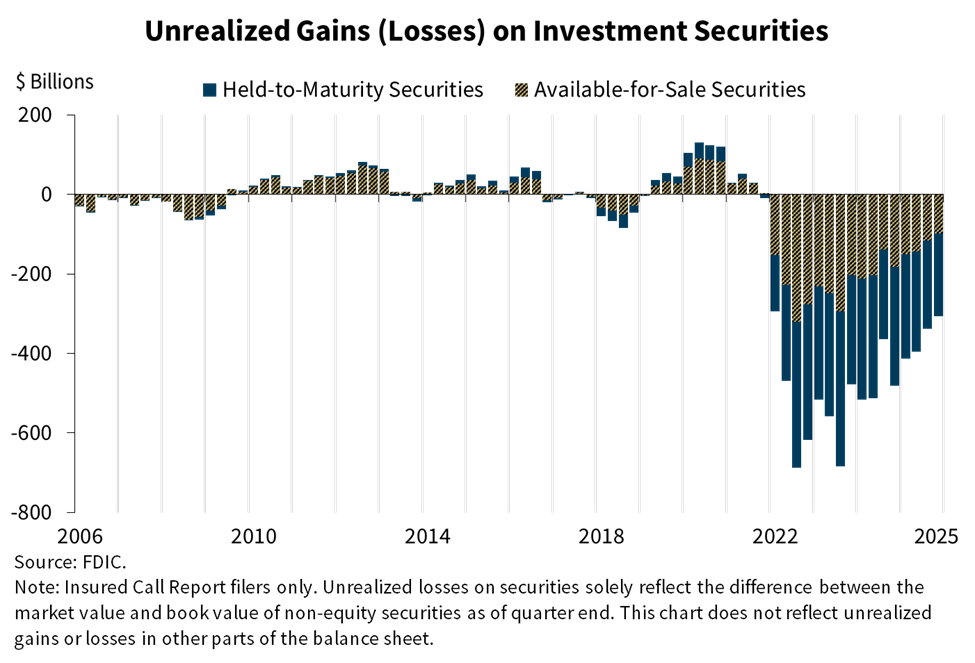
Chart 8 shows the level of unrealized losses on held-to-maturity and available-for-sale securities portfolios. Total unrealized losses decreased $31.0 billion (9.2 percent) from the prior quarter to $306.1 billion, the lowest level of unrealized losses for the industry since first quarter 2022. The 30-year mortgage rate declined during the quarter, increasing the value of mortgage-backed securities reported by banks and reducing unrealized losses.
Chart 9
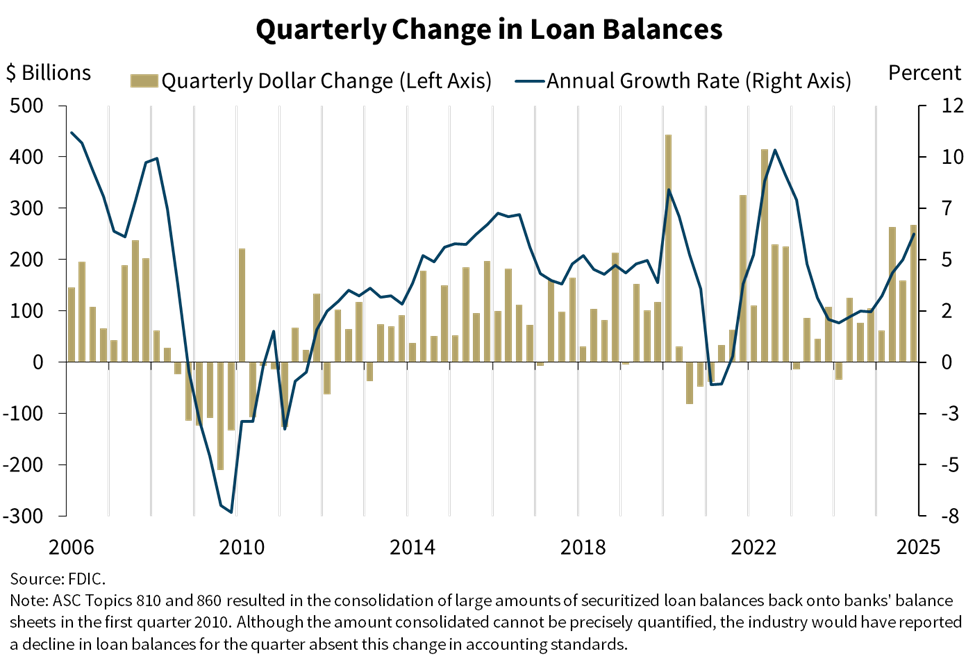
Chart 9 shows the change in loan balances on a quarterly and annual basis. The industry’s total loans increased $267.8 billion, or 2.0 percent, in the fourth quarter. Loans to nondepository financial institutions and credit card loans had the largest dollar increase among reported categories. Loans to purchase or carry securities, including margin loans, nonfarm nonresidential commercial real estate (CRE) loans, and commercial and industrial (C&I) loans also contributed to the industry’s quarterly loan growth. The industry’s annual rate of loan growth in the fourth quarter accelerated to 5.9 percent, the fastest annual growth rate in 11 quarters.
Total loans at community banks increased 1.4 percent from the prior quarter and 5.4 percent from the prior year, led by increases in nonfarm nonresidential CRE and C&I portfolios.
Chart 10
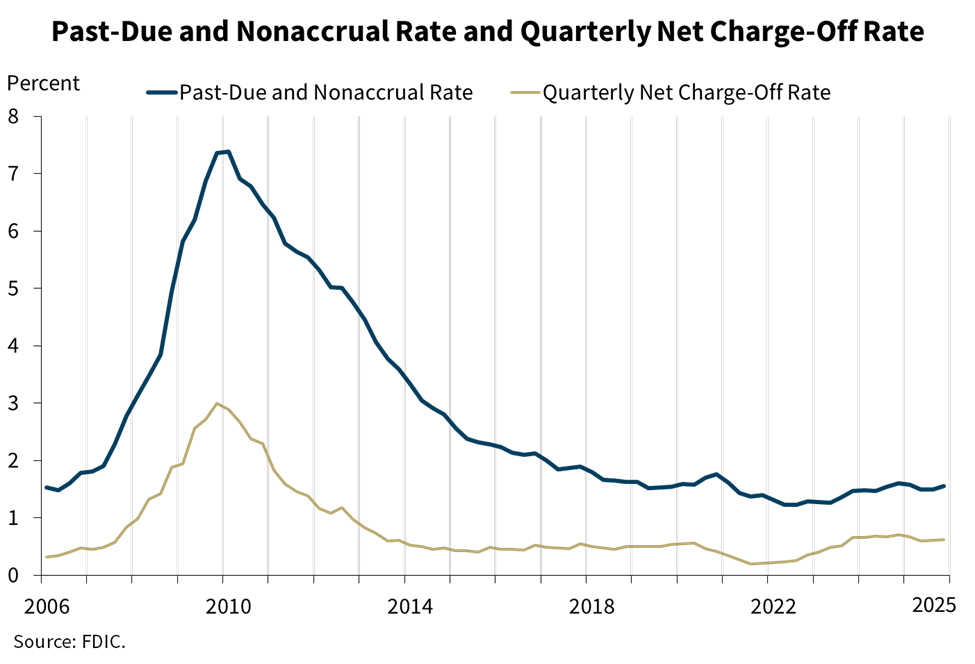
Chart 10 shows that asset quality metrics for the industry remained generally favorable, though weakness in certain portfolios persisted. The overall past-due and nonaccrual (PDNA) rate increased from the prior quarter to 1.56 percent, below the pre-pandemic average rate of 1.94 percent.1 2 The PDNA rates for non-owner-occupied CRE, multifamily CRE, auto, and credit card portfolios remained well above their pre-pandemic averages.
The industry’s quarterly net charge-off rate of 0.63 percent increased 1 basis point from last quarter but was 8 basis points lower than the year-ago quarter. The industry’s net charge-off rate was 15 basis points higher than the pre-pandemic average of 0.48 percent. Increases in credit cards and auto net charge-offs outweighed declines in other categories. Net charge-off rates for most portfolios were above their pre-pandemic averages.
Chart 11
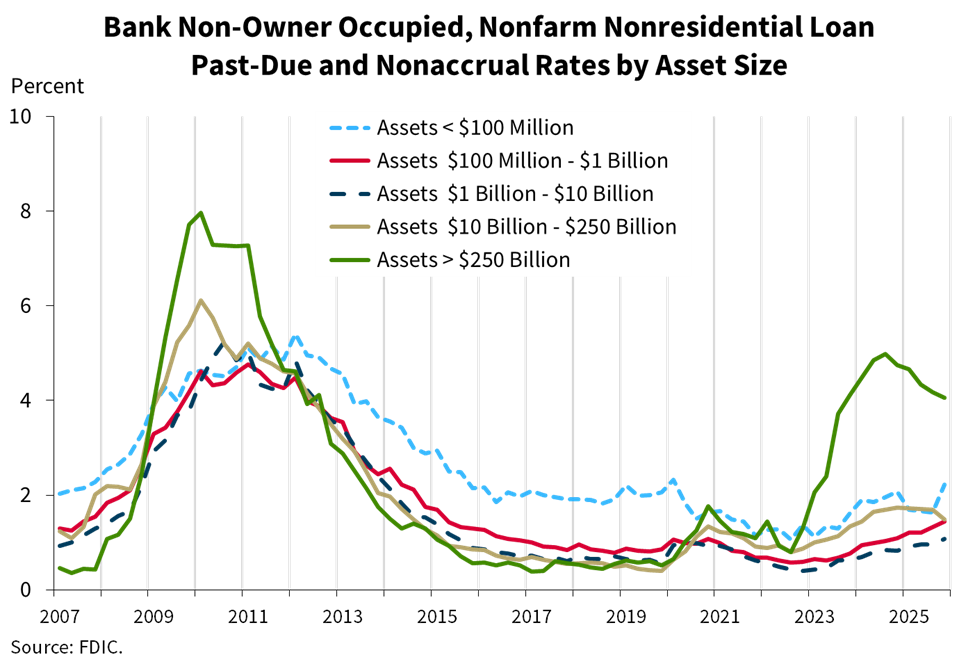
Looking deeper into the CRE portfolio, the elevated PDNA rates of non-owner-occupied property loans persisted in the fourth quarter, driven by the portfolios of larger institutions. The non-owner-occupied CRE PDNA rate for banks with assets greater than $250 billion declined for the fifth consecutive quarter to 4.06 percent, below the recent peak of 4.99 percent in third quarter 2024 but well above the pre-pandemic average rate of 0.58 percent. However, these large banks have lower concentrations of such loans in relation to total assets and capital than smaller banks, mitigating the overall risk. Overall, the industry’s volume of PDNA non-owner-occupied CRE loans increased $269 million, or 1.2 percent, from the prior quarter.
Chart 12
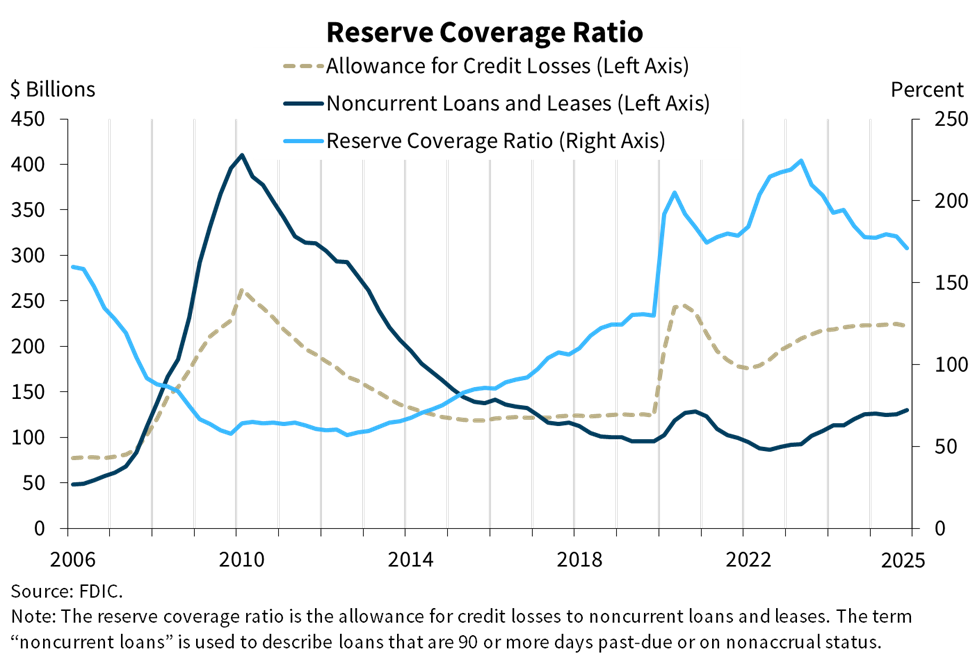
Chart 12 shows that the funded allowance for credit losses decreased slightly while noncurrent loan balances increased, resulting in a decrease in the reserve coverage ratio to 171.2 percent. The pending sale of a large loan portfolio between institutions accounted for the decrease in funded allowance in the fourth quarter, which will reverse once the transaction is complete. The reserve coverage ratio was still higher than the pre-pandemic average.
The reserve coverage ratio at community banks was 154.3 percent.
Chart 13
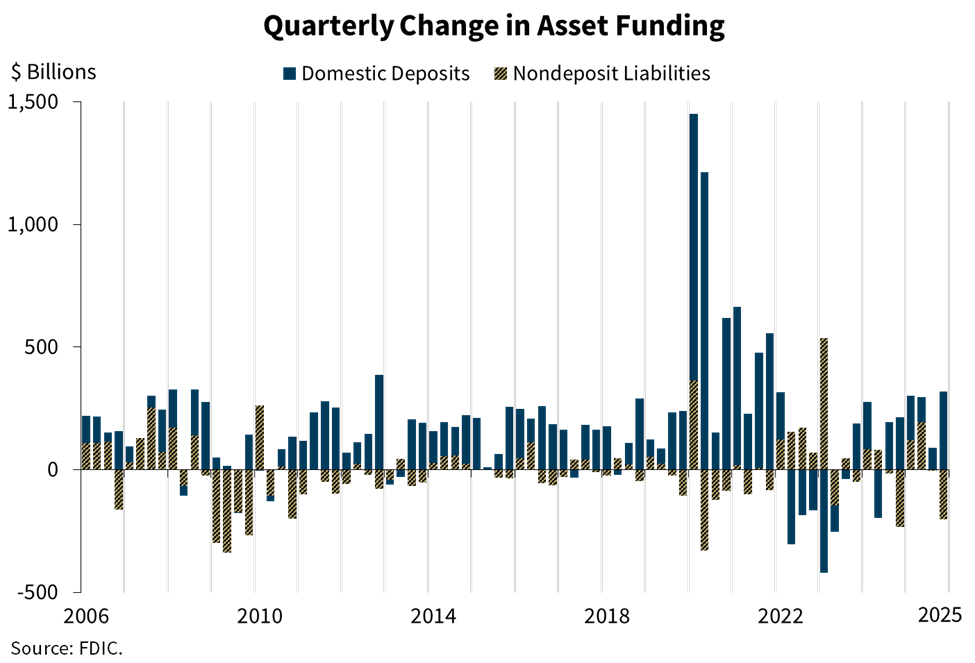
Chart 13 shows that domestic deposits increased for the sixth consecutive quarter, rising $318.3 billion, or 1.8 percent, during the fourth quarter. Estimated uninsured domestic deposits, up $214.7 billion, drove the increase from the prior quarter. The industry’s nondeposit liabilities decreased $201.6 billion during the quarter, driven by a decline in fed funds purchased and repurchase agreements.
Chart 14
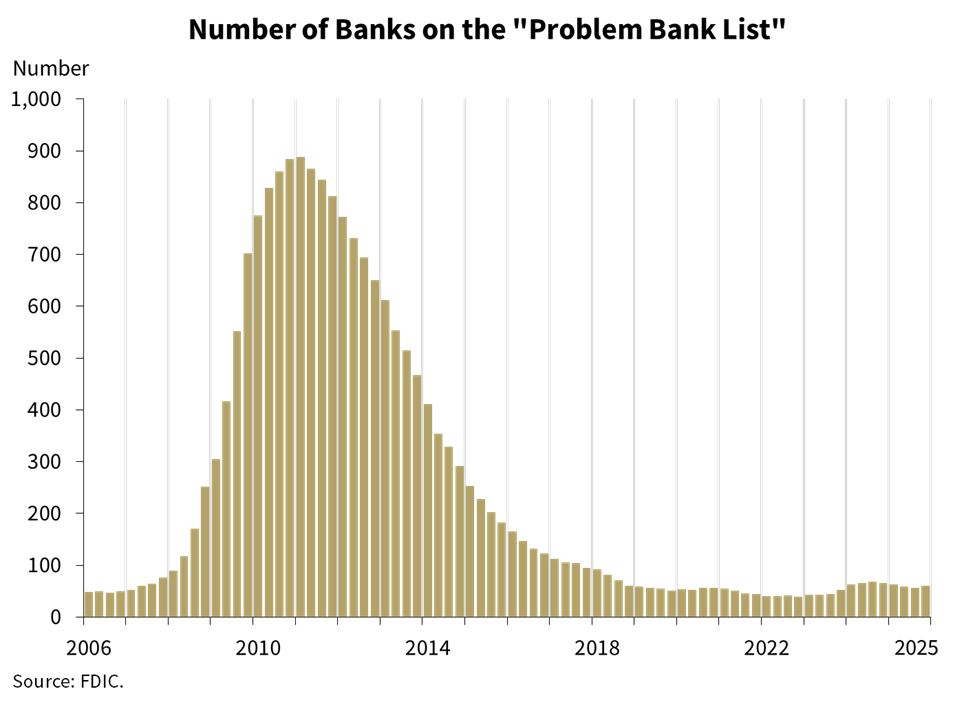
Chart 14 shows the number of banks on the FDIC’s “Problem Bank List.” Banks on this list have a CAMELS composite rating of “4” or “5.” The number of banks on the list increased by a net of three in the fourth quarter to 60 banks. The number of problem banks was 1.4 percent of total banks, which is in the normal range for non-crisis periods of 1 to 2 percent of all banks. One bank opened and no banks failed during the fourth quarter.
Chart 15
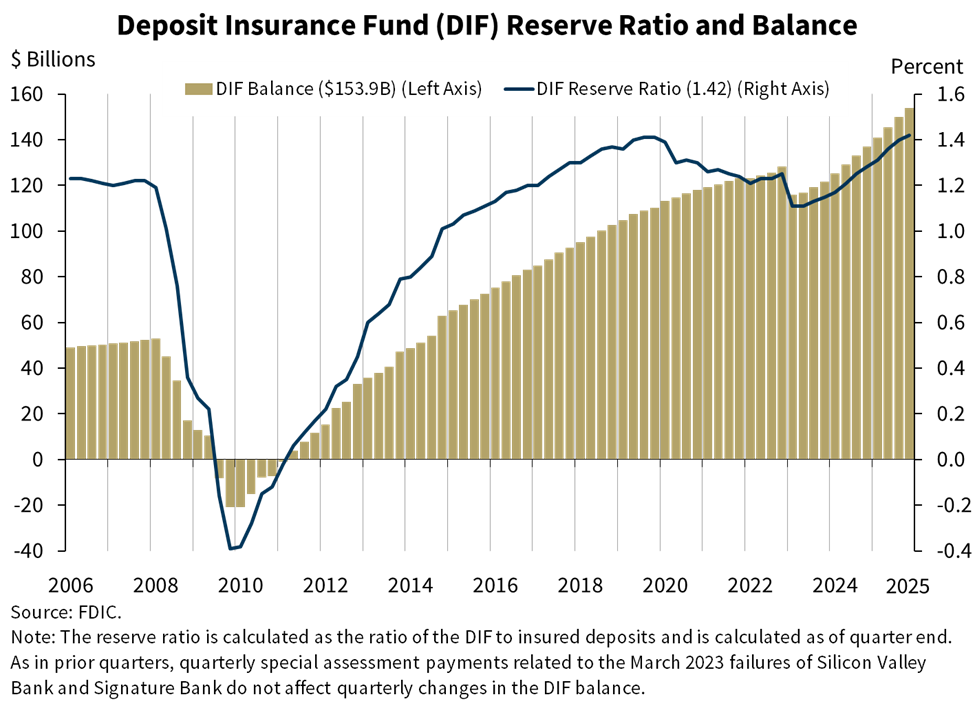
This chart shows that the Deposit Insurance Fund (DIF) balance was $153.9 billion on December 31, 2025, up $3.7 billion from the third quarter.3 Assessment revenue continued to be the primary driver of the increase, adding $3.0 billion to the DIF balance, followed by $1.2 billion in interest earned on investment securities. Negative provisions for insurance losses, unrealized gains on securities, and all other income also contributed a combined $149 million to the fund, partially offset by operating expenses of $618 million.
Insured deposits increased 1.0 percent during the fourth quarter and 1.3 percent from the year-ago quarter. The reserve ratio increased 2 basis points in the fourth quarter to 1.42 percent and was 14 basis points higher than a year ago.
In conclusion, the banking industry had a strong quarter and a strong 2025. The industry saw robust loan growth, wider NIMs, and strong earnings growth during the year. Strong capital and liquidity levels continue to support lending and protect against potential losses. However, the industry still faces weakness in certain loan portfolios and elevated unrealized losses. These issues will remain matters of ongoing supervisory attention by the FDIC.
| 1 | In this statement, the terms “past-due and nonaccrual” or “PDNA” are used to describe loans that are 30 or more days past-due or on nonaccrual status. |
| 2 | The period used to calculate pre-pandemic averages is first quarter 2015 through fourth quarter 2019. |
| 3 | As in prior quarters, quarterly special assessment payments related to the March 2023 failures of Silicon Valley Bank and Signature Bank do not affect quarterly changes in the DIF balance. |