
FDIC Quarterly Banking Profile Second Quarter 2025
Today, the FDIC is releasing second quarter 2025 performance results for FDIC-insured institutions.
The banking industry finished the quarter with slightly lower earnings quarter over quarter, resulting in a return on assets (ROA) ratio of 1.13 percent. The decline was primarily attributable to an increase in provision expenses related to a large bank acquisition, absent which net income would have increased. Domestic deposits increased for the fourth consecutive quarter and loan growth accelerated. Asset quality metrics remained generally favorable despite continued weakness in certain portfolios, which we are monitoring closely.
The banking industry continued to have strong capital and liquidity levels, which support lending and protect against potential losses. At the same time, institutions continue to navigate weakness in certain loan portfolios and elevated unrealized losses, among other challenges.
Chart 1
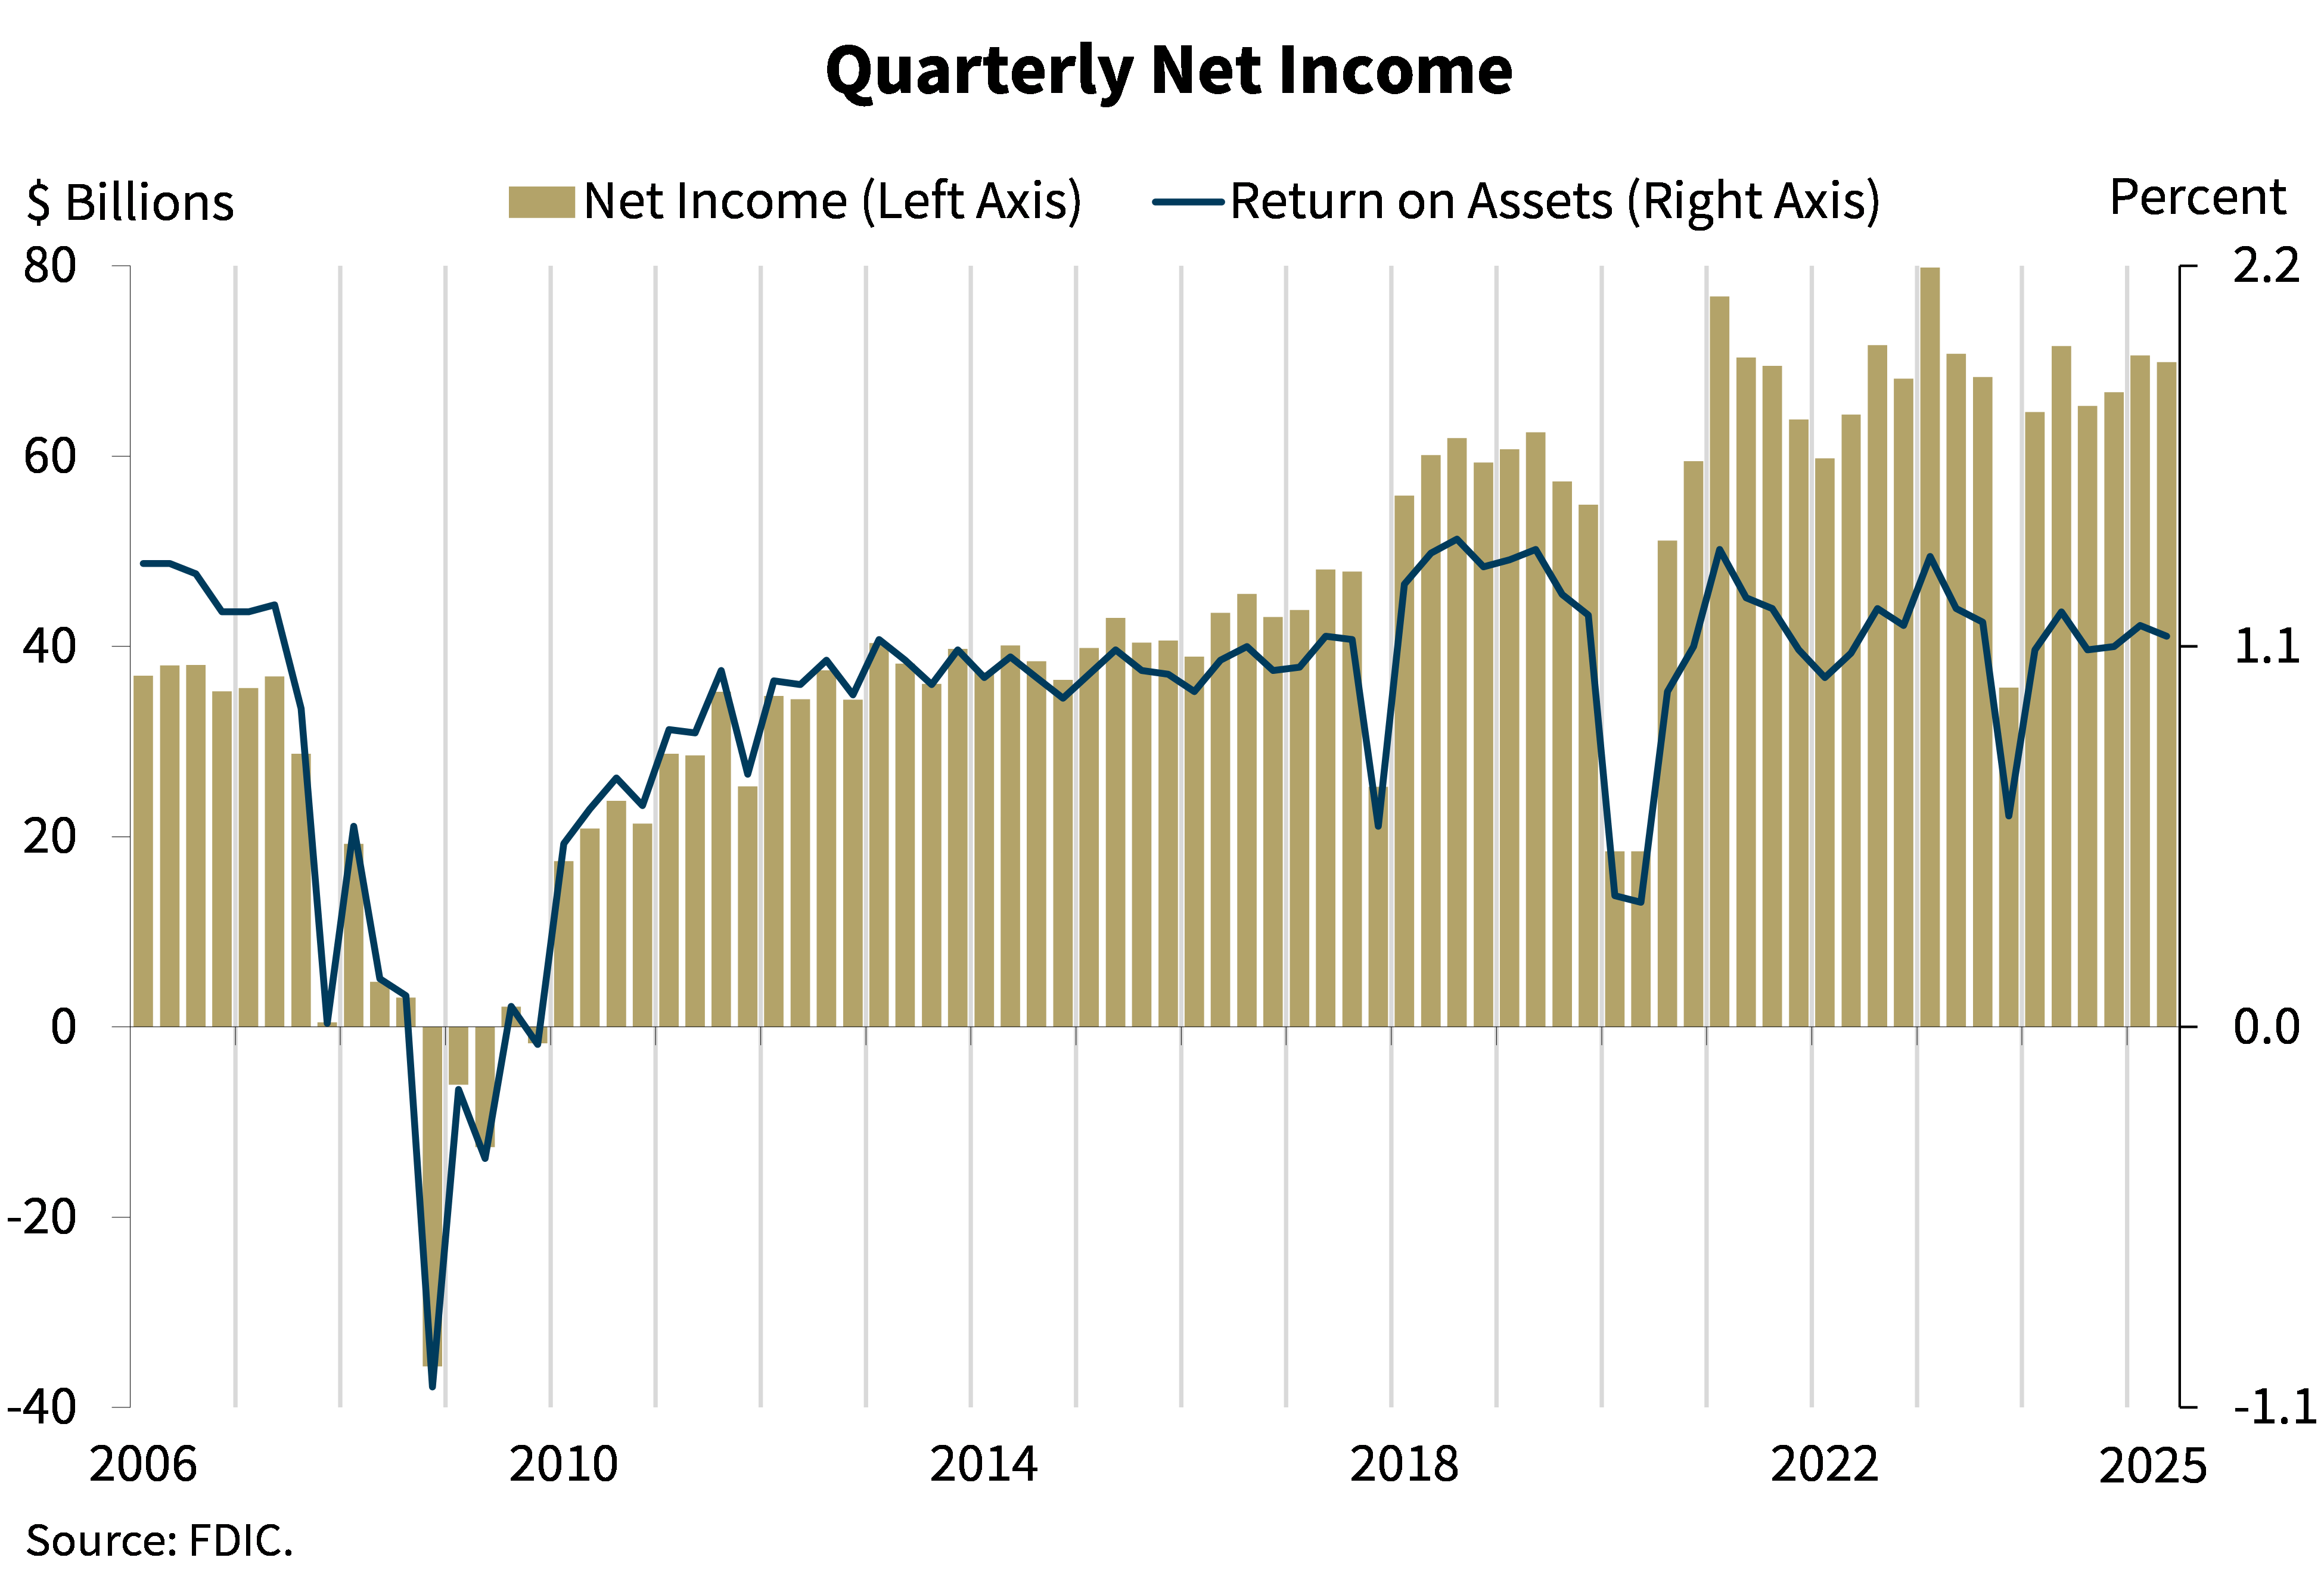
Chart 11 shows that the banking industry reported quarterly net income of $69.9 billion, a decrease of $677.3 million, or 1 percent, from the prior quarter. The quarterly decrease in net income was led by an increase in provision expenses related to a large bank acquisition. The banking industry reported an ROA ratio of 1.13 percent in second quarter 2025, down 3 basis points from one quarter earlier and down 6 basis points from one year earlier.
Community bank quarterly net income increased 12.5 percent from the prior quarter to $7.6 billion, driven by higher net interest income and noninterest income.
Chart 2
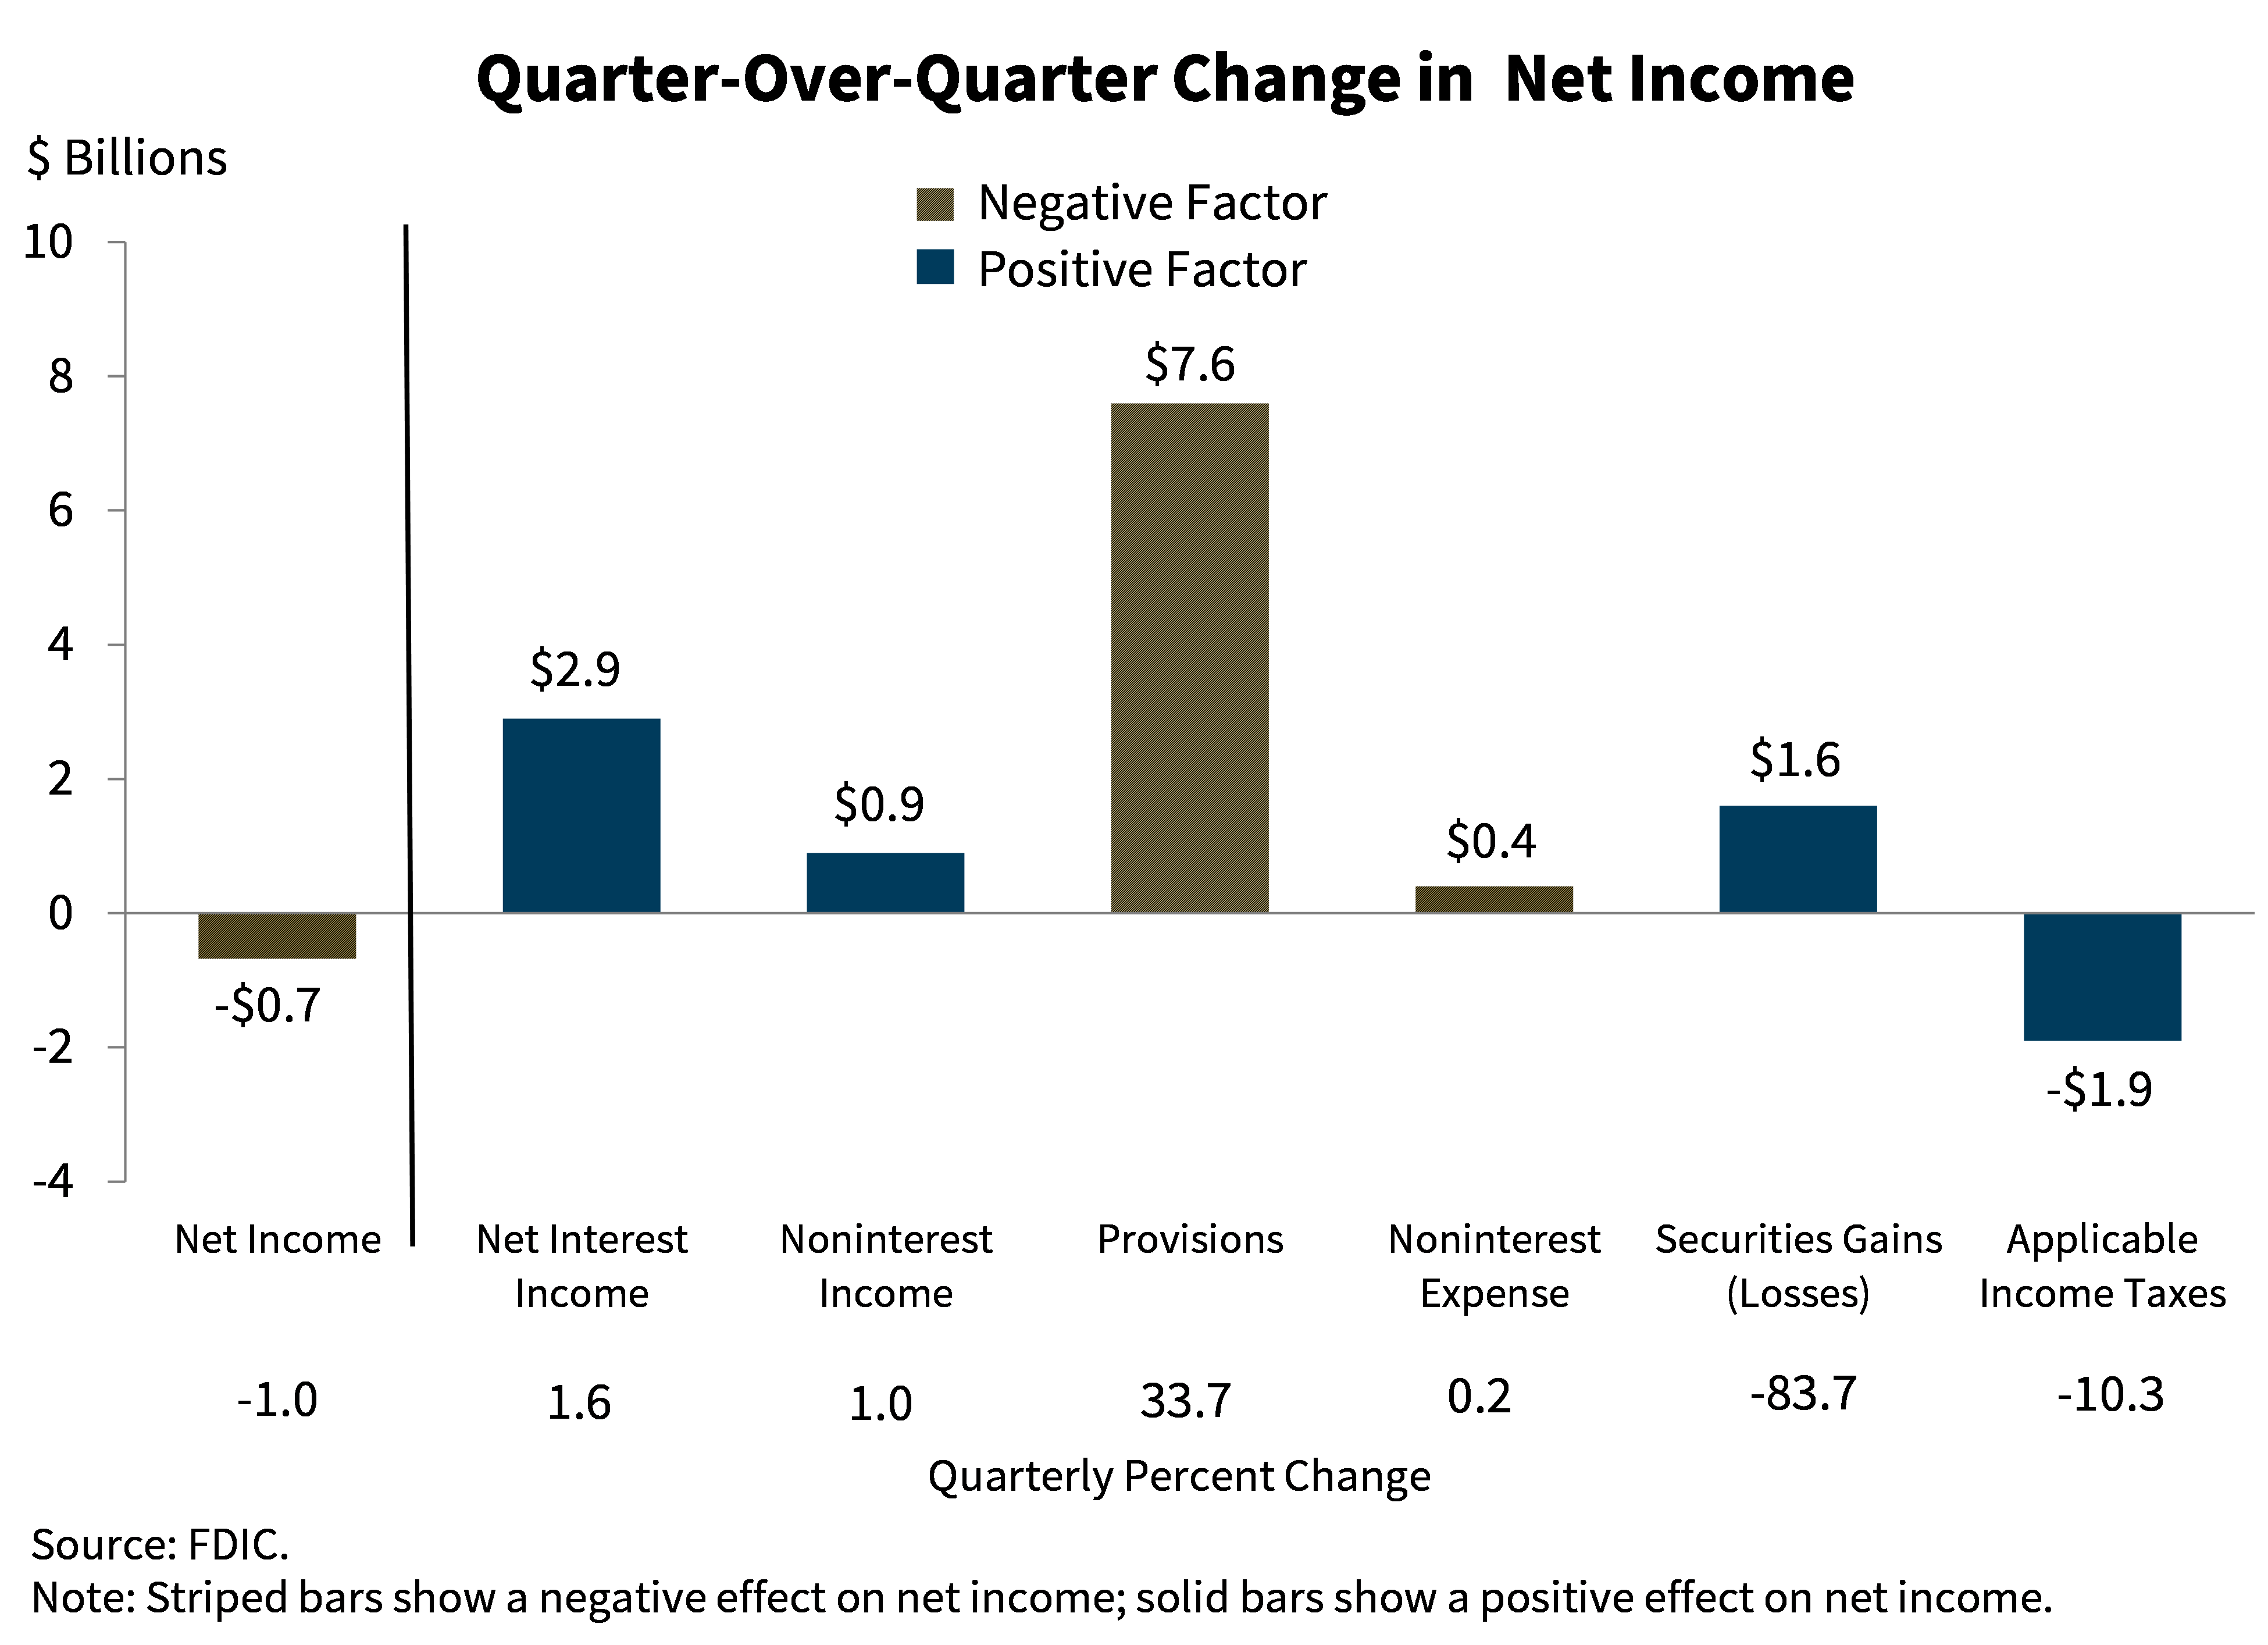
Chart 2 shows the breakdown of the changes in the industry’s net income quarter over quarter. The primary driver of the industry’s $677.3 million decrease in net income was higher provision expense, which increased $7.6 billion, or 33.7 percent. The increase in provision expense was largely attributable to Capital One’s acquisition of Discover Financial Services, as accounting standards require the acquiring institution to recognize a provision expense related to certain acquired assets. Absent this large provision expense, net income would have increased due to higher net interest and noninterest income.
Chart 3
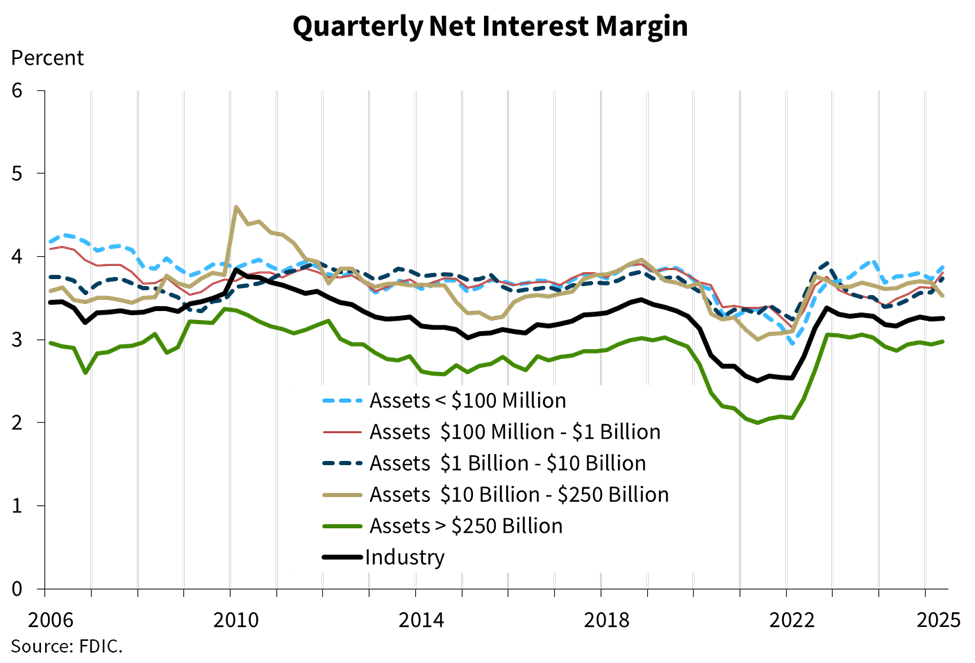
Chart 3 shows the average net interest margin (NIM) for the industry and for five asset-size cohorts. The industry’s NIM was relatively flat, up one basis point from the prior quarter to 3.26 percent, which is above the pre-pandemic average of 3.25 percent.2
The community bank NIM increased to 3.62 percent, up 16 basis points from the prior quarter. Community bank NIM is approaching the pre-pandemic average of 3.63 percent.
Chart 4
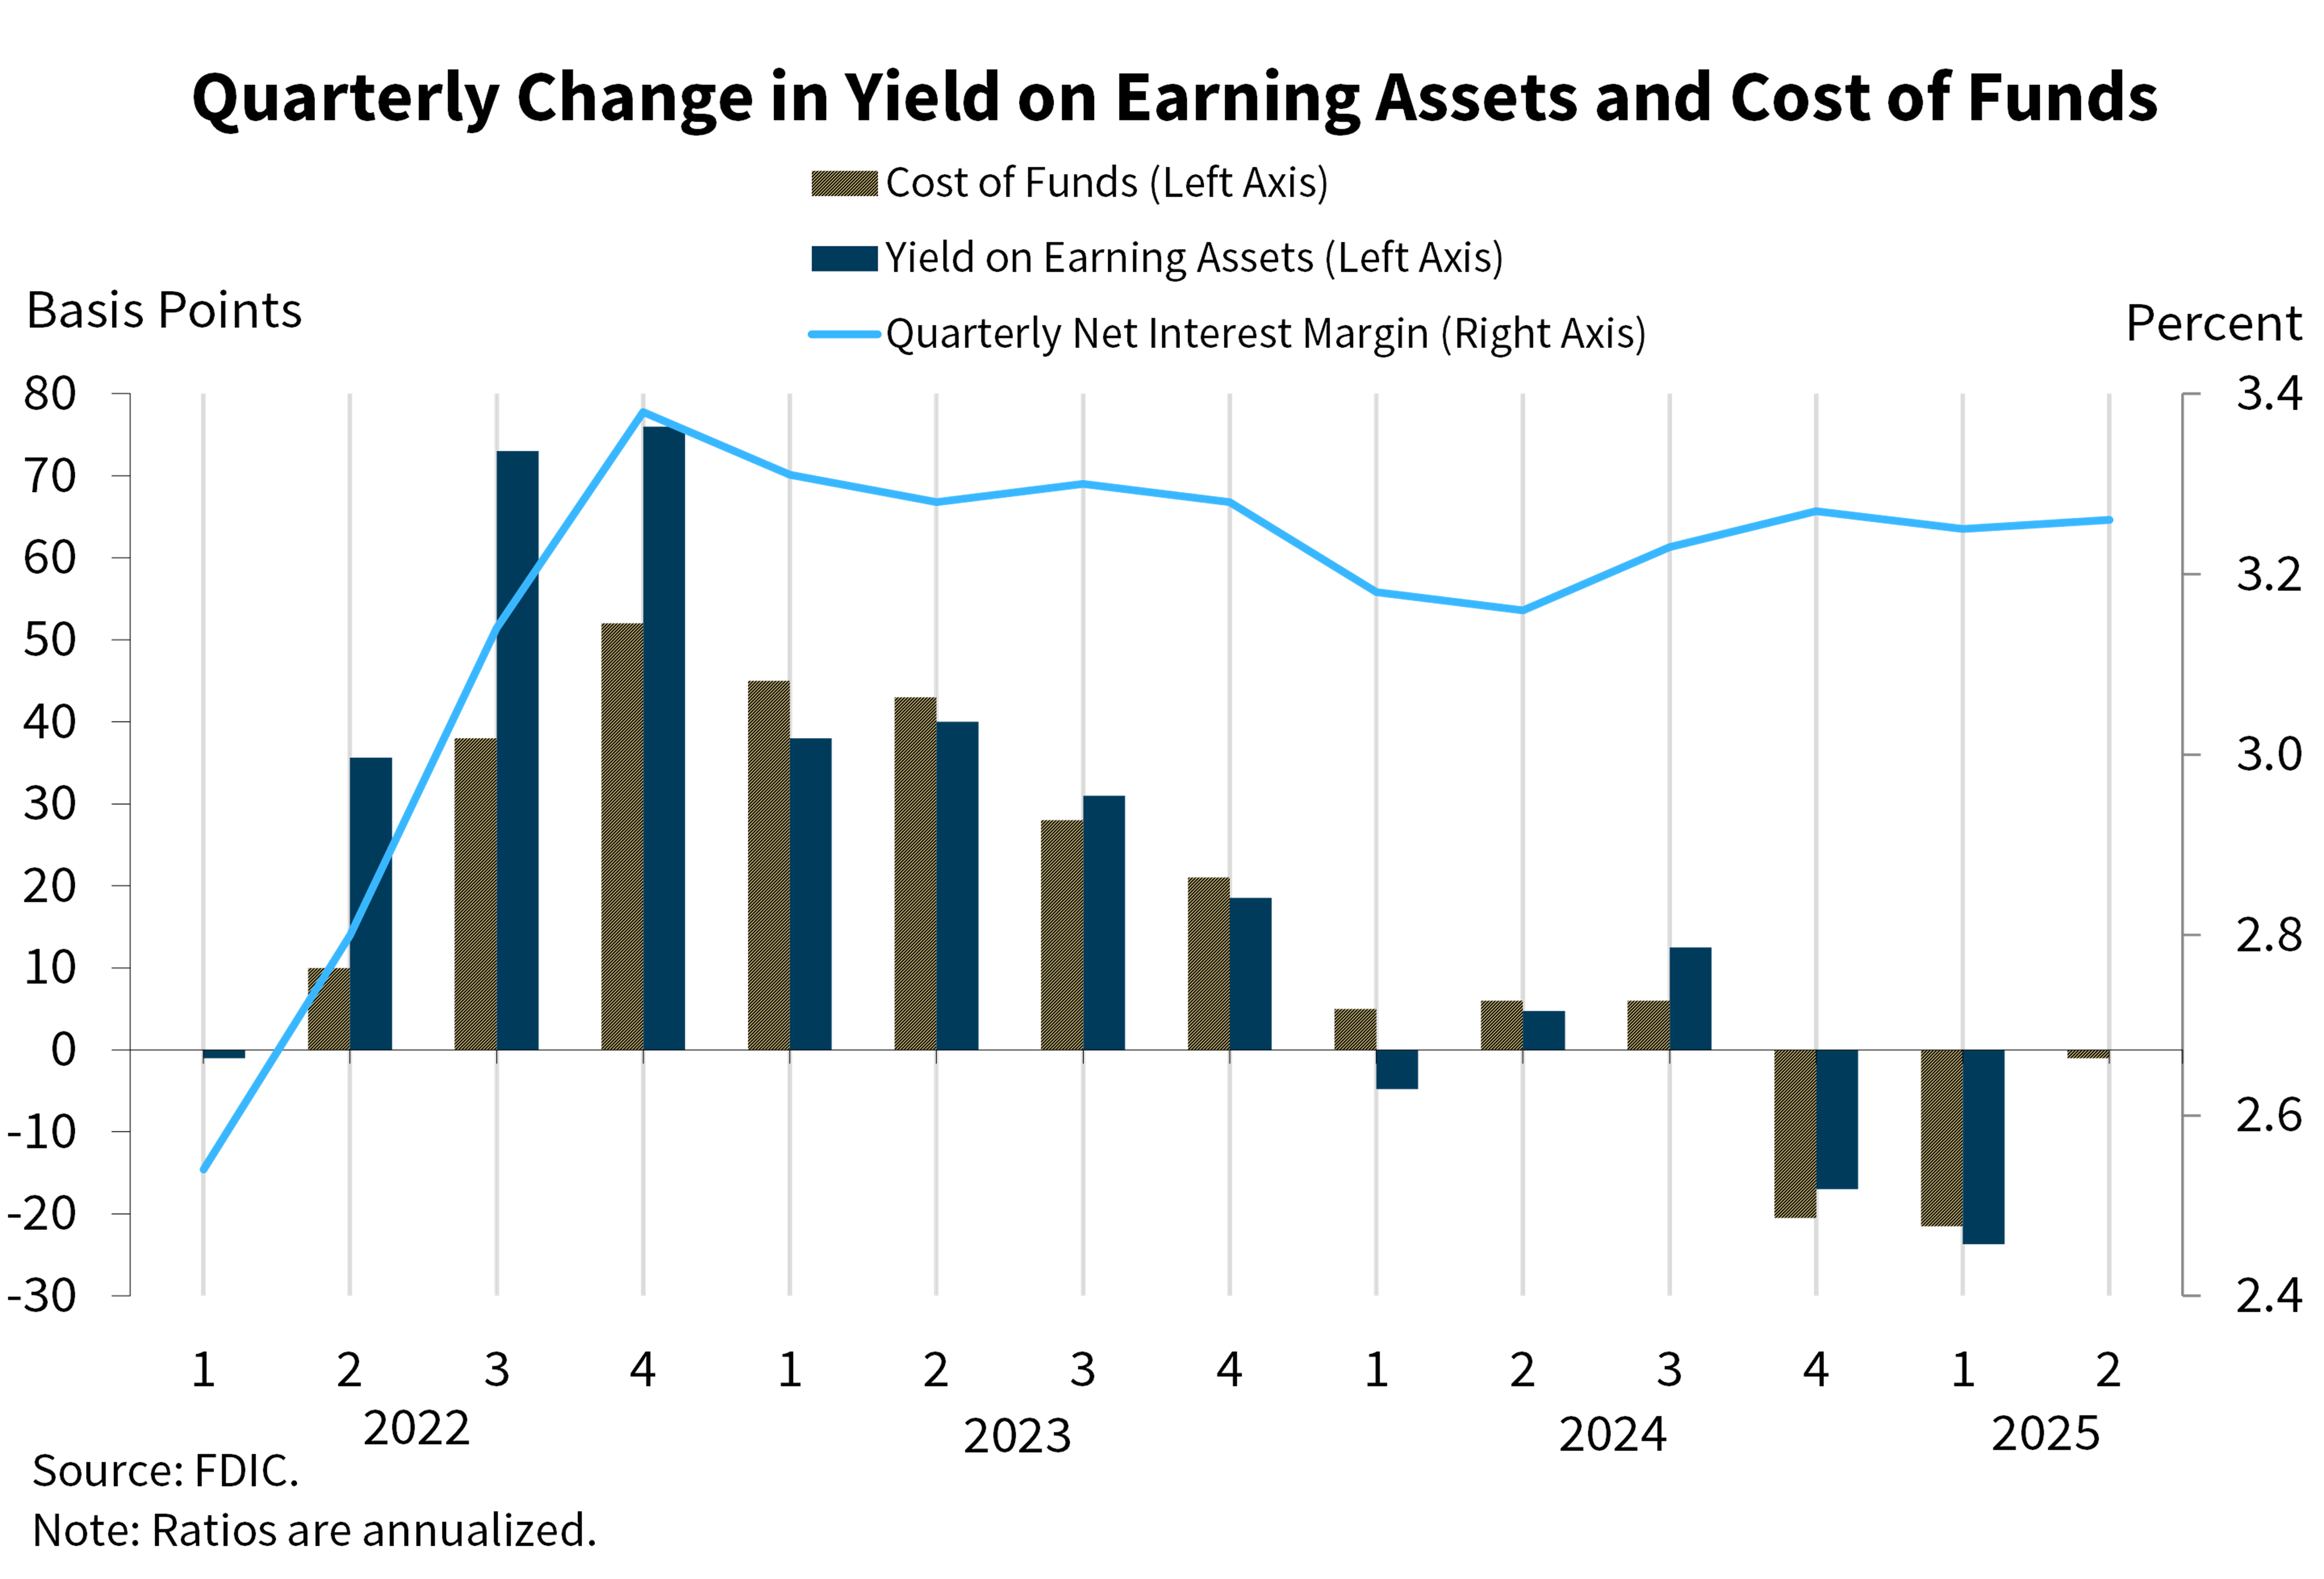
Chart 4 shows the quarter-over-quarter changes in the industry’s average yield on earning assets and average cost of funds. During the quarter, the cost of funds decreased 1 basis point while the yield on earning assets remained unchanged, resulting in a one basis point increase in the industry’s NIM in second quarter 2025.
Community banks’ NIM increased in the second quarter, driven by a 16 basis-point increase in the earning assets yield and no change in the cost of funds.
Chart 5
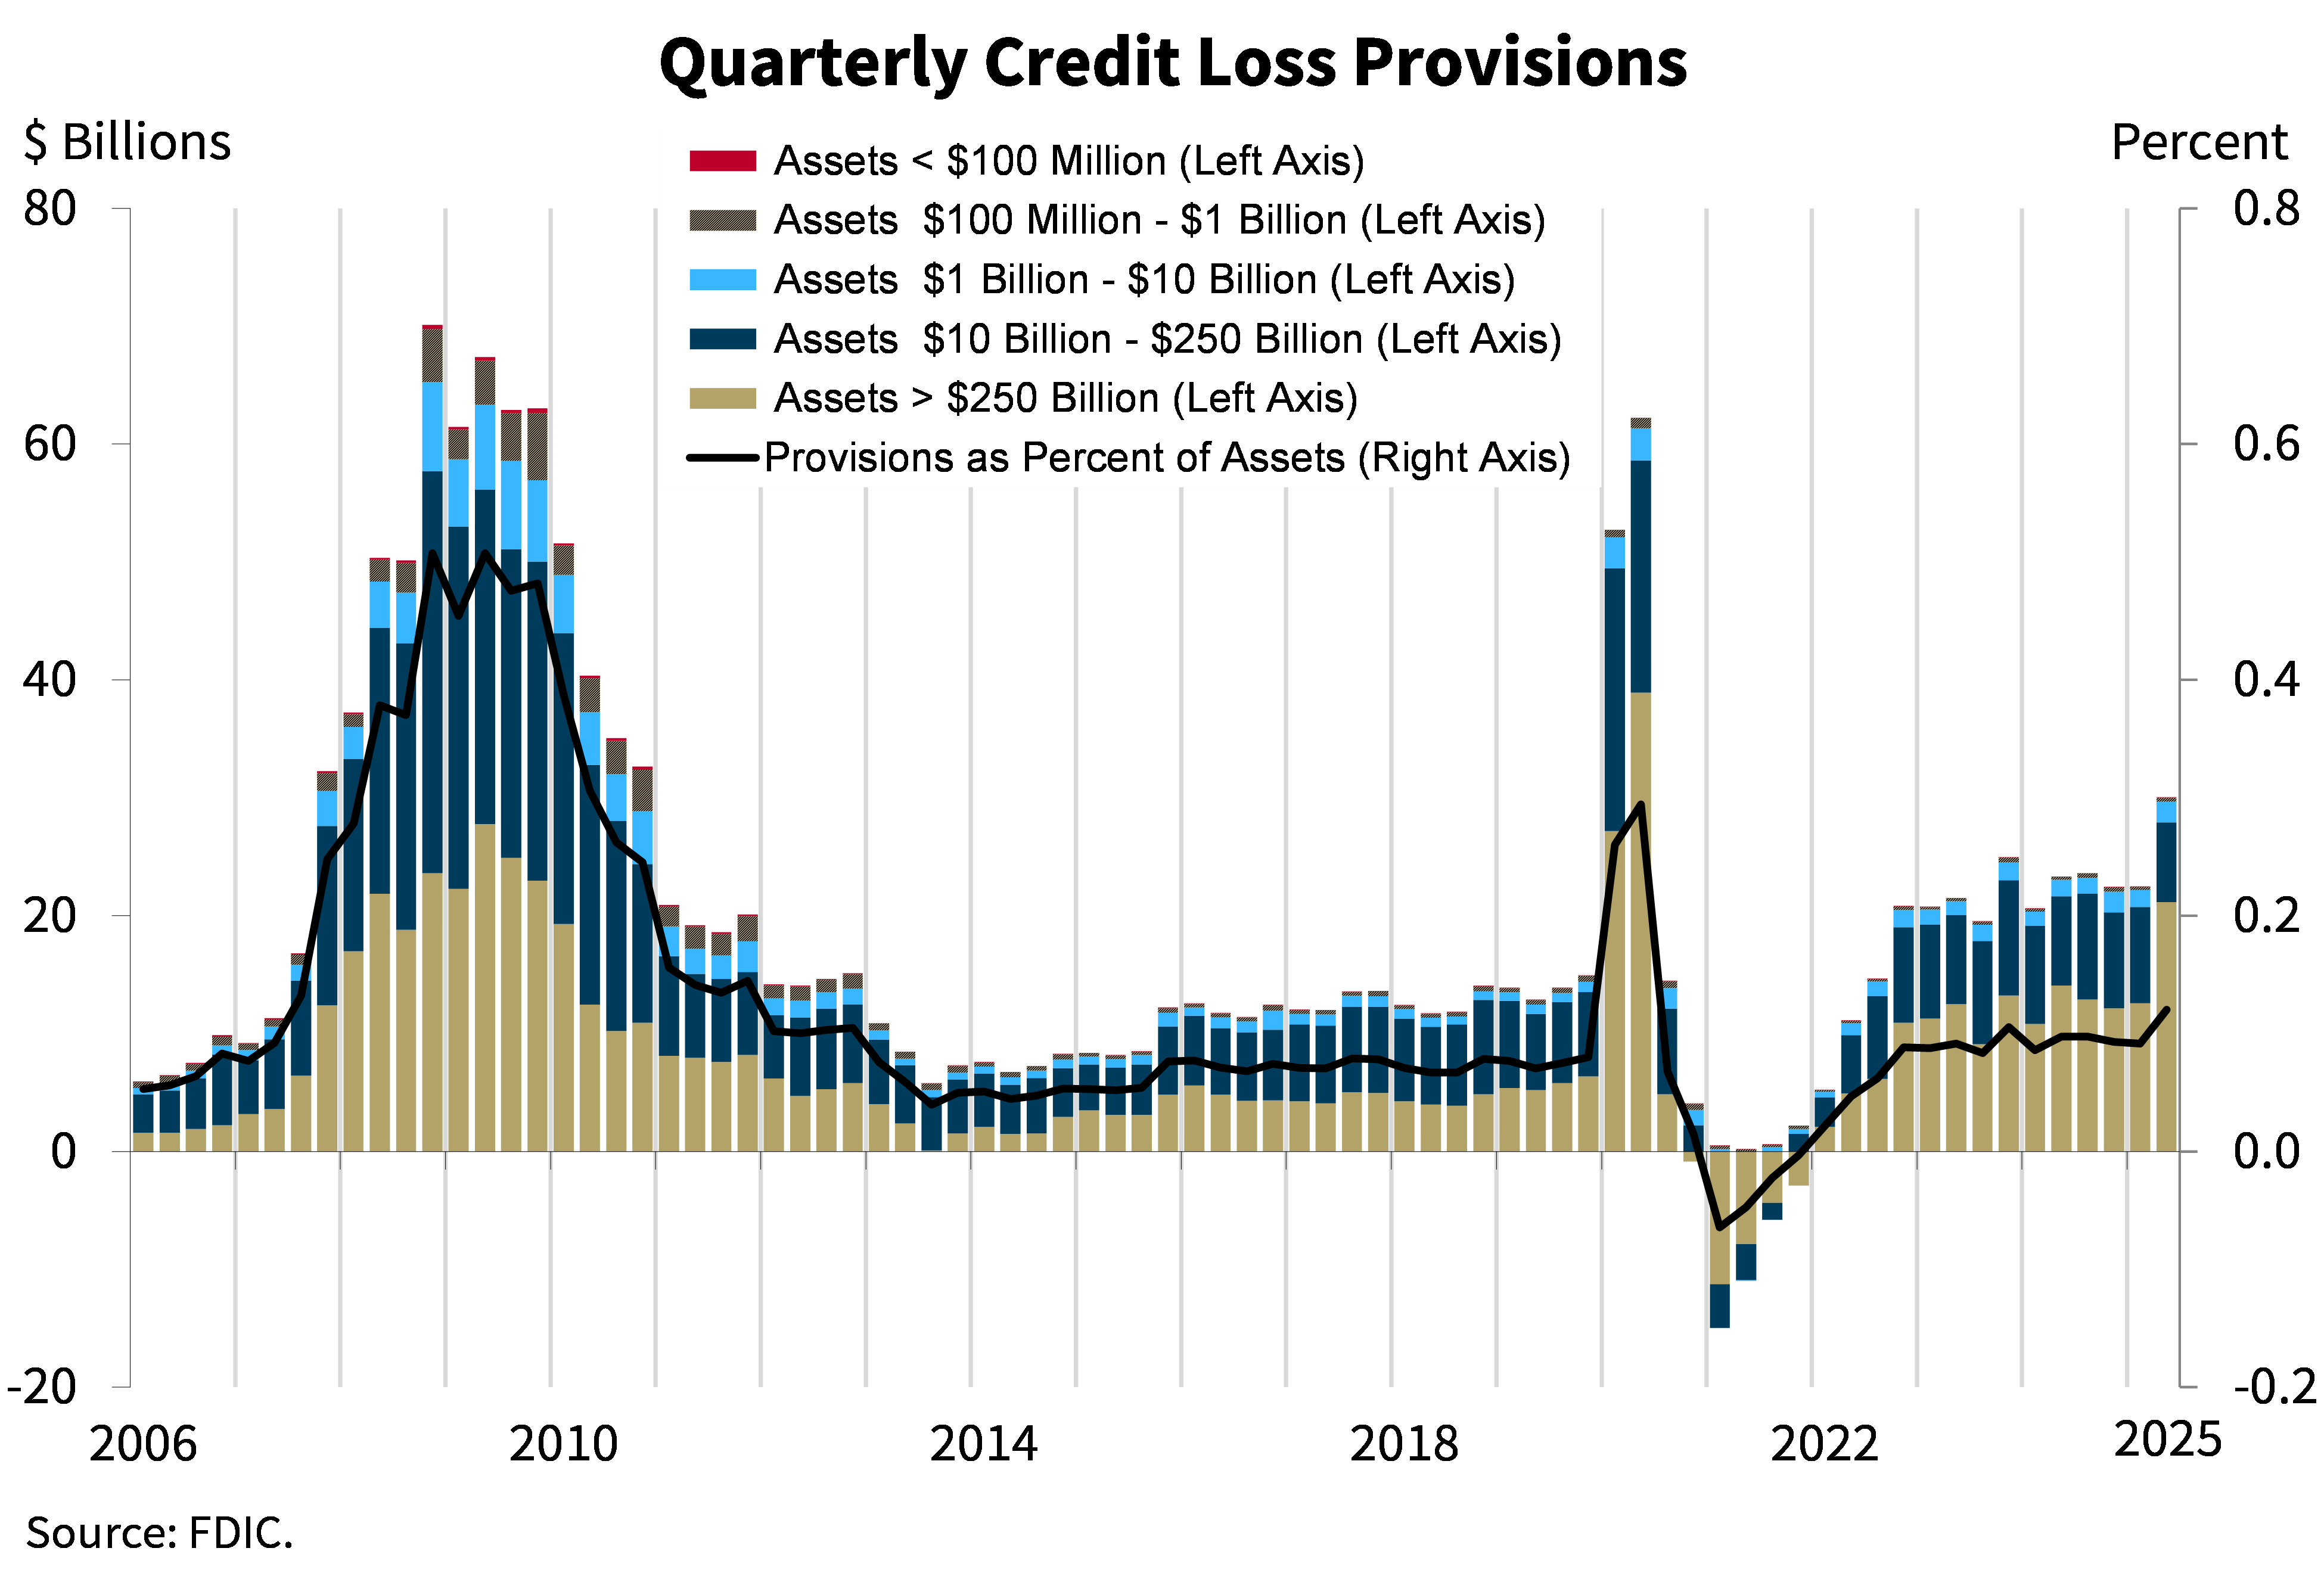
Chart 5 shows that the industry’s provision expense was $30 billion in the second quarter, an increase of $7.6 billion from the first quarter. The increase was driven by Capital One’s acquisition of Discover Financial Services, as accounting standards require the acquiring institution to recognize a provision expense related to certain acquired assets. This provision expense resulted in a reduction in net income from the prior quarter for the industry. Absent this acquisition, provisions would have slightly declined from the prior quarter and year-ago quarter, and net income would have increased.
Chart 6
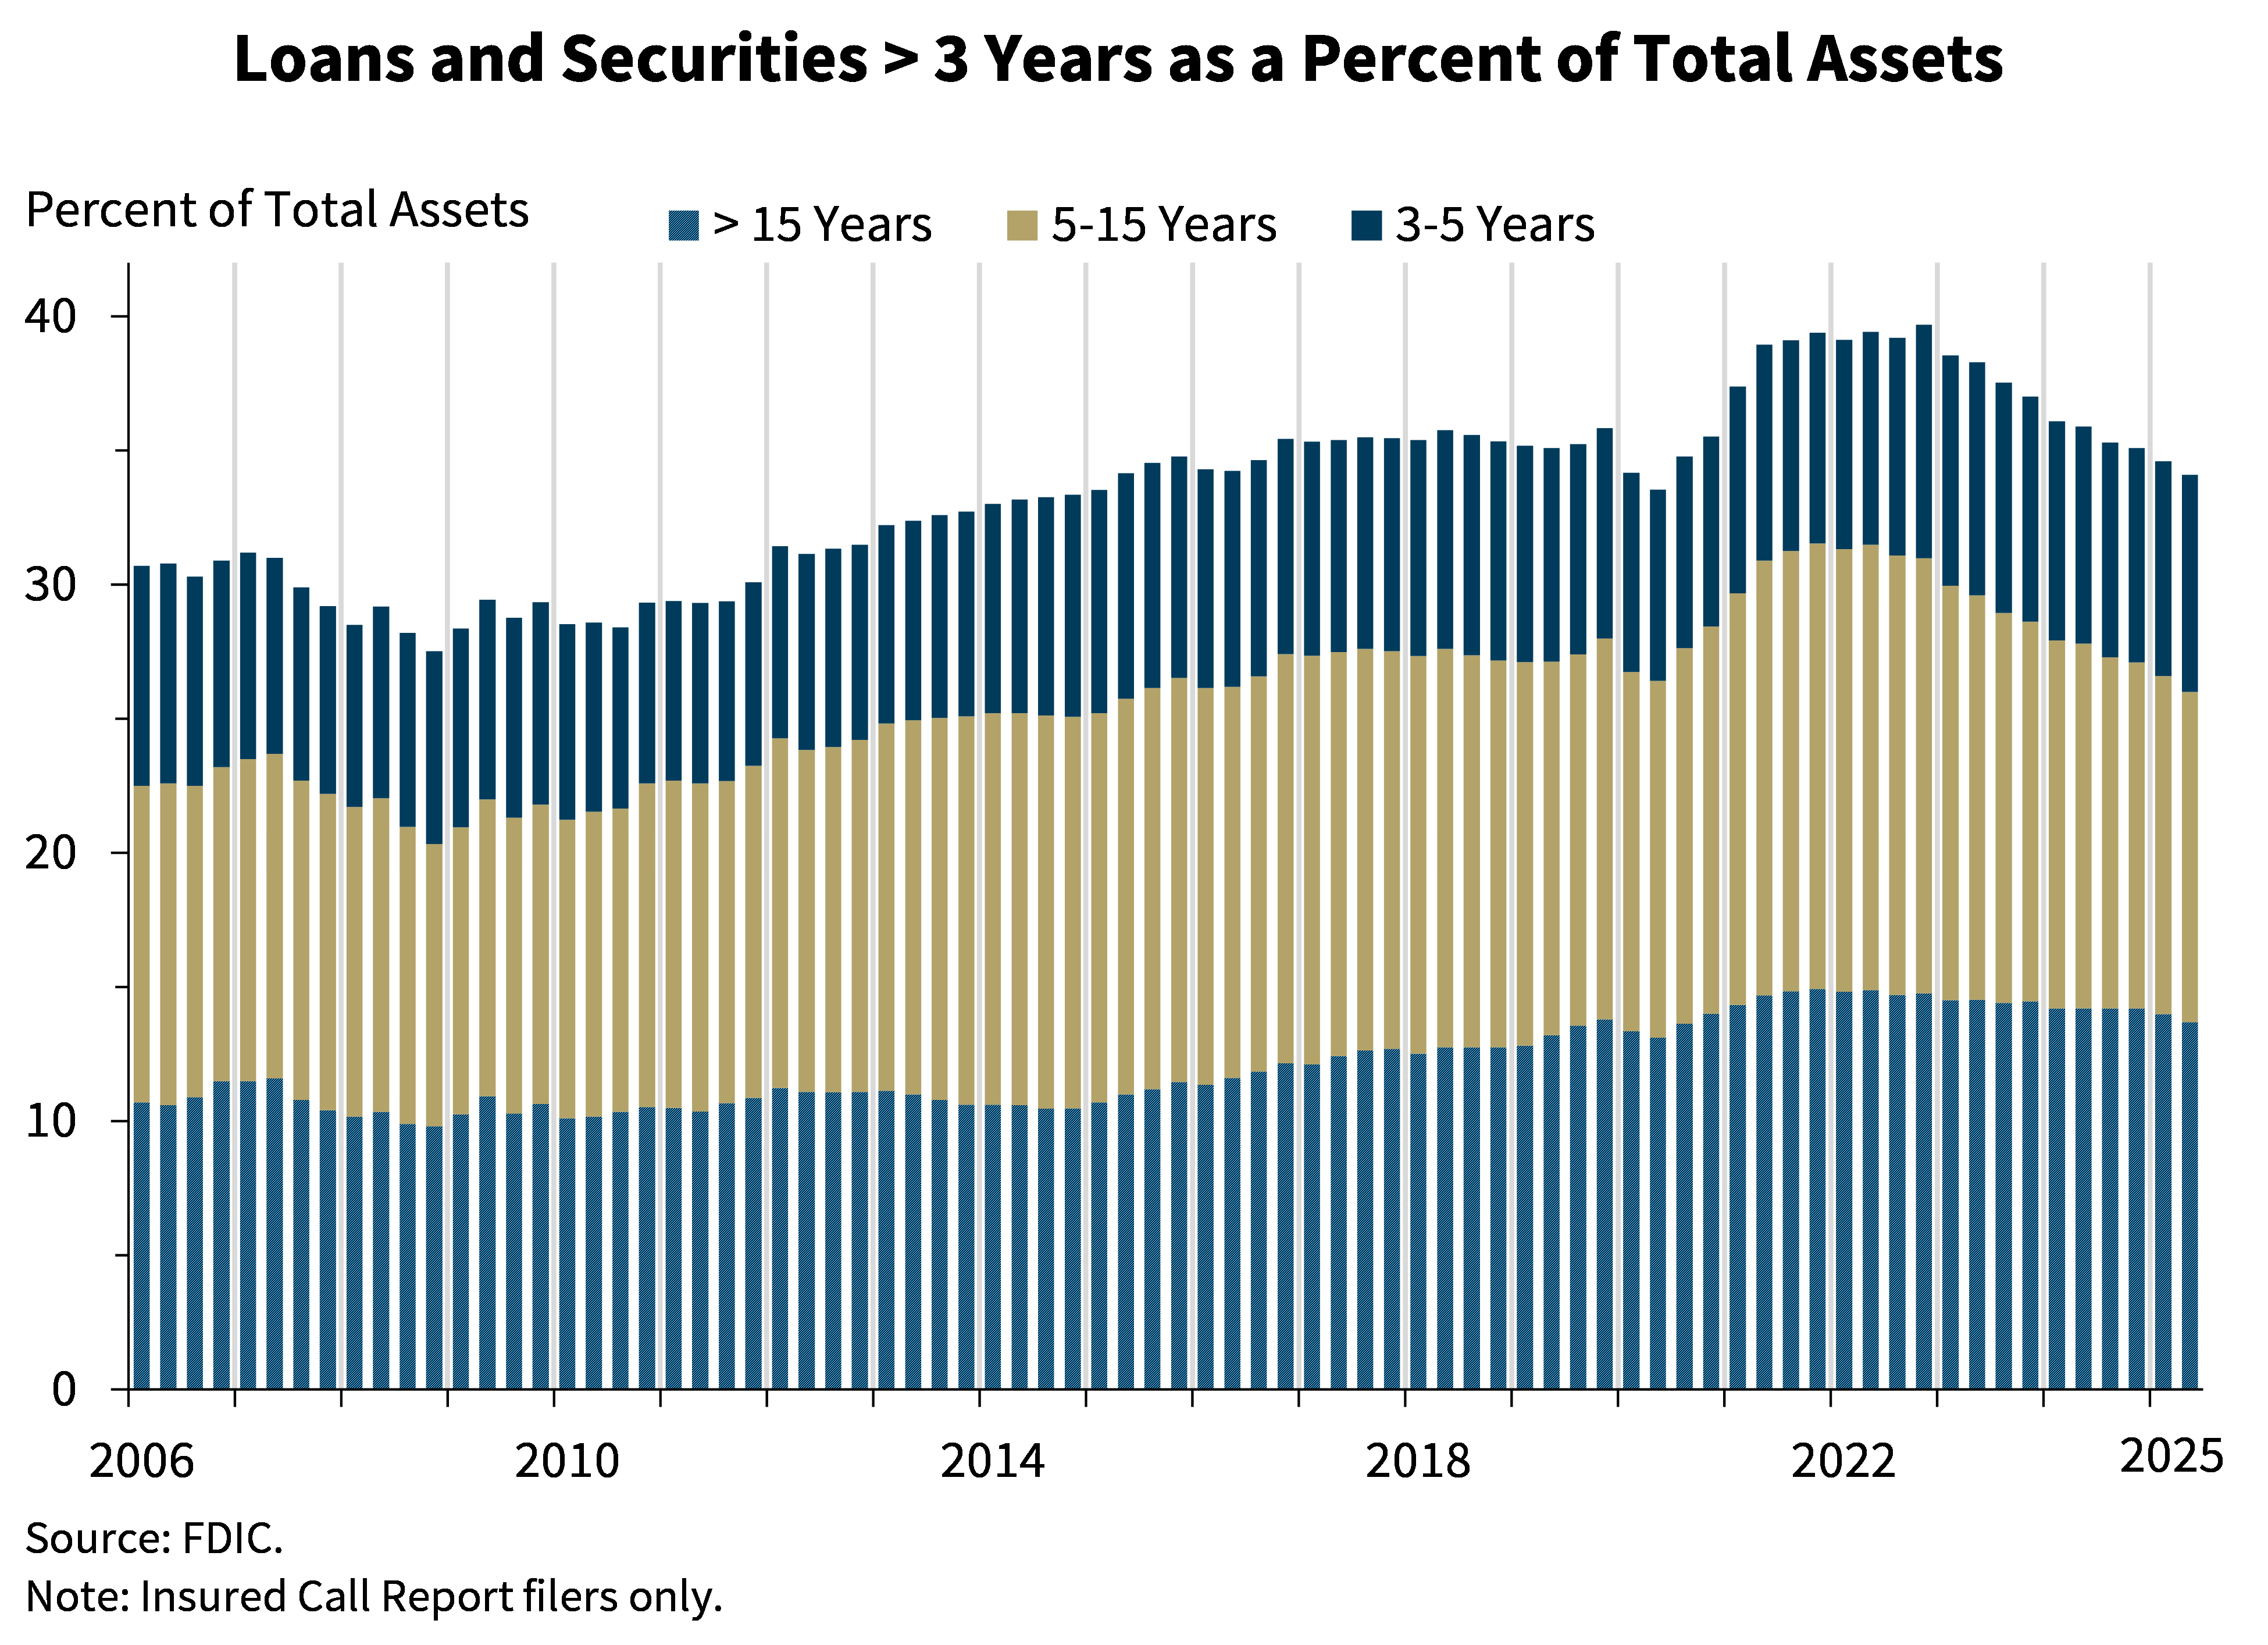
Chart 6 shows that the banking industry’s share of total assets made up of longer-term loans and securities fell for the tenth consecutive quarter to 34.1 percent after peaking at 39.7 percent in fourth quarter 2022. The industry’s longer-term assets as a share of total assets are now below the pre-pandemic average of 35 percent.
At community banks, longer-term loans and securities made up 43.6 percent of total assets in second quarter 2025, down from 44.2 percent the prior quarter and below the pre-pandemic average of 48.9 percent.
Chart 7
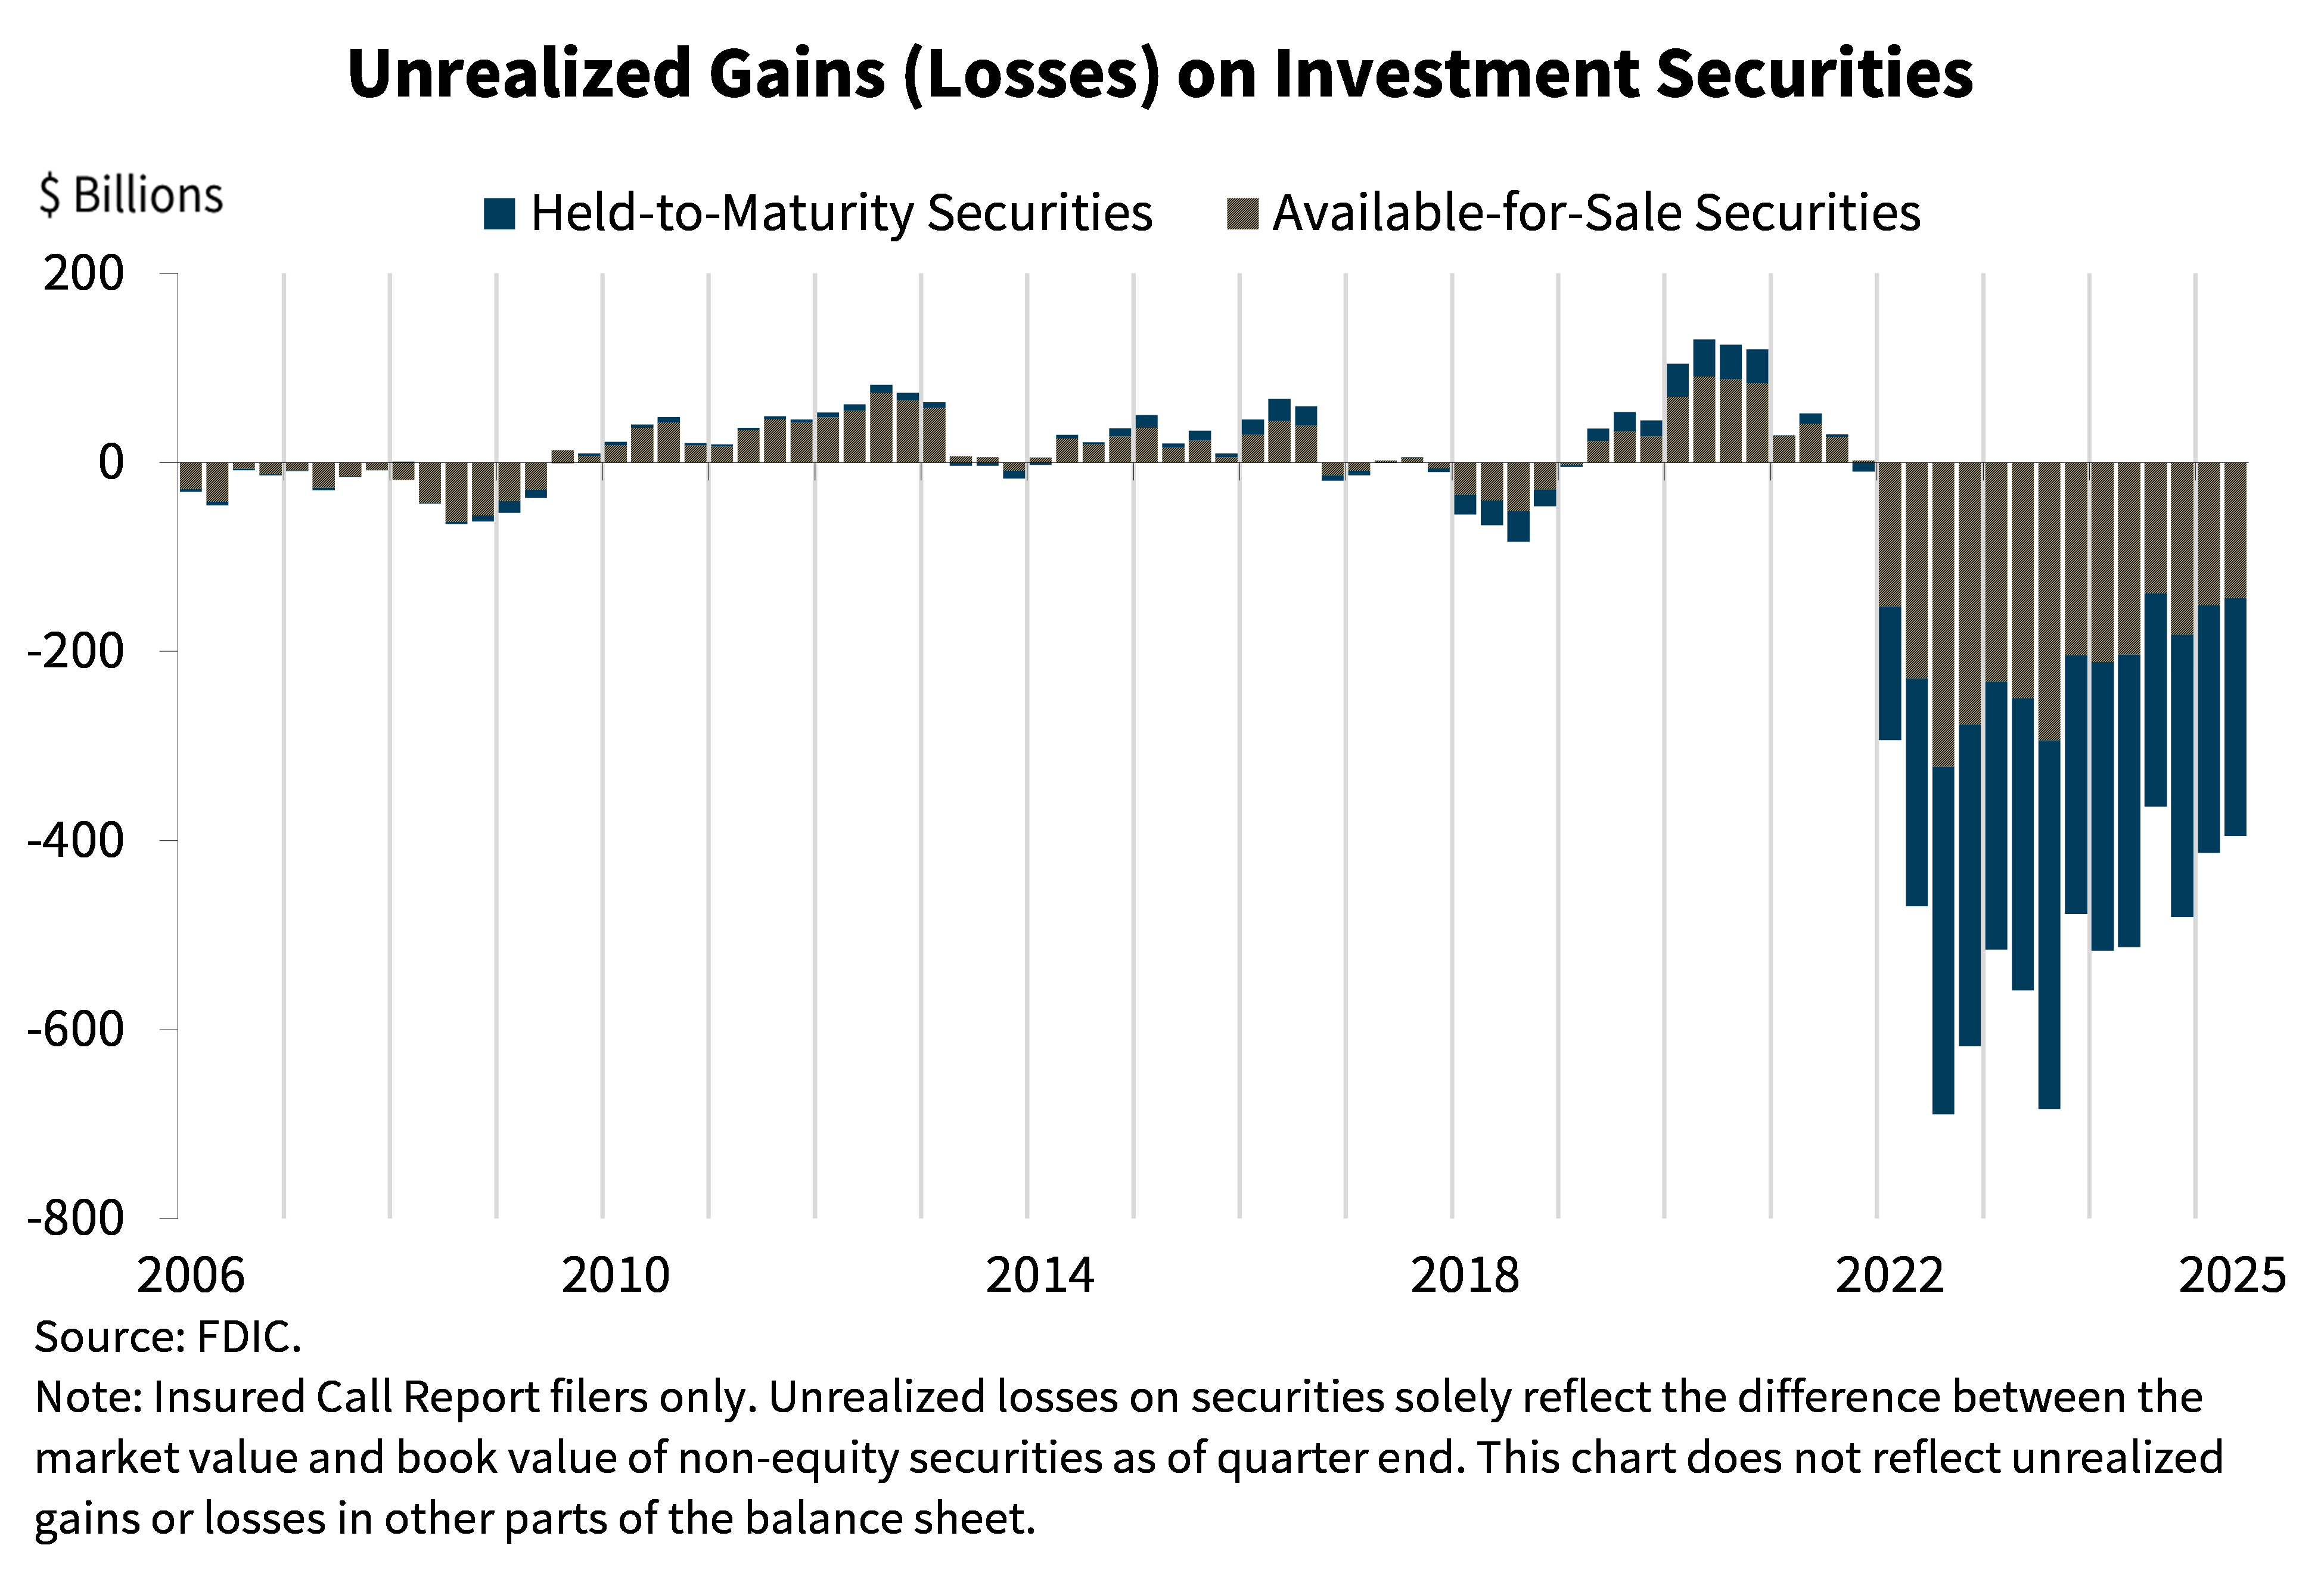
Chart 7 shows the level of unrealized losses on held-to-maturity and available-for-sale securities portfolios. Total unrealized losses of $395.3 billion decreased $17.9 billion (4.3 percent) from the prior quarter as low-yielding securities continued to roll off the balance sheet.
Chart 8
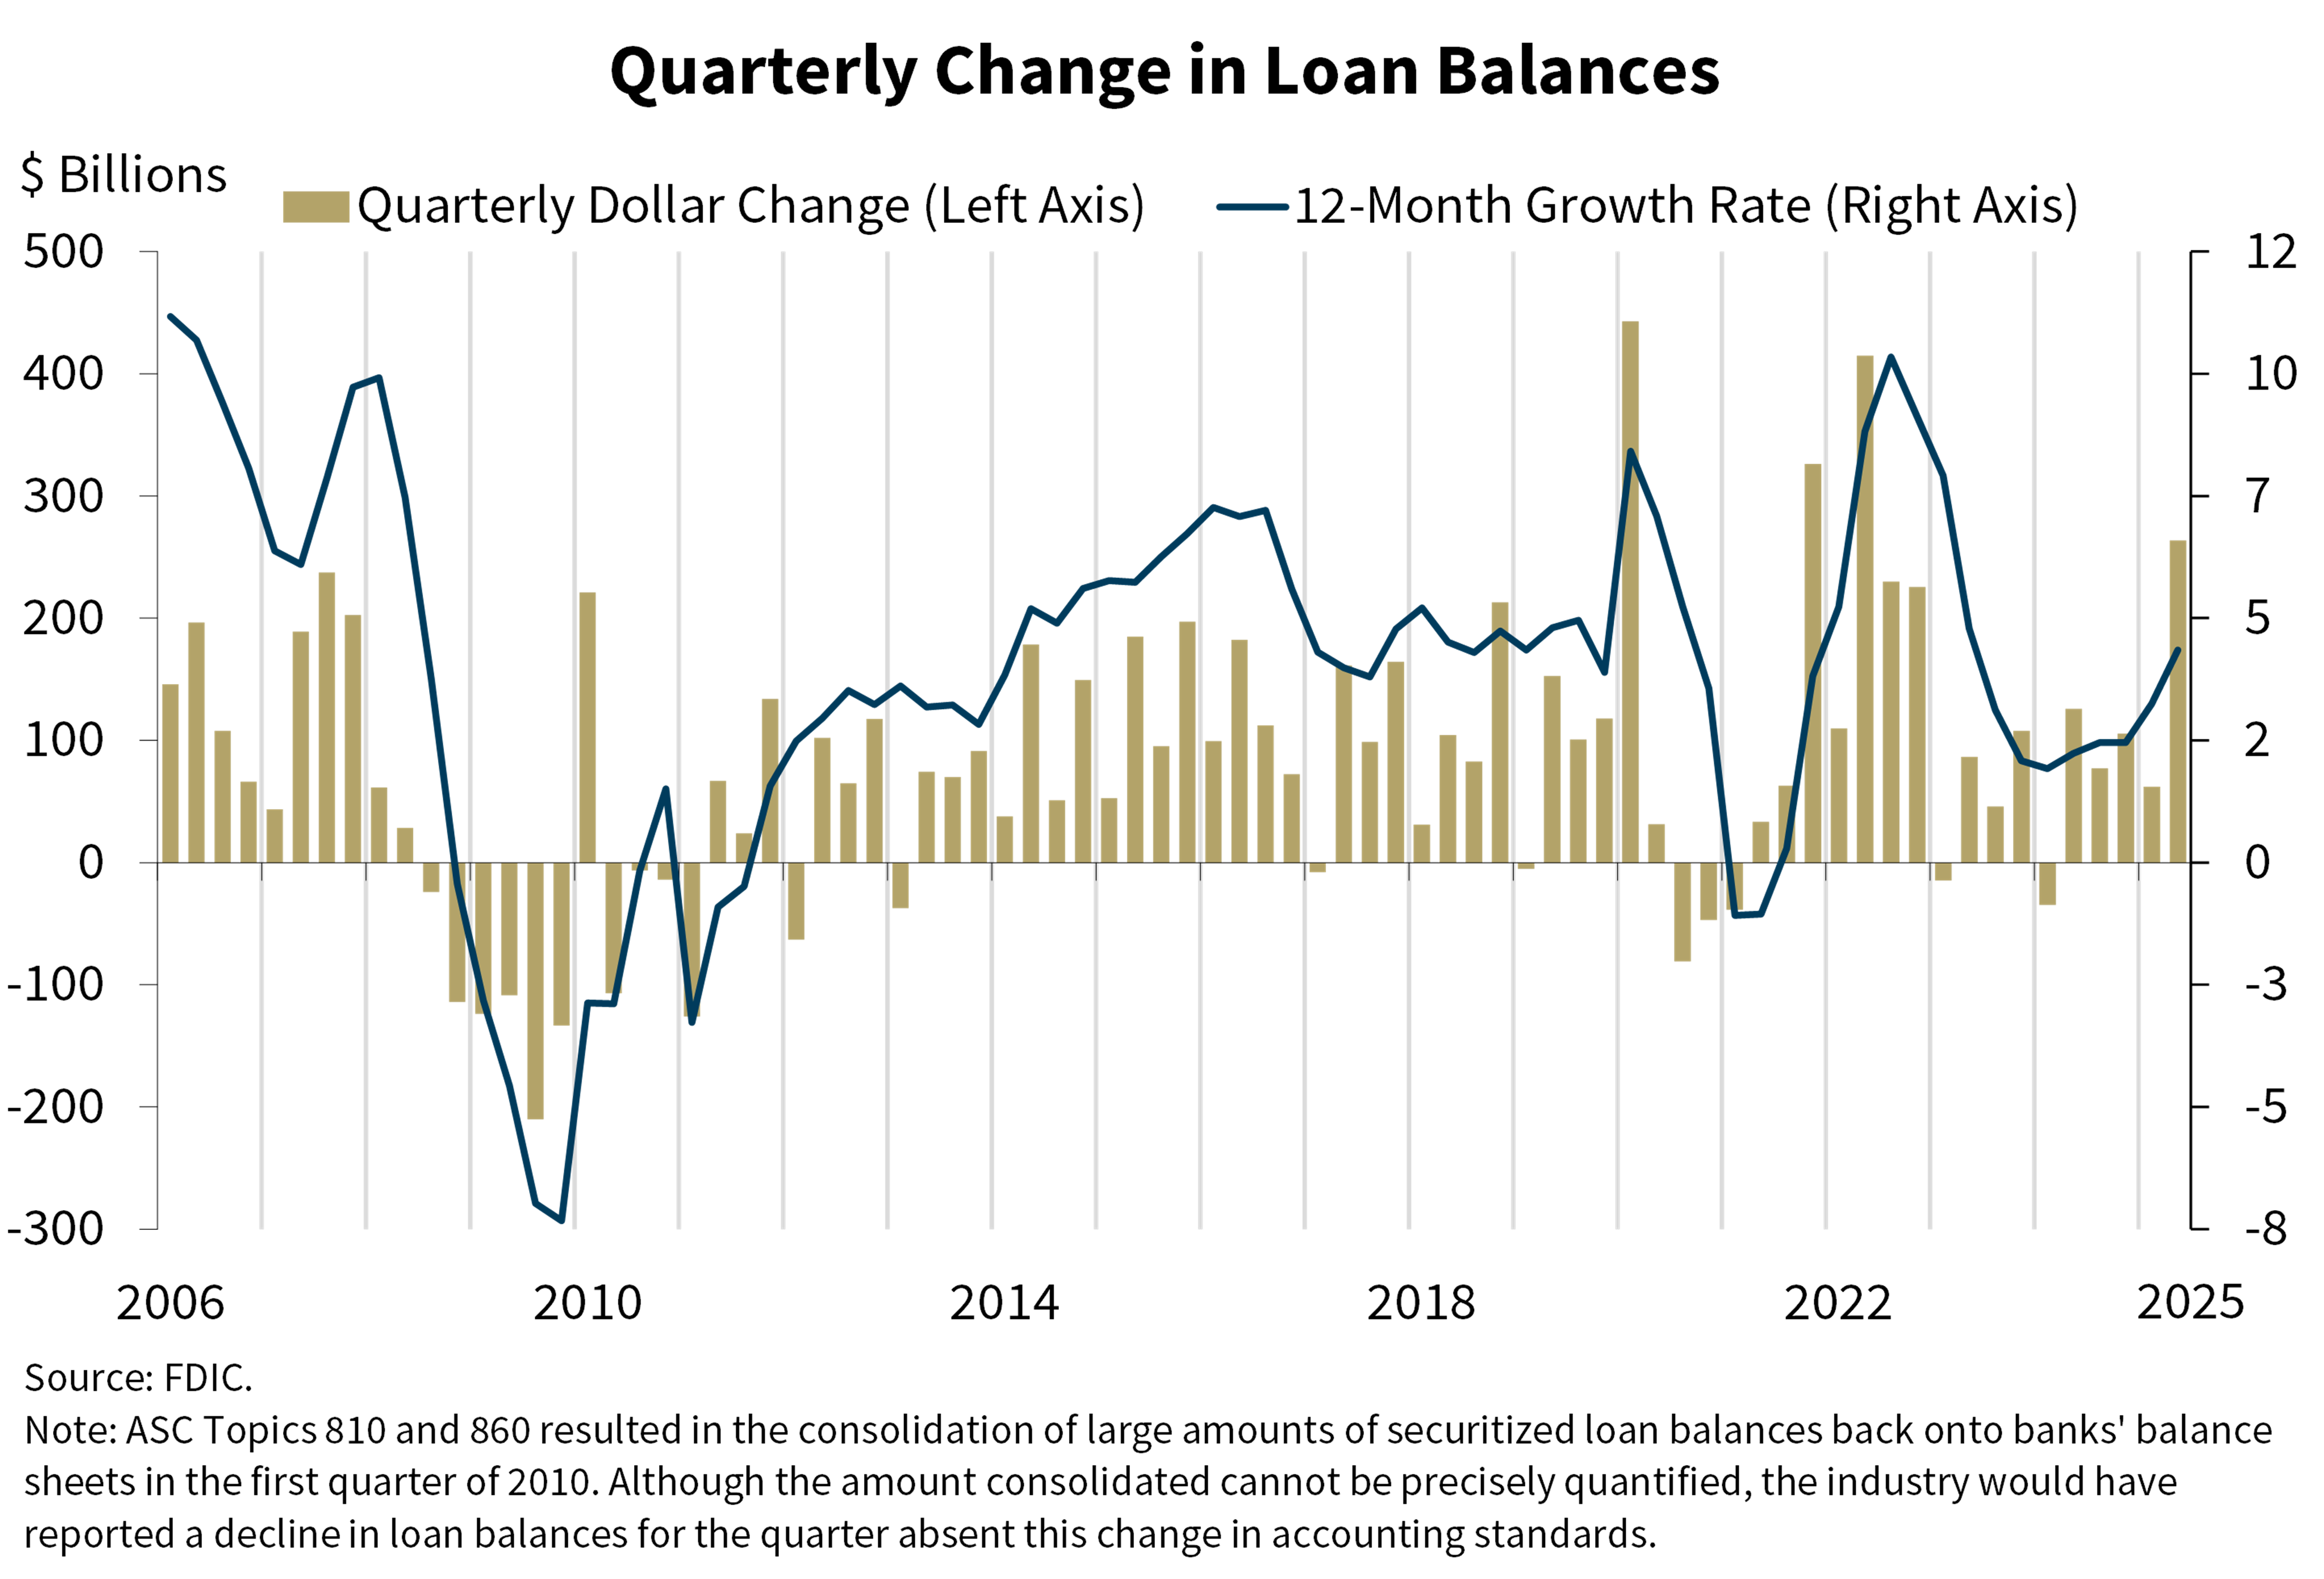
Chart 8 shows the change in loan balances on a quarterly and annual basis. The industry’s total loans increased by $263.7 billion, or 2.1 percent, in the second quarter. Loans to non-depository financial institutions (NDFIs) and loans to purchase or carry securities, including margin loans, had the largest dollar increase among loan types reported, though some of this increase was due to continued reclassifications following the finalization of changes to how certain loan products are reported. In addition, credit cards, nonfarm nonresidential commercial real estate (CRE), and 1–4 family residential loans contributed to the industry’s quarterly loan growth. The industry’s annual rate of loan growth in the second quarter increased to 4 percent, below the pre-pandemic average of 4.9 percent.
Total loans at community banks increased 1.7 percent from the prior quarter and 4.9 percent from the prior year, led by increases in nonfarm nonresidential CRE and 1–4 family residential mortgage portfolios.
Chart 9
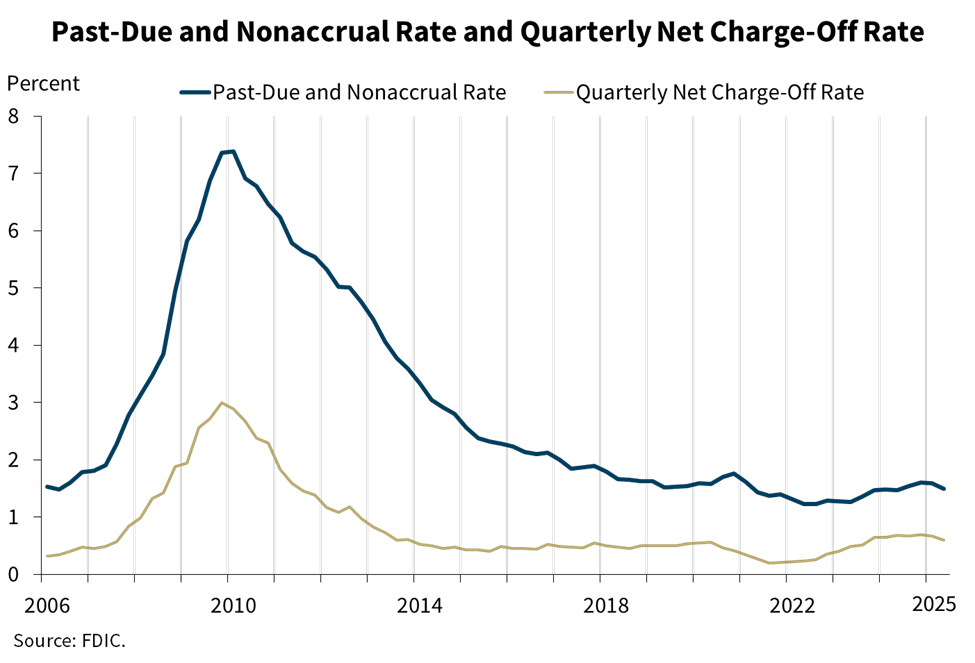
Chart 9 shows that asset quality metrics for the industry remained generally favorable, though weakness in certain portfolios persisted. The overall past-due and nonaccrual (PDNA) rate fell 9 basis points from the prior quarter to 1.50 percent, below the pre-pandemic average rate of 1.94 percent.3 While banks reported quarterly decreases in most portfolios, the PDNA rate for non-owner-occupied CRE, multifamily CRE, and credit card portfolios remain well above their pre-pandemic averages.
The industry’s quarterly net charge-off rate of 0.6 percent decreased 6 basis points from last quarter and 8 basis points from the year-ago quarter. The industry’s net charge-off rate was 12 basis points higher than the pre-pandemic average of 0.48 percent. Credit card loans, auto loans, and other consumer loans excluding auto loans drove the quarterly decline in the total net charge-off rate. Most portfolios continue to have net charge-off rates above their pre-pandemic averages.
Chart 10
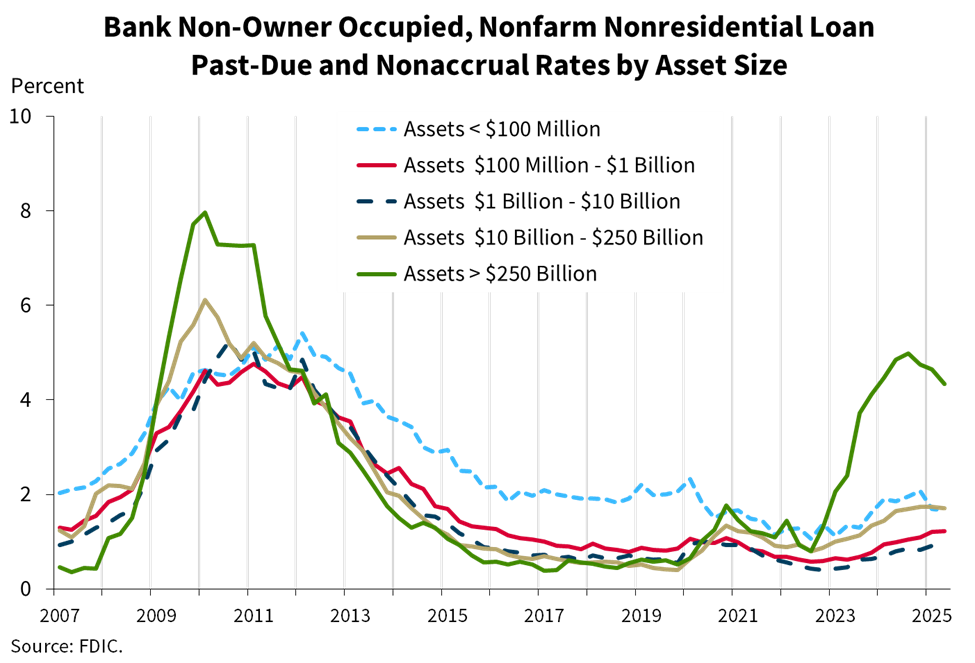
Looking deeper into the CRE portfolio, chart 10 shows that elevated PDNA rates of non-owner-occupied property loans persisted in the second quarter, driven by the portfolios of the larger institutions. Banks with greater than $250 billion in assets reported a non-owner-occupied CRE PDNA rate of 4.33 percent, down from the recent peak of 4.99 percent in third quarter 2024 but well above the pre-pandemic average rate of 0.59 percent. However, these banks have lower concentrations of such loans in relation to total assets and capital than smaller banks, mitigating the overall risk. Overall, the industry’s volume of PDNA non-owner-occupied CRE loans decreased $387.1 million, or 1.6 percent, from the prior quarter.
Chart 11
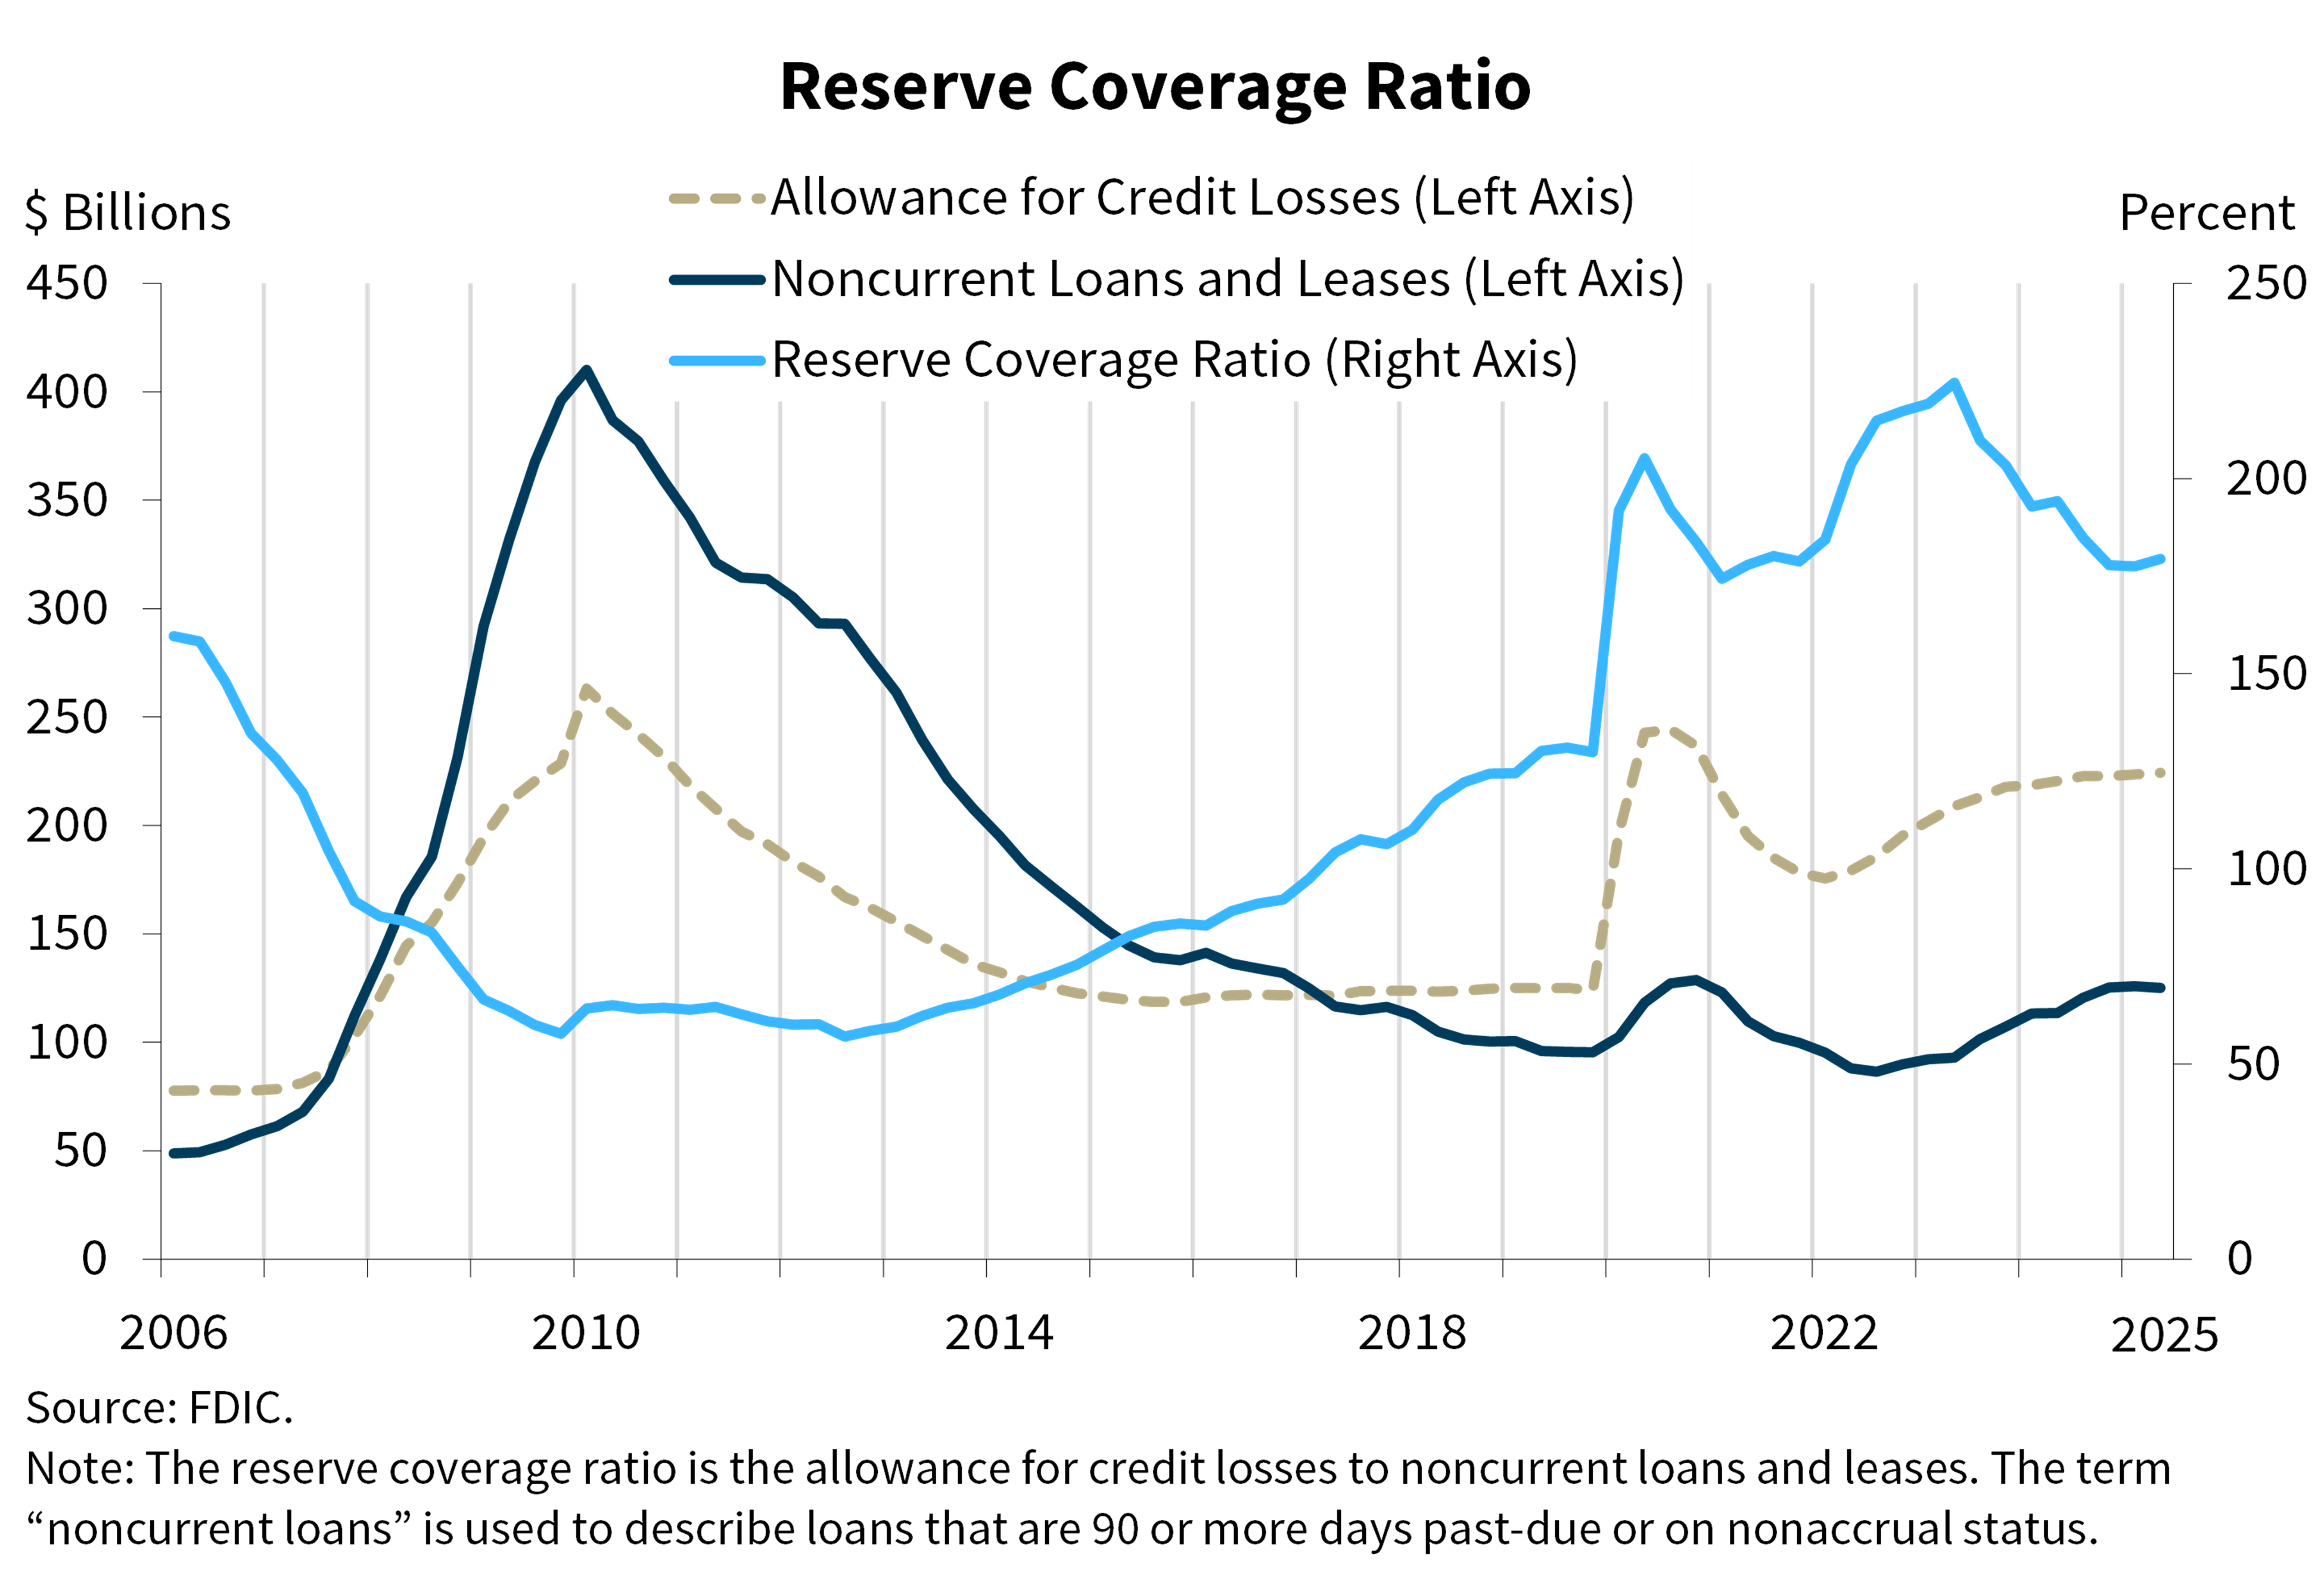
Chart 11 shows that the allowance for credit losses had a modest increase relative to the prior quarter. The ratio of the allowance for credit losses to noncurrent loans increased from 177.6 percent in the first quarter to 179.4 percent in the second quarter and remains well above the pre-pandemic average.
The reserve coverage ratio at community banks declined from 168.7 percent in the first quarter to 163.4 percent in the second quarter as noncurrent loan balances increased faster than the allowance for credit losses. Community banks’ pre-pandemic average reserve coverage ratio was 129.4 percent.
Chart 12
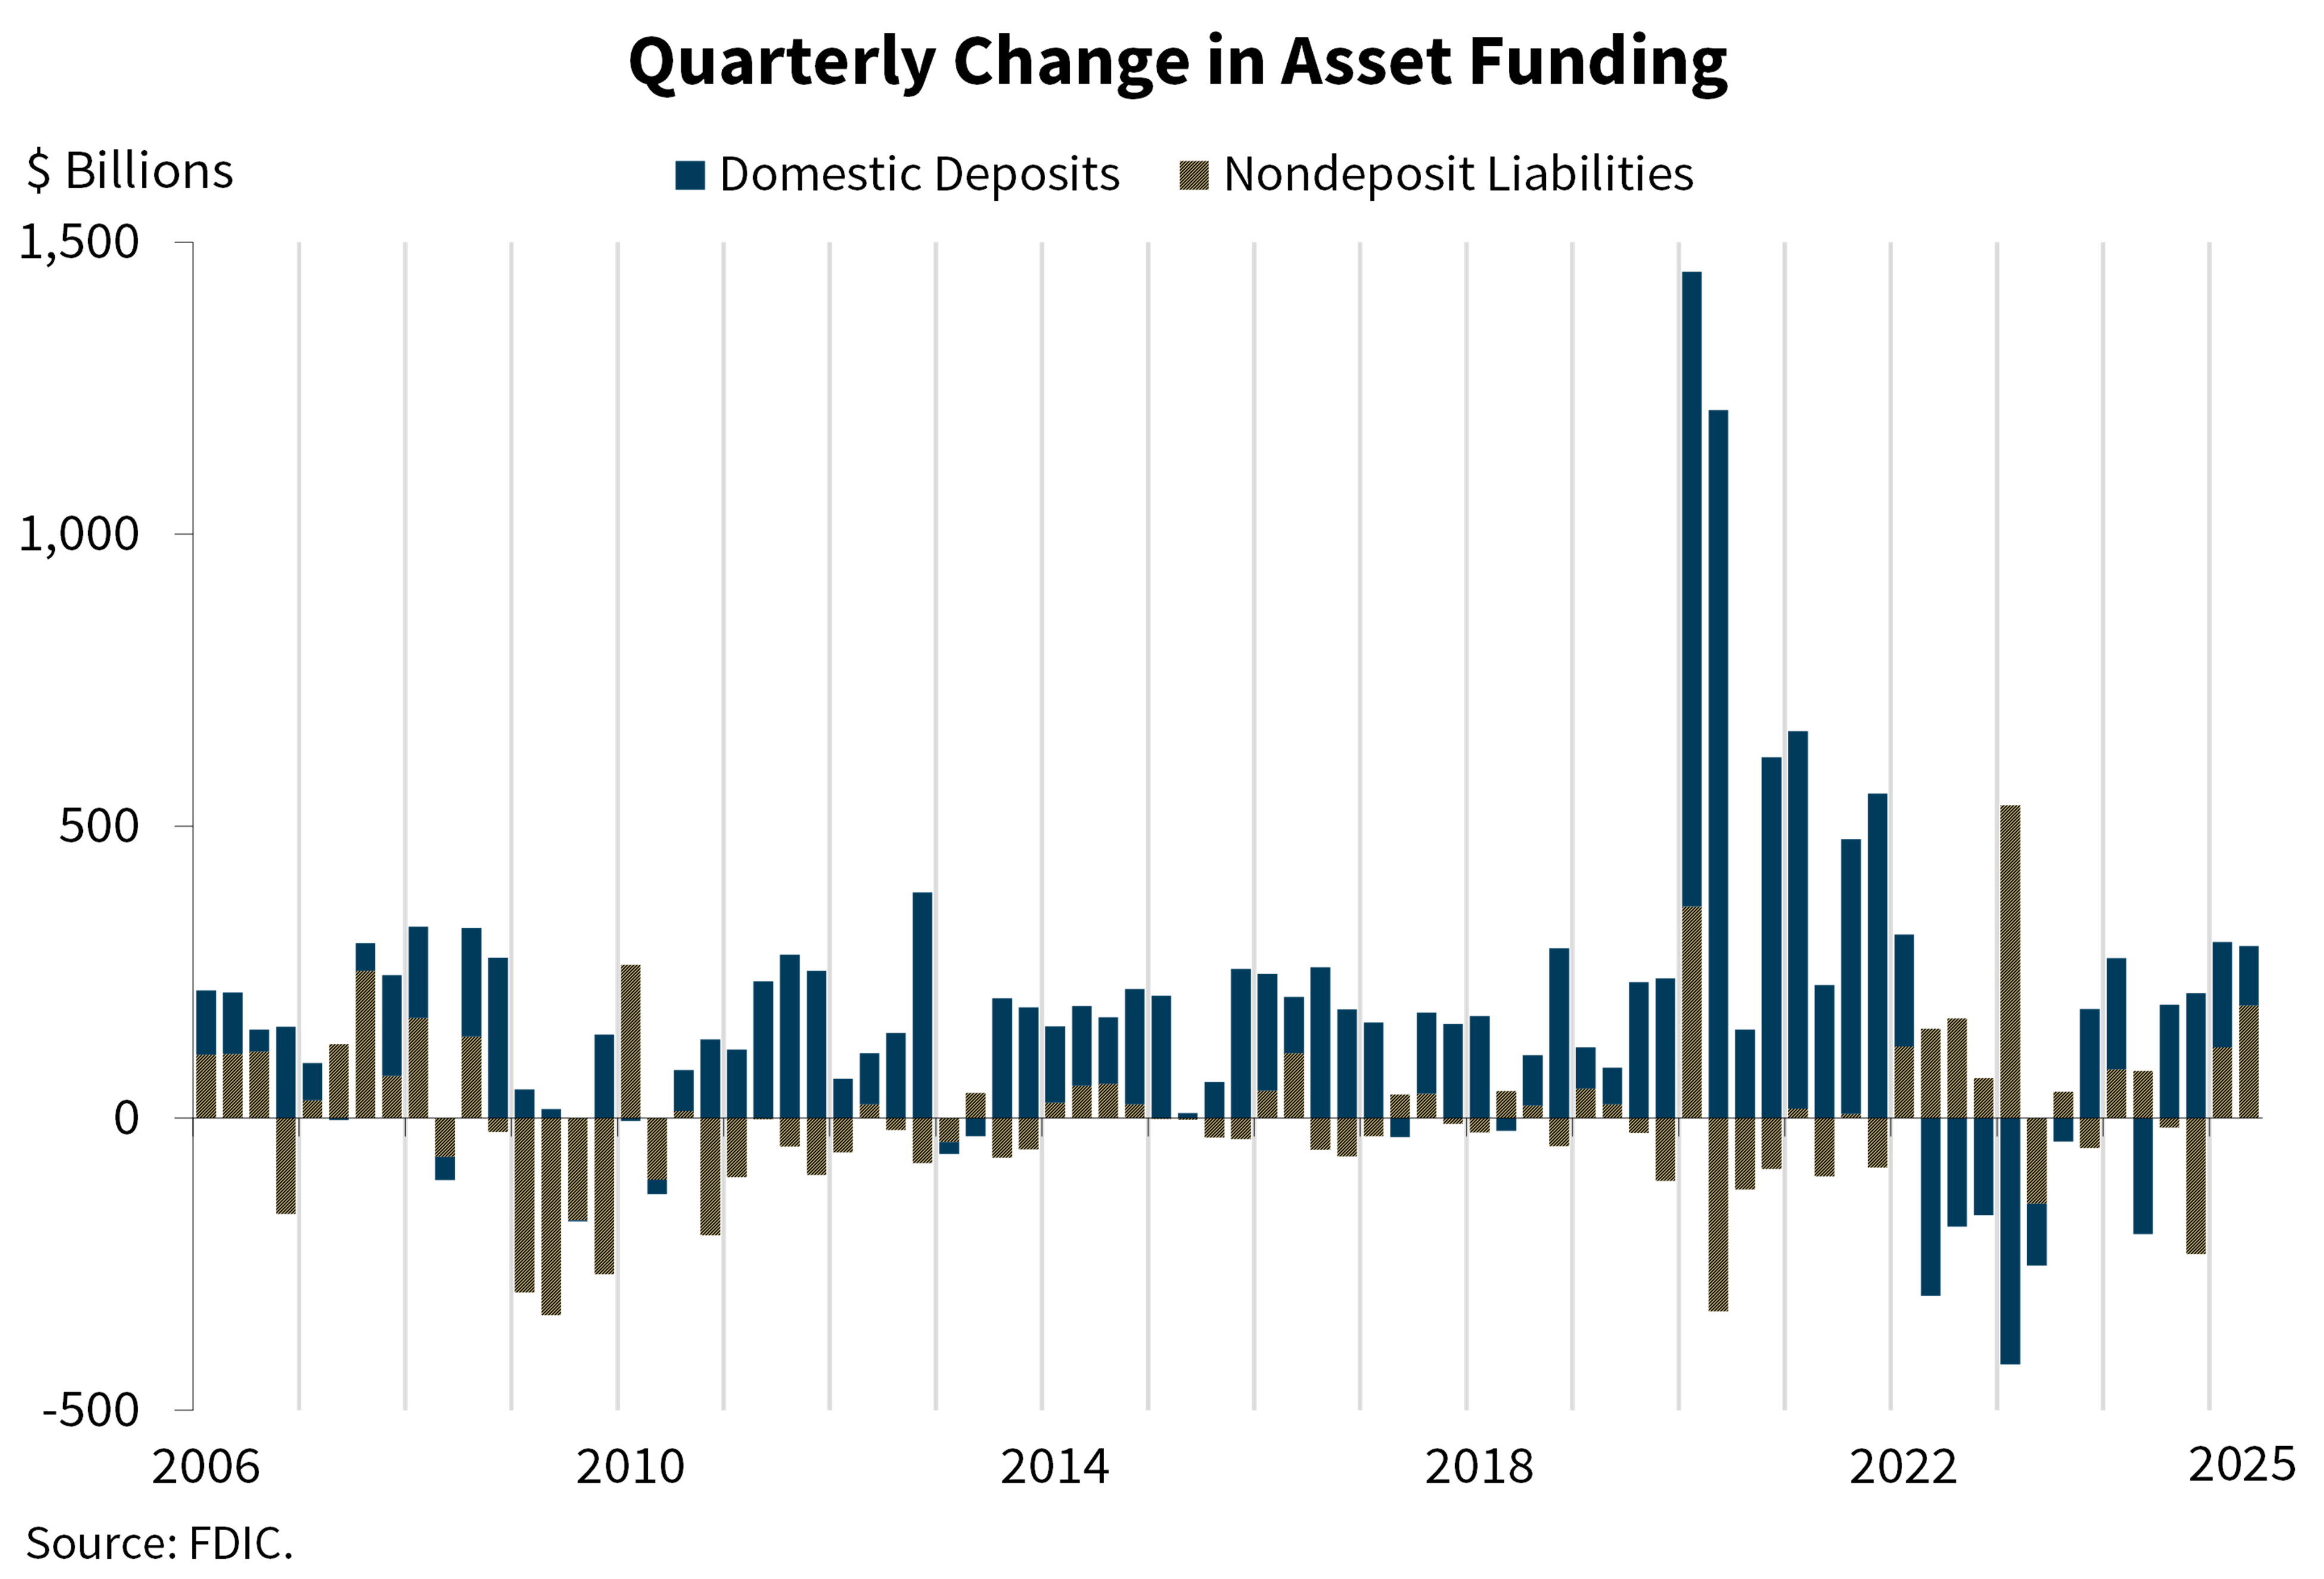
Chart 12 shows that domestic deposits increased for the fourth consecutive quarter, rising $101.5 billion, or 0.6 percent, during the second quarter. Estimated uninsured domestic deposits increased $186.6 billion, offsetting a decline in insured domestic deposits of $87.3 billion, or 0.8 percent, during the quarter. The industry’s nondeposit liabilities increased by $193 billion from the prior quarter, driven by growth in reverse repurchase agreements.
Chart 13
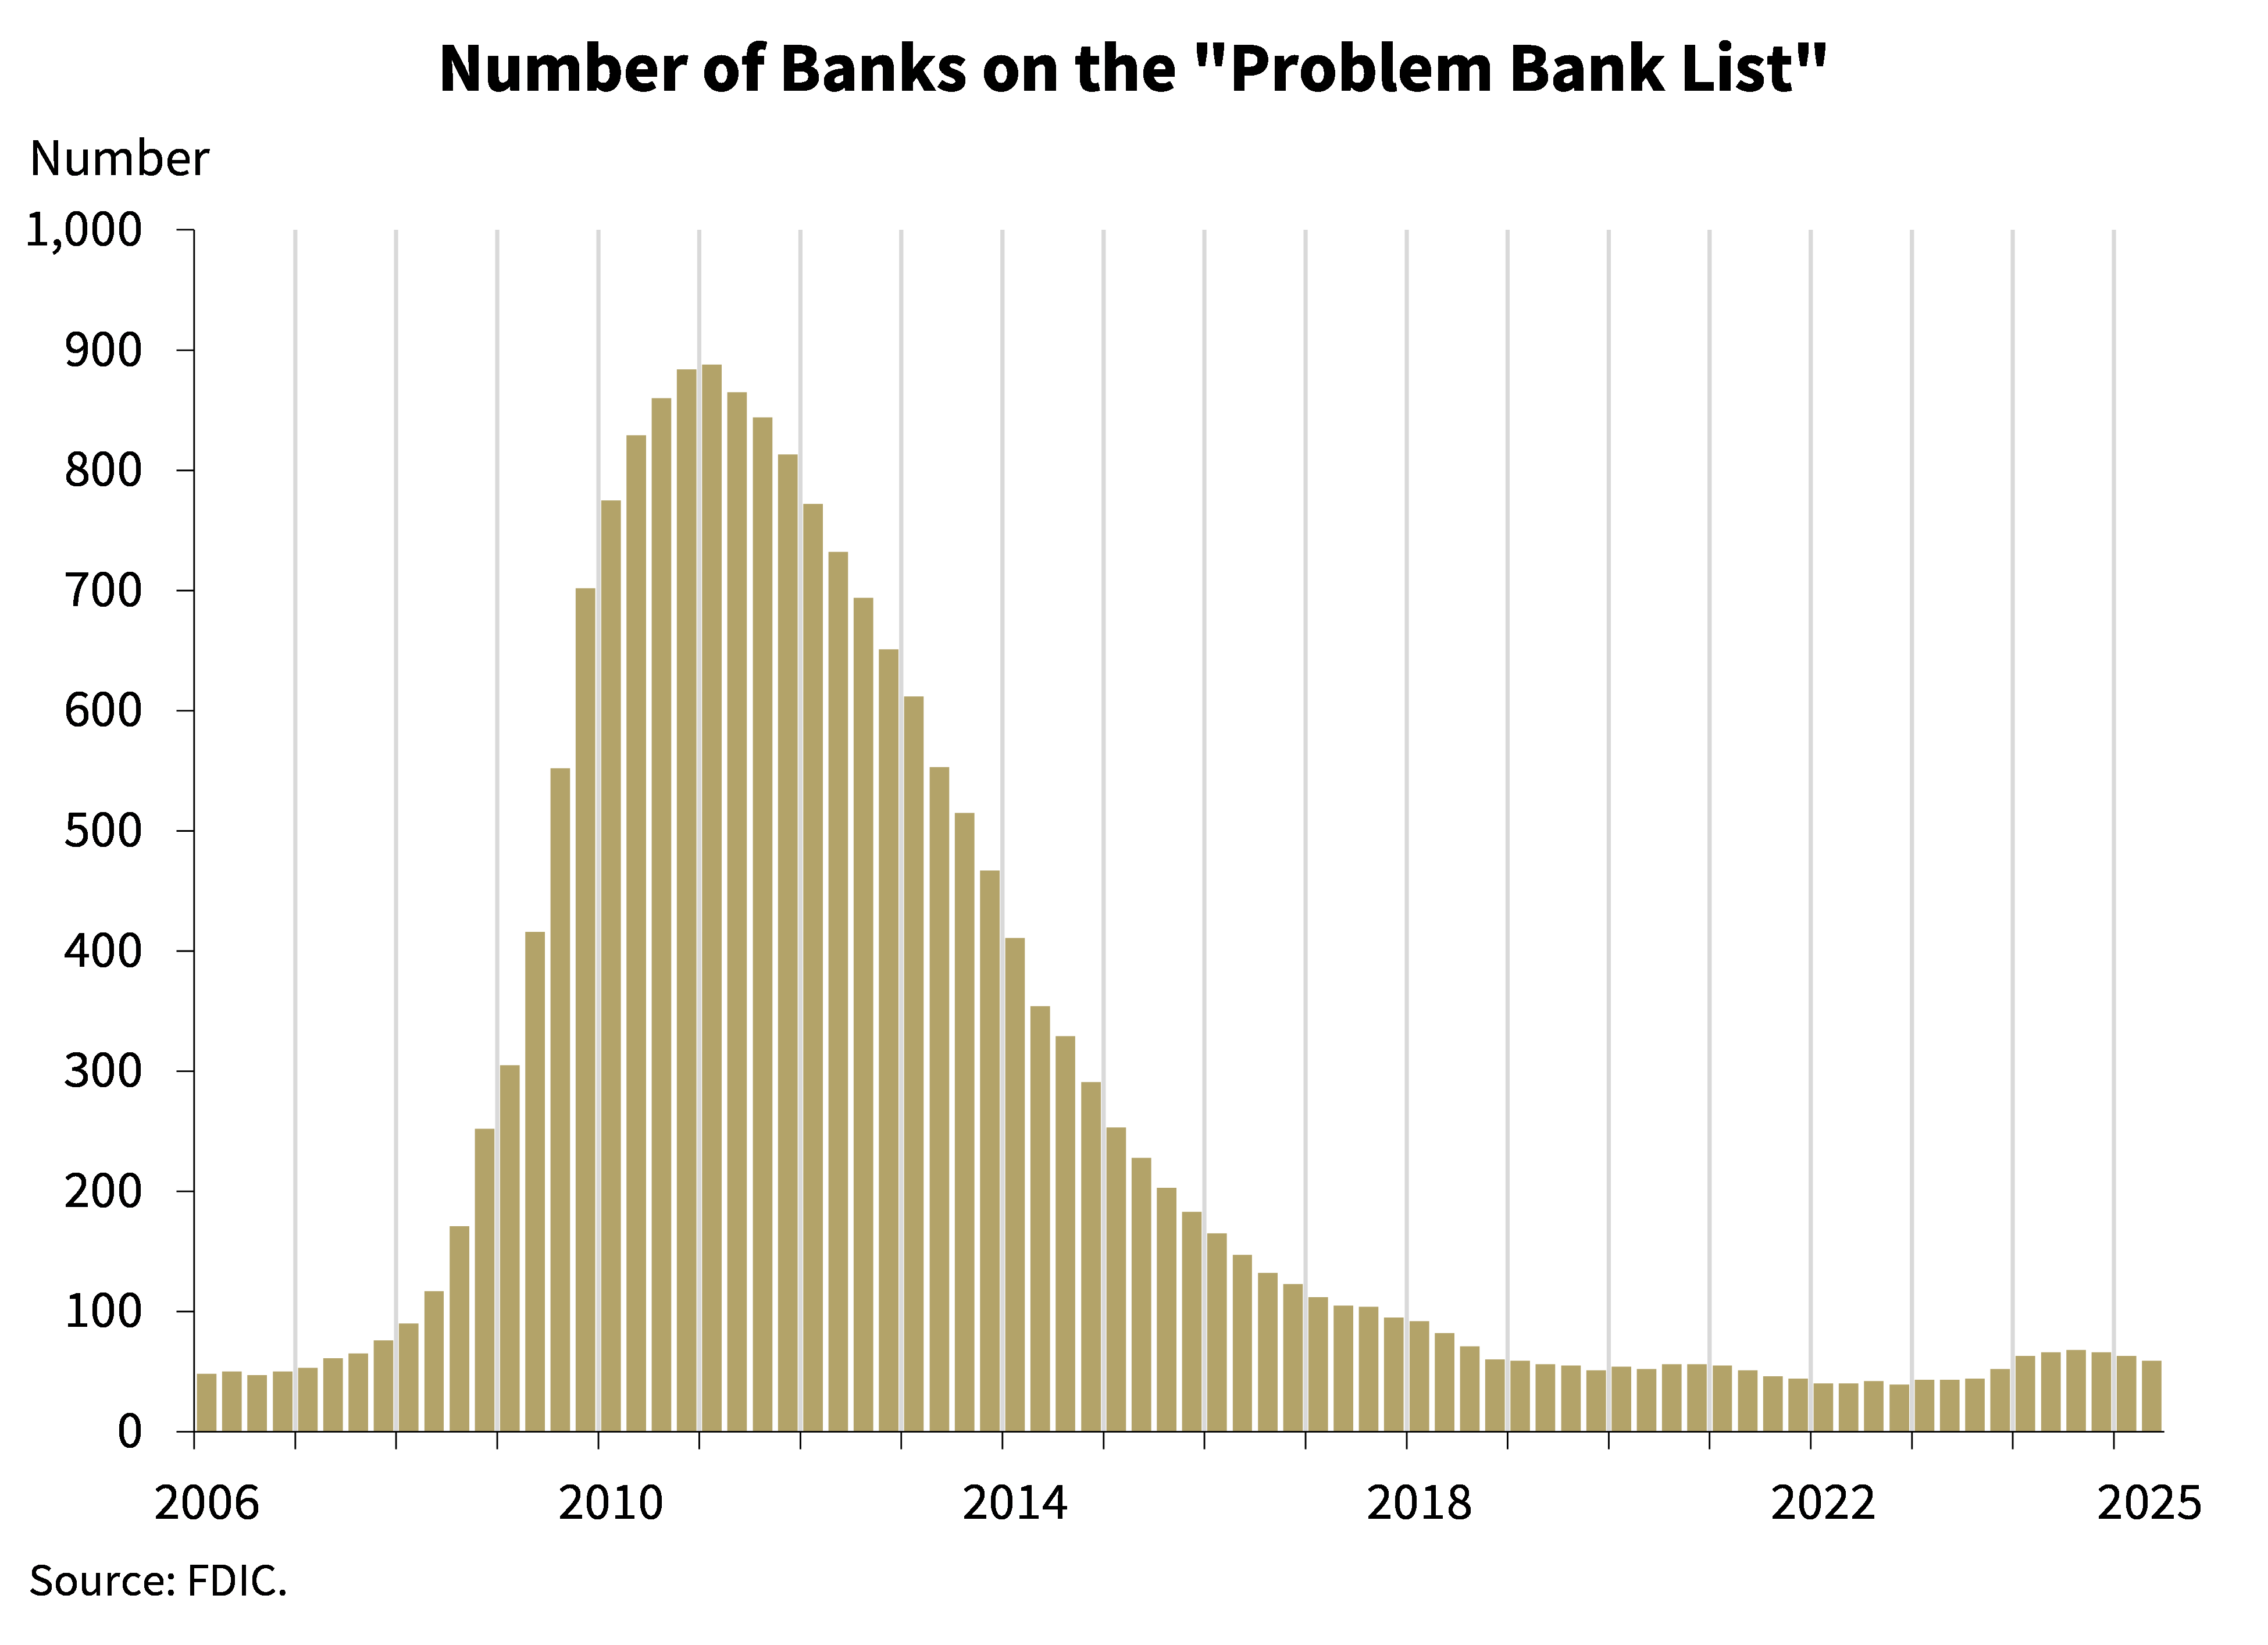
Chart 13 shows the number of banks on the FDIC’s “Problem Bank List.” Banks on this list have a CAMELS composite rating of “4” or “5.” The total number of banks on the list decreased by a net of four in the second quarter to 59 banks. The number of problem banks is 1.3 percent of total banks, which is in the middle of the normal range for non-crisis periods of 1 to 2 percent of all banks. Four banks opened during the second quarter and one failed.
Chart 14
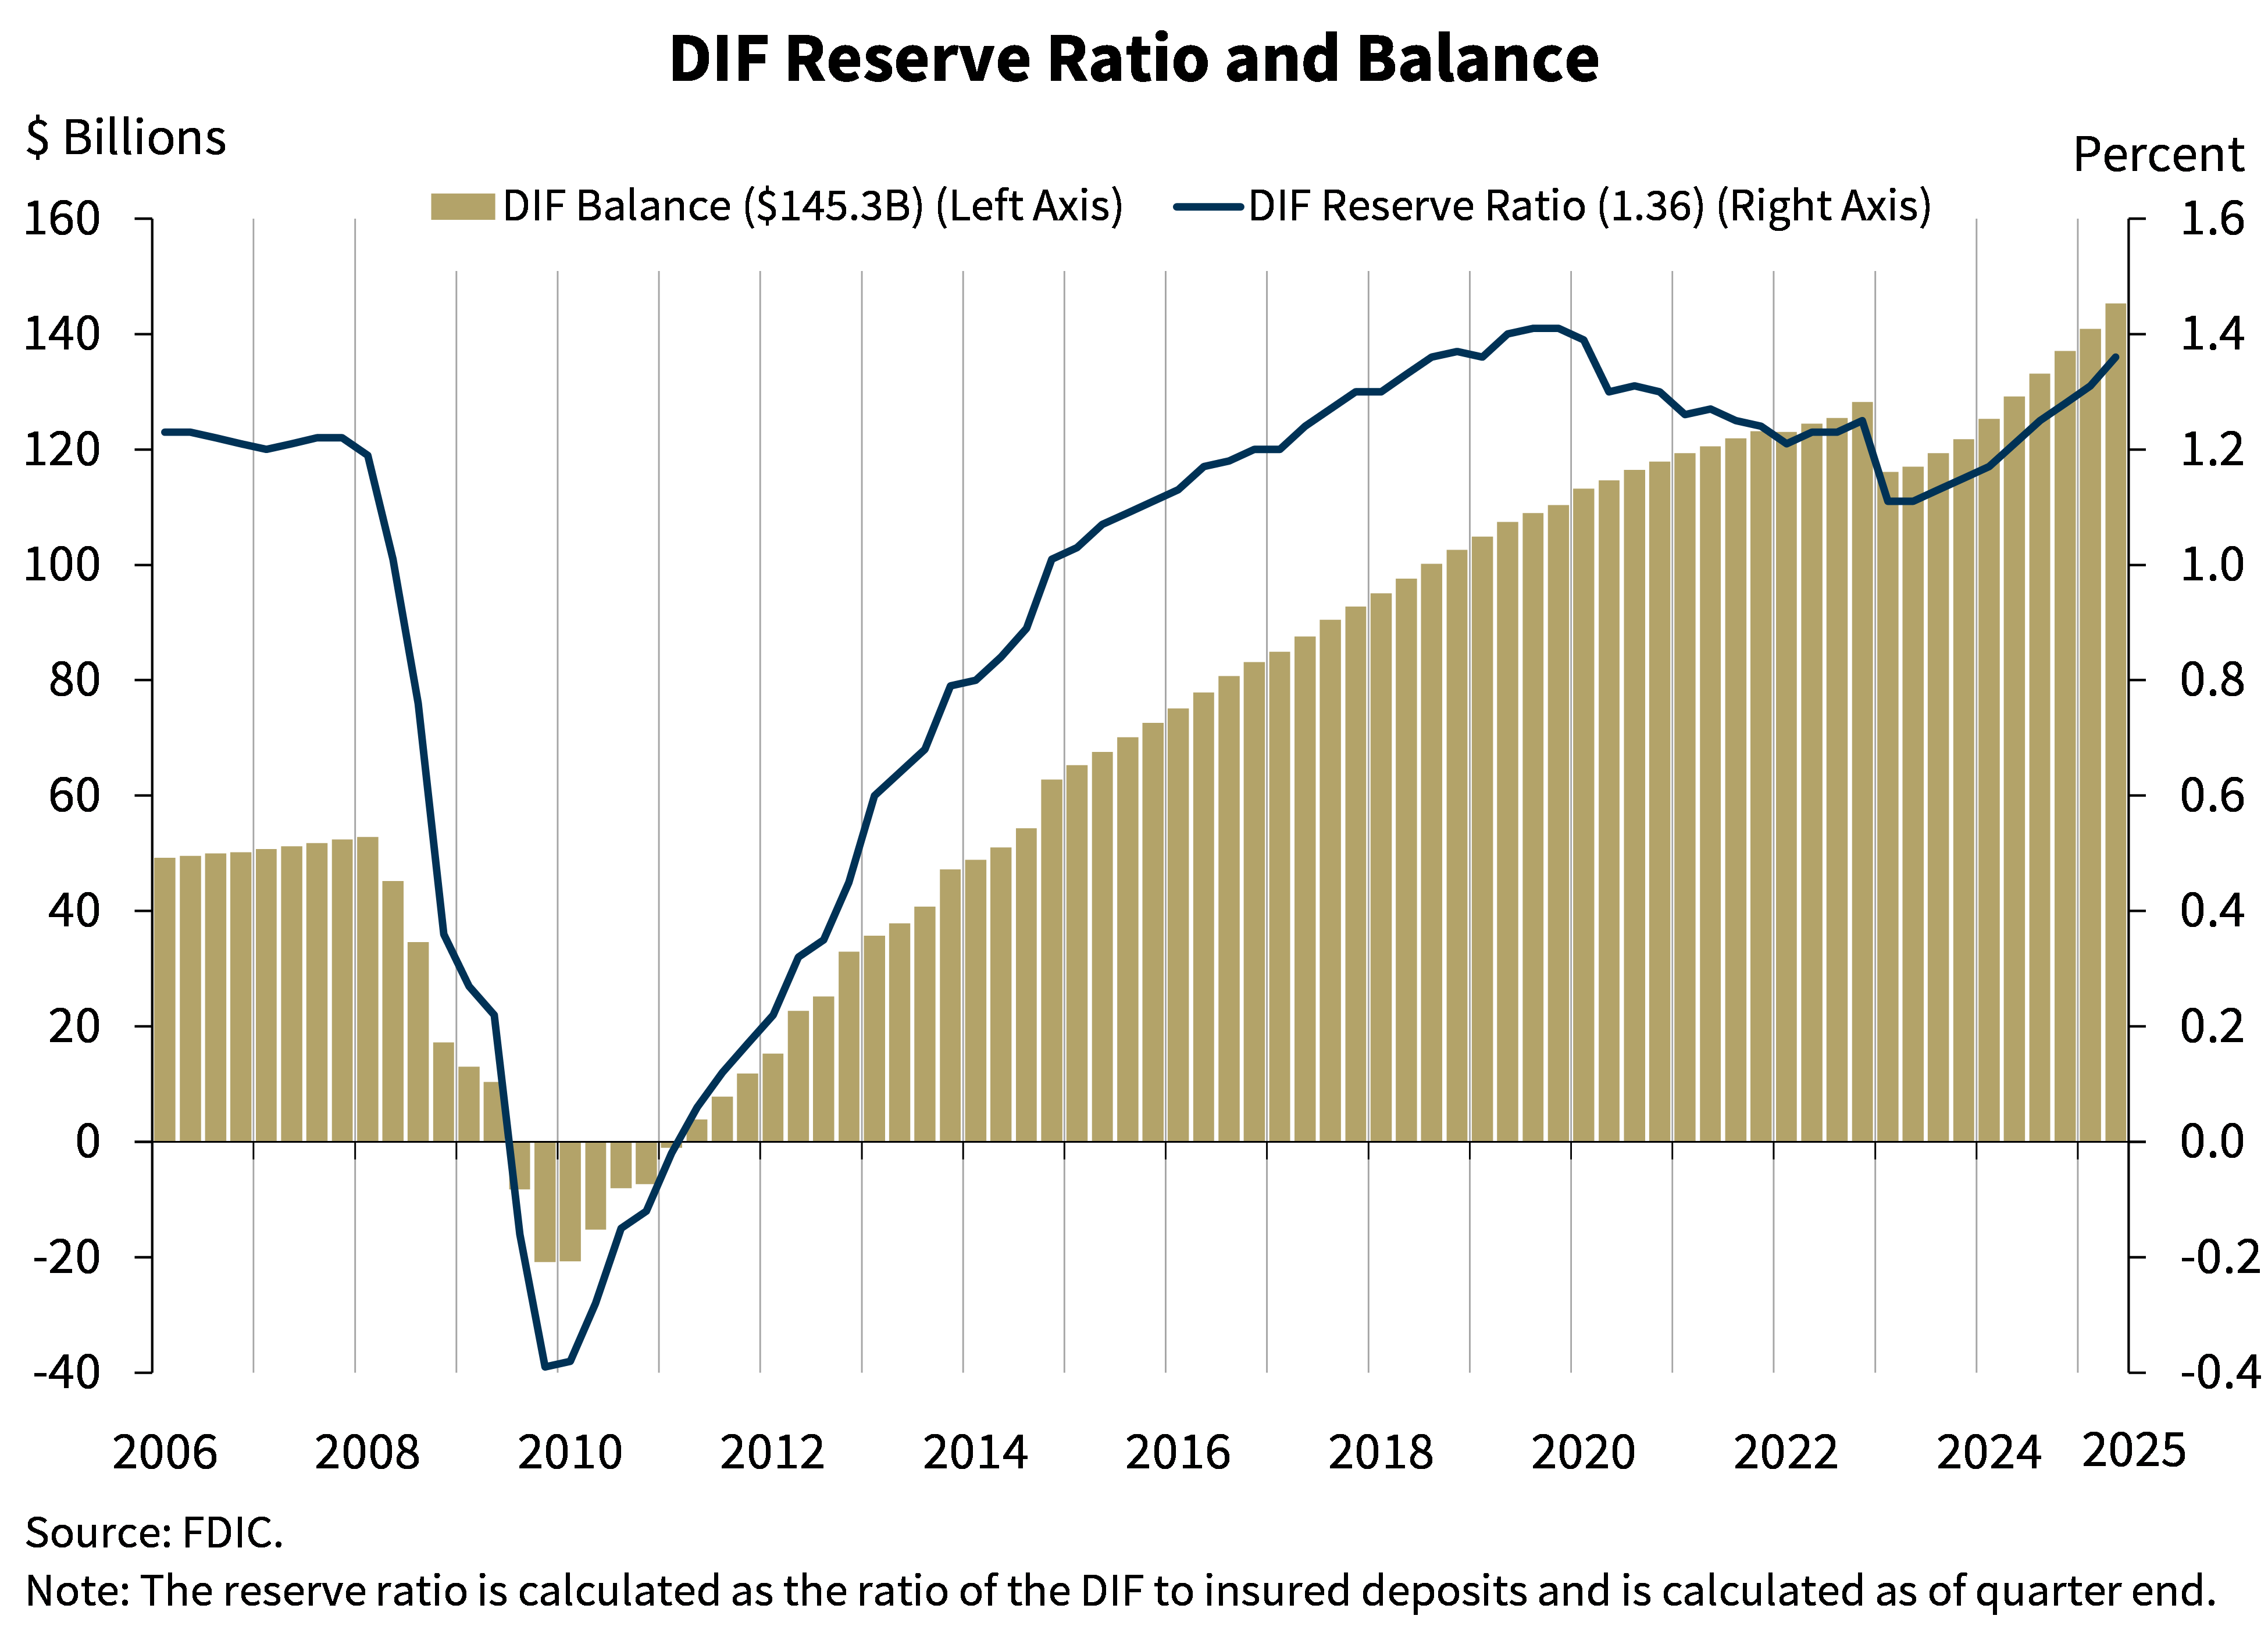
This chart shows that the Deposit Insurance Fund (DIF) balance was $145.3 billion on June 30, 2025, up $4.4 billion from the first quarter.4 Assessment revenue continued to be the primary driver of the increase, adding $3.6 billion to the DIF balance. Interest earned on investment securities, negative provisions for insurance losses, and unrealized gains on securities also contributed a combined $1.4 billion to the fund, partially offset by operating expenses of $630 million.
Insured deposits decreased by 0.8 percent during the second quarter, while year-over-year insured deposit growth was 0.6 percent. The reserve ratio increased by 5 basis points in the second quarter to 1.36 percent and was 15 basis points higher than a year earlier.
The FDIC adopted a DIF Restoration Plan on September 15, 2020, to return the reserve ratio to the statutory minimum of 1.35 percent by September 30, 2028, as required by law. As of June 30, 2025, the reserve ratio exceeded the statutory minimum and, beginning with third quarter 2025, the FDIC will no longer be operating under a Restoration Plan.
In conclusion, the banking industry continued to show strength in second quarter 2025. However, the industry still faces weakness in certain loan portfolios, economic uncertainty, and elevated unrealized losses. These issues will remain matters of ongoing supervisory attention by the FDIC.
| 1 | https://www.fdic.gov/quarterly-banking-profile/quarterly-banking-profile-q2-2025#charts-and-data |
| 2 | The “pre-pandemic average” is the average from first quarter 2015 through fourth quarter 2019. |
| 3 | In this statement, the terms “past-due and nonaccrual” or “PDNA” are used to describe loans that are 30 or more days past-due or on nonaccrual status. |
| 4 | As in prior quarters, quarterly special assessment payments related to the March 2023 failures of Silicon Valley Bank and Signature Bank do not effect quarterly changes in the DIF balance. |