
Quarterly Banking Profile - Second Quarter 2023
Good morning, and welcome to our release of second quarter 2023 performance results for FDIC-insured institutions.
Despite the period of stress earlier this year, the banking industry continues to be resilient. In the second quarter, key banking industry metrics were favorable. Net income remained high by historical measures, asset quality metrics were stable, and the industry remained well capitalized. But banks reported tightening net interest margins and funding pressures for a second consecutive quarter.
In the second quarter, the banking industry’s net income was $70.8 billion, a decrease of $9.0 billion from last quarter. But after excluding nonrecurring accounting gains on failed bank acquisitions that occurred in the first and second quarters, net income was roughly flat from the prior quarter—and in fact from fourth quarter 2022 as well. This adjusted level of net income remains relatively high by historical measures and was 5.7 percent higher than the same quarter one year ago.
For community banks, second quarter net income increased from the prior quarter as higher noninterest income and lower losses on the sale of securities more than offset lower net interest income and higher noninterest expense. Community bank net income also improved relative to a year ago.
The industry’s net interest margin declined for the second straight quarter, though by a lower amount than last quarter. Although the interest rates earned on loans increased more than the rates paid on deposits, the interest rates banks paid on non-deposit liabilities, such as Federal Home Loan Bank advances and borrowings from the Federal Reserve’s Bank Term Funding Program, increased by a larger amount, pushing up the overall cost of funds for the industry. Community banks reported the same increase in deposit costs as the industry but reported a lower increase in loan yields, which contributed to a greater decline in the net interest margin than for the industry.
In the second quarter, total deposits declined for the fifth consecutive quarter. However, deposit outflows moderated substantially from the large outflows reported last quarter when the industry experienced significant stress and two regional banks failed. The level of liquid assets declined in the second quarter through a combination of greater pledging of securities and a decline in liquid assets such as cash and securities, though most of the increase in pledging activity was for prudent liquidity contingency planning.
The Deposit Insurance Fund (DIF) balance was $117.0 billion on June 30, up approximately $900 million from the end of the first quarter. The reserve ratio—the fund balance relative to insured deposits—decreased by one basis point to 1.10 percent as insured deposits increased at a rate slightly higher than the DIF balance. Despite the decline in the second quarter, the reserve ratio currently remains on track to reach the 1.35 percent minimum reserve ratio by the statutory deadline of September 2028.
After declining in the prior two quarters, unrealized losses on available-for-sale and held-to-maturity securities increased from the prior quarter to $558.4 billion. Higher market interest rates and mortgage rates caused market values for debt to generally fall during the second quarter, resulting in higher unrealized losses.
Though the U.S. economy has so far remained on solid footing, the banking industry continues to face significant downside risks from the effects of inflation, rising market interest rates, and geopolitical uncertainty. These risks could cause credit quality and profitability to weaken, potentially resulting in a further tightening of loan underwriting, slower loan growth, higher provision expenses, and liquidity constraints. In addition, commercial real estate portfolios face challenges from higher interest rates when loans mature, and office properties are experiencing weak demand for space and softening property values. These issues, together with funding and earnings pressures, will continue to be matters of supervisory attention by the FDIC.
Chart 1:
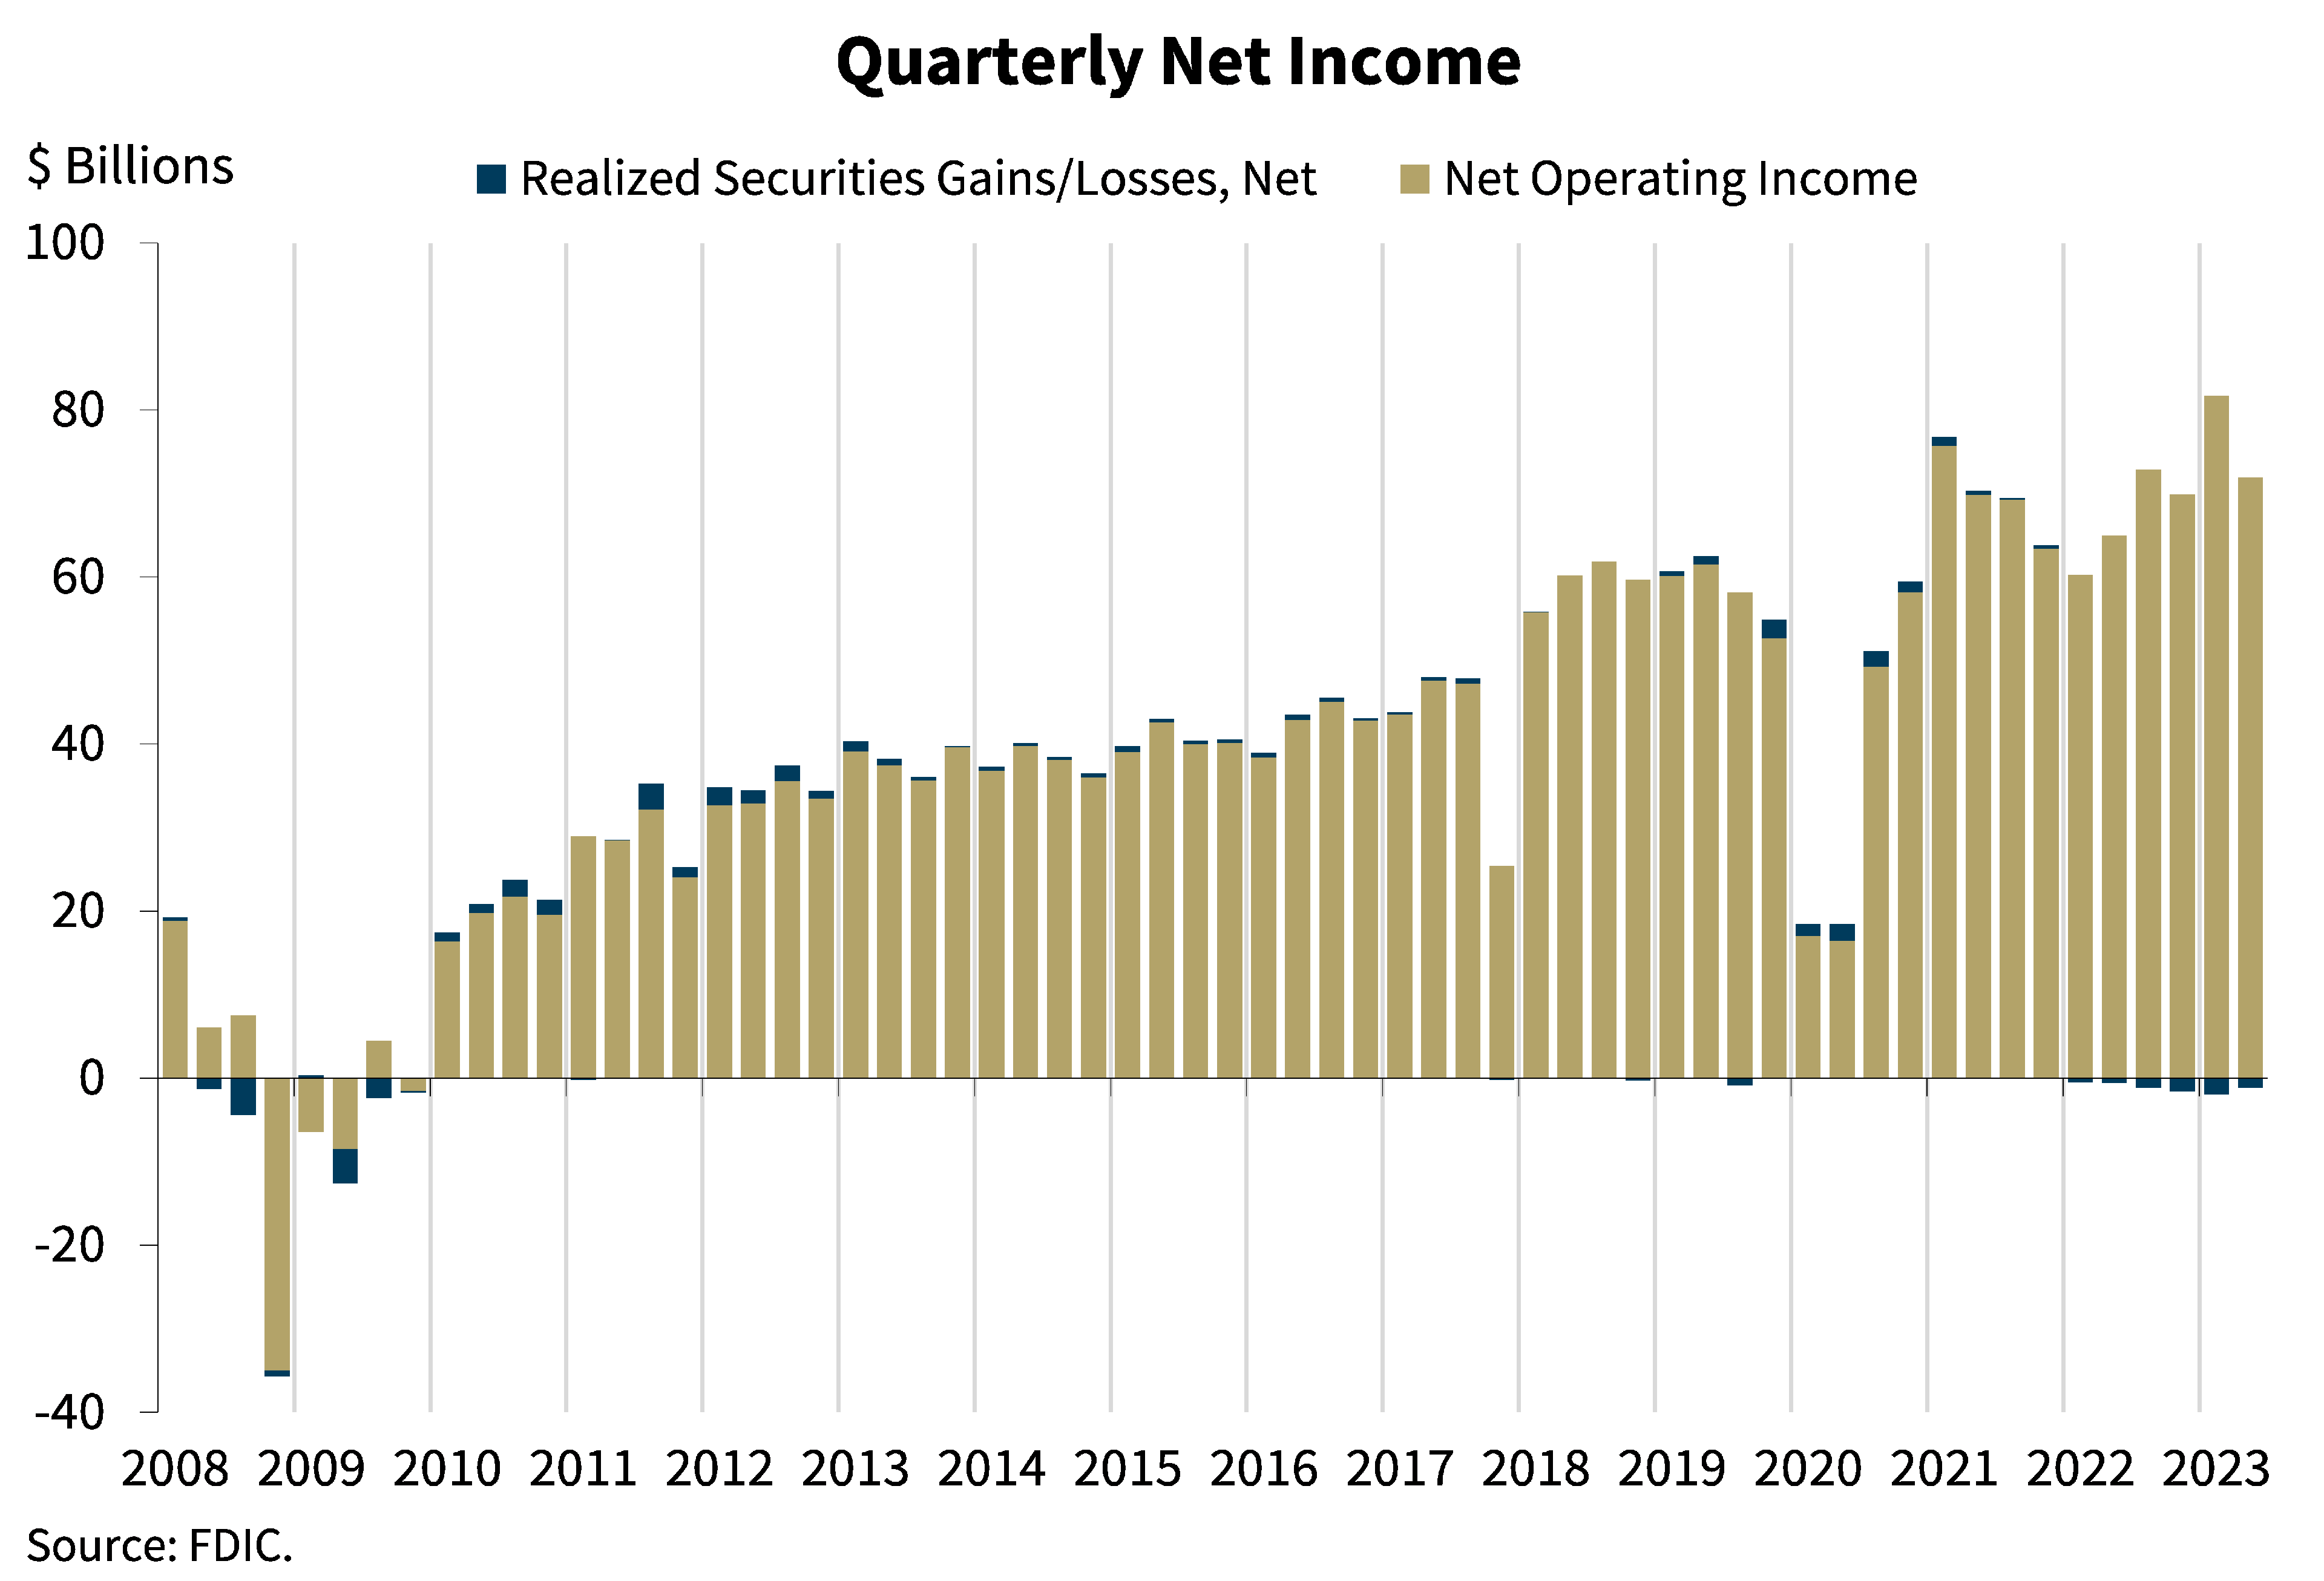
As shown in this chart, the banking industry reported net income of $70.8 billion in the second quarter, down $9.0 billion (or 11.3 percent) from the prior quarter. The decline is largely attributable to lower noninterest income, reflecting the accounting treatment of the acquisitions of two failed institutions that increased net income by $11.8 billion in the first quarter and one failed institution that increased net income by $2.7 billion this quarter. As I mentioned earlier, industry net income would have been roughly flat quarter-over-quarter—and in fact with fourth quarter 2022 as well—if not for the accounting gains from these three failed bank acquisitions. The industry also reported lower net interest income and higher provision expenses compared to last quarter.
Community banks reported an increase of 3.4 percent in net income from last quarter, as higher noninterest income and lower losses on the sale of securities more than offset lower net interest income and higher noninterest expense.
Chart 2:
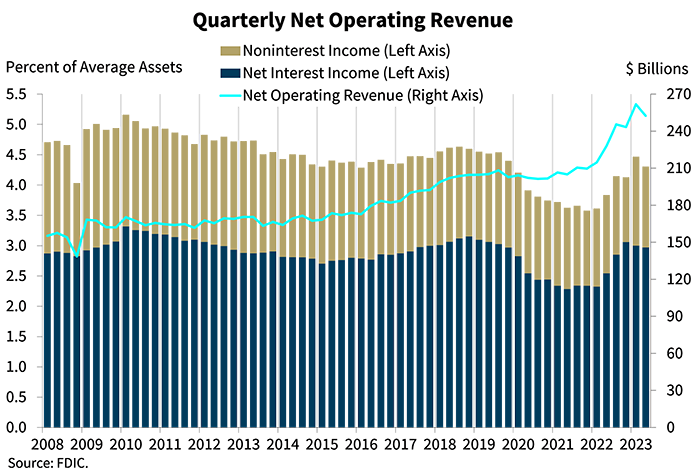
Our next chart shows that quarterly net operating revenue fell 3.5 percent from first quarter 2023 to $252.5 billion. Net interest income as a percentage of average assets declined for the second consecutive quarter, but still exceeds the pre-pandemic average.1 Noninterest income decreased by $7.8 billion, or 9.1 percent, from first quarter 2023. Excluding the accounting gains from the acquisition of the failed banks in the last two quarters, noninterest income would have increased by $1.3 billion on a quarterly basis.
Chart 3:
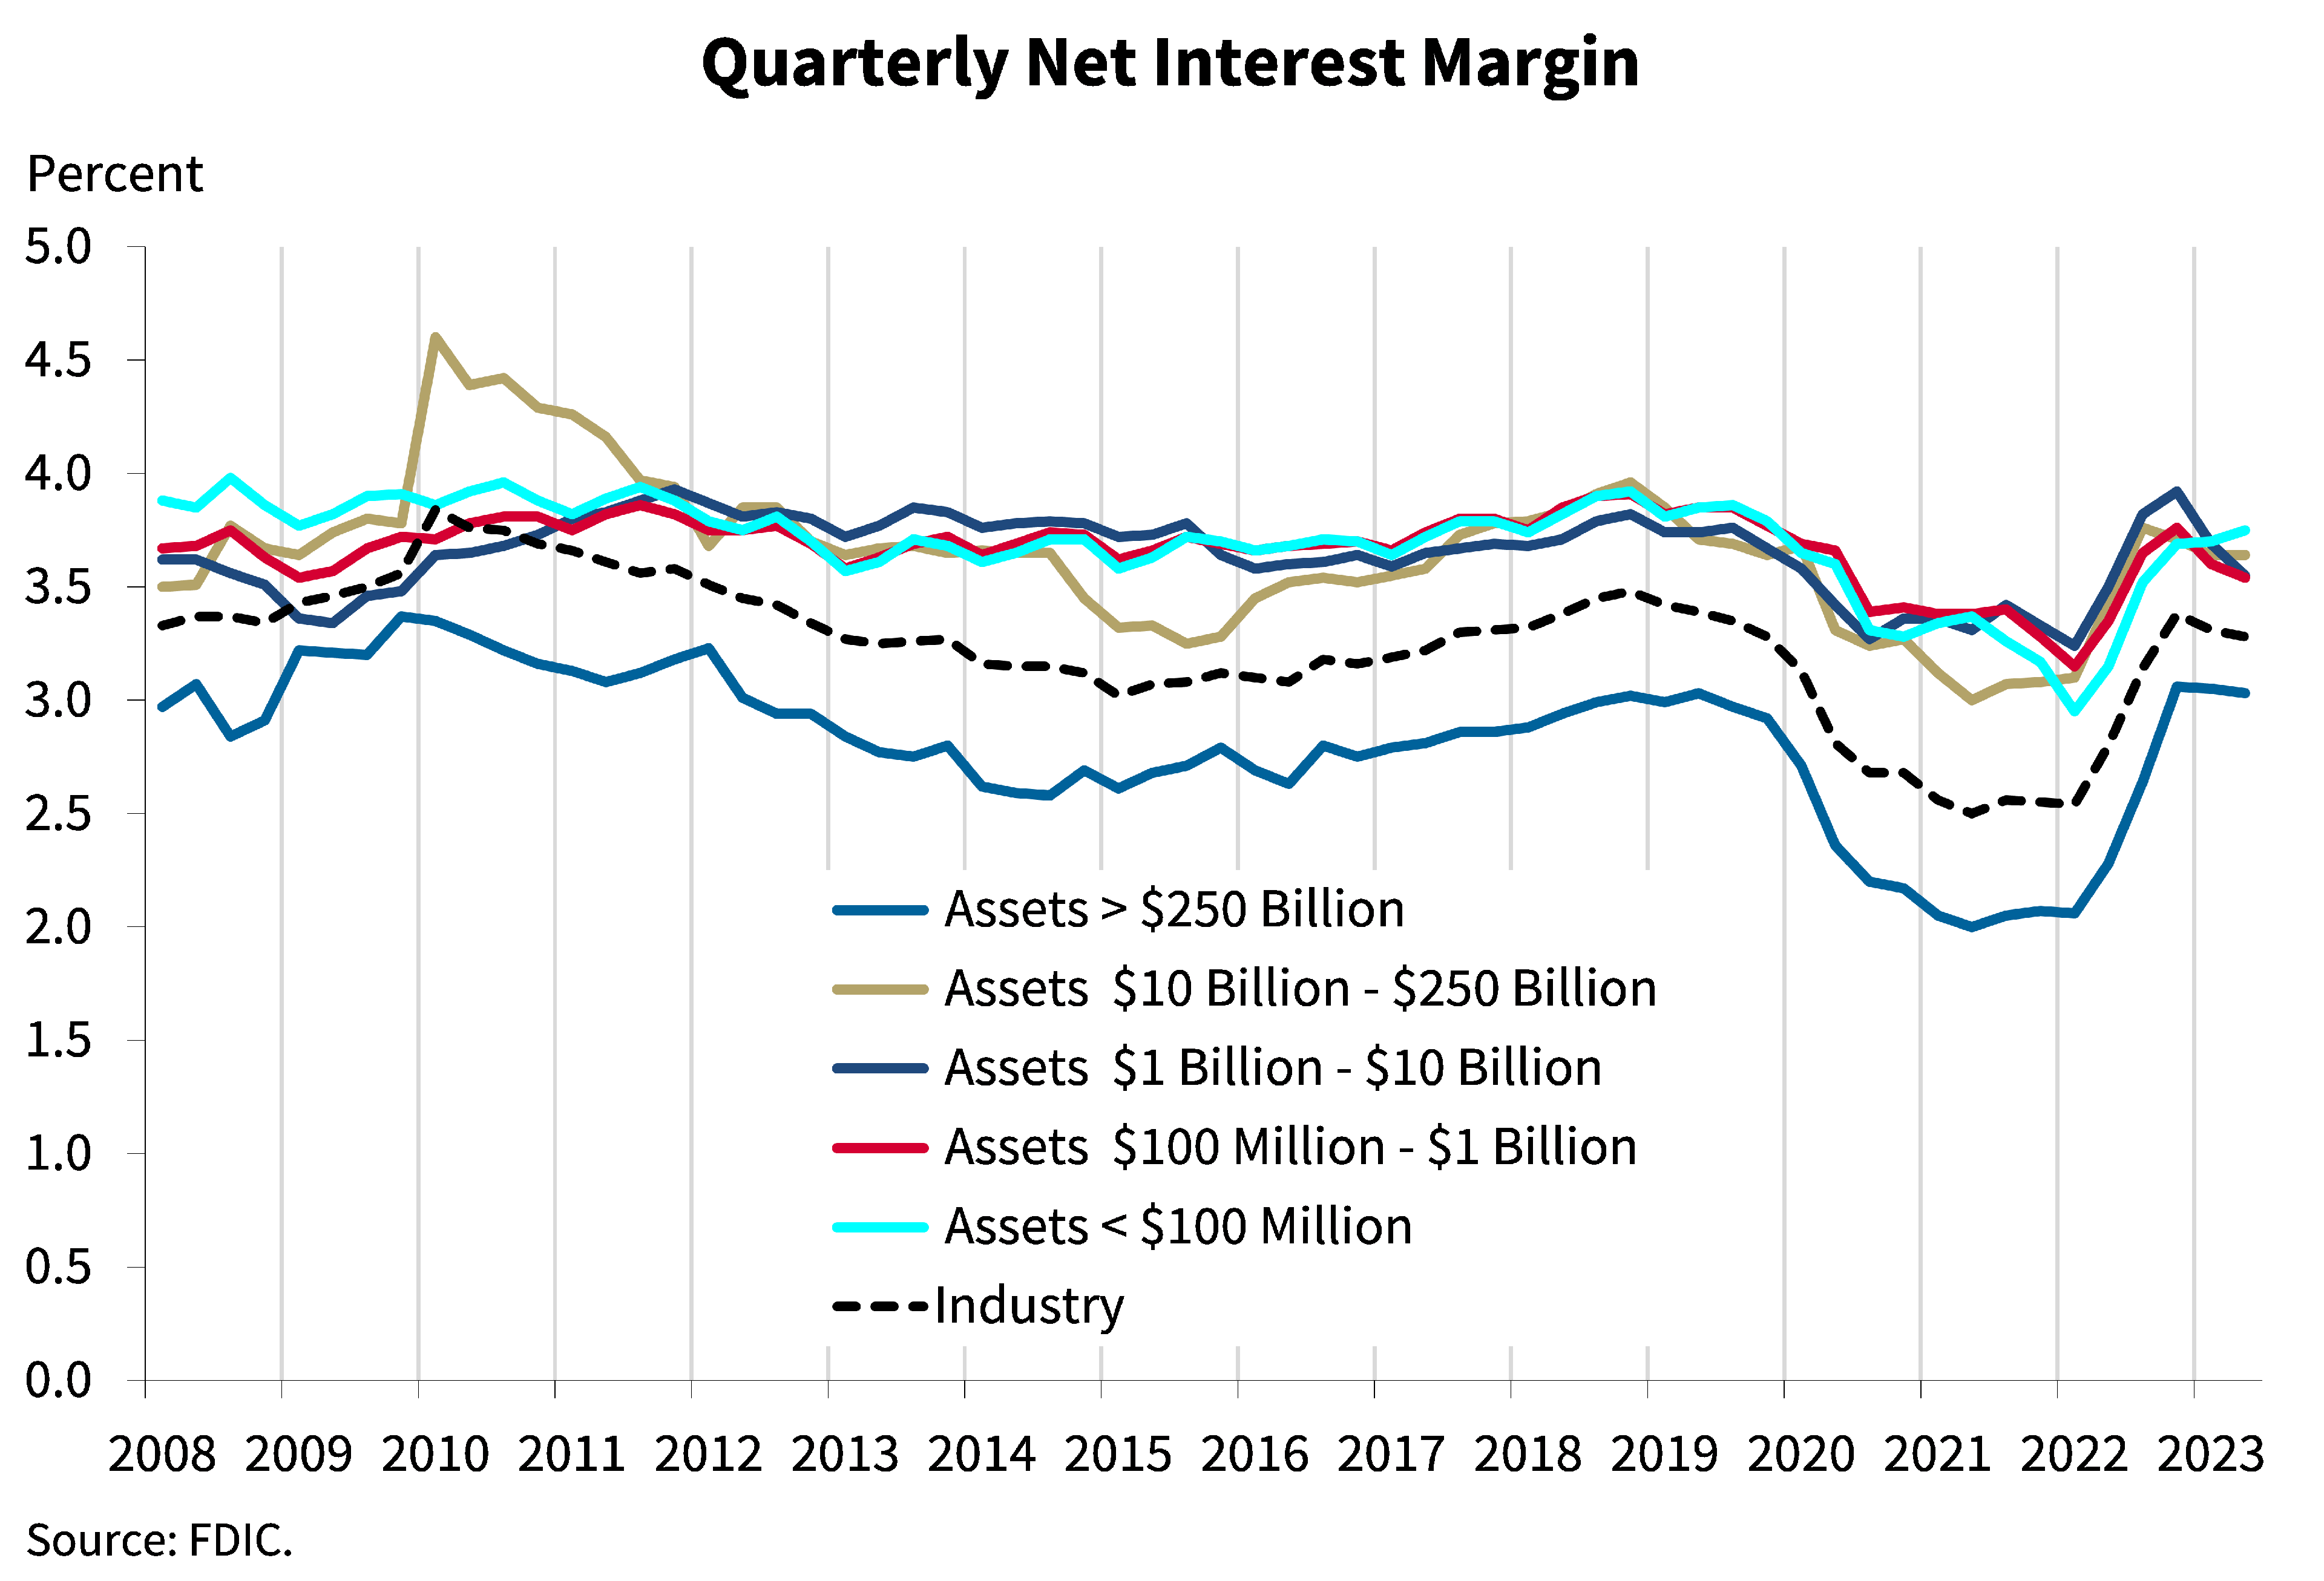
The next chart shows the net interest margin for the industry and the five asset size groups on which the Quarterly Banking Profile reports. The industry’s net interest margin declined for the second consecutive quarter. Though the net interest margin declined three basis points from last quarter to 3.28 percent, it still remains above the pre-pandemic average of 3.25 percent. The decline in the industry’s net interest margin reflects funding costs, particularly the cost of non-deposit liabilities such as borrowings, rising at a faster rate than yields on earning assets over the quarter.
While community banks continue to report higher net interest margins than the overall industry, the net interest margin for community banks also declined in the second quarter, and by a greater amount than for the industry as a whole. The net interest margin at community banks fell 10 basis points from the first quarter to 3.39 percent, largely because loan yields did not keep pace with deposit costs.
Chart 4:

The next chart shows the quarter-over-quarter changes in the industry’s yield on loans and cost of deposits. Both loan yields, the interest banks charge on loans, and deposit costs, the interest banks pay on deposits, began to increase in the second quarter of 2022 when market interest rates began to increase rapidly. Loan yields increased significantly more than deposit costs between second quarter 2022 and fourth quarter 2022. This trend reversed in the first quarter, as the banking industry reported a sizeable shift from lower-yielding accounts such as transaction and savings accounts into higher-yielding time deposits. Though the trend of depositors seeking higher yields continued in the second quarter—which can be seen in deposit costs rising by 36 basis points—loan yields more than kept pace as they increased by 39 basis points.
As I indicated earlier, the reason for the decline in the industry’s net interest margin is that the cost of non-deposit liabilities, such as Federal Home Loan Bank advances and borrowings from the Bank Term Funding Program, increased significantly in the second quarter. The cost of non-deposit liabilities rose by 87 basis points to 4.0 percent, driving the industry’s cost of funds to exceed the yield on earning assets.
Community banks reported the same 36 basis-point increase in deposit costs as the industry in the second quarter, but their loan yields only increased by 28 basis points, putting downward pressure on net interest margins.
Chart 5:
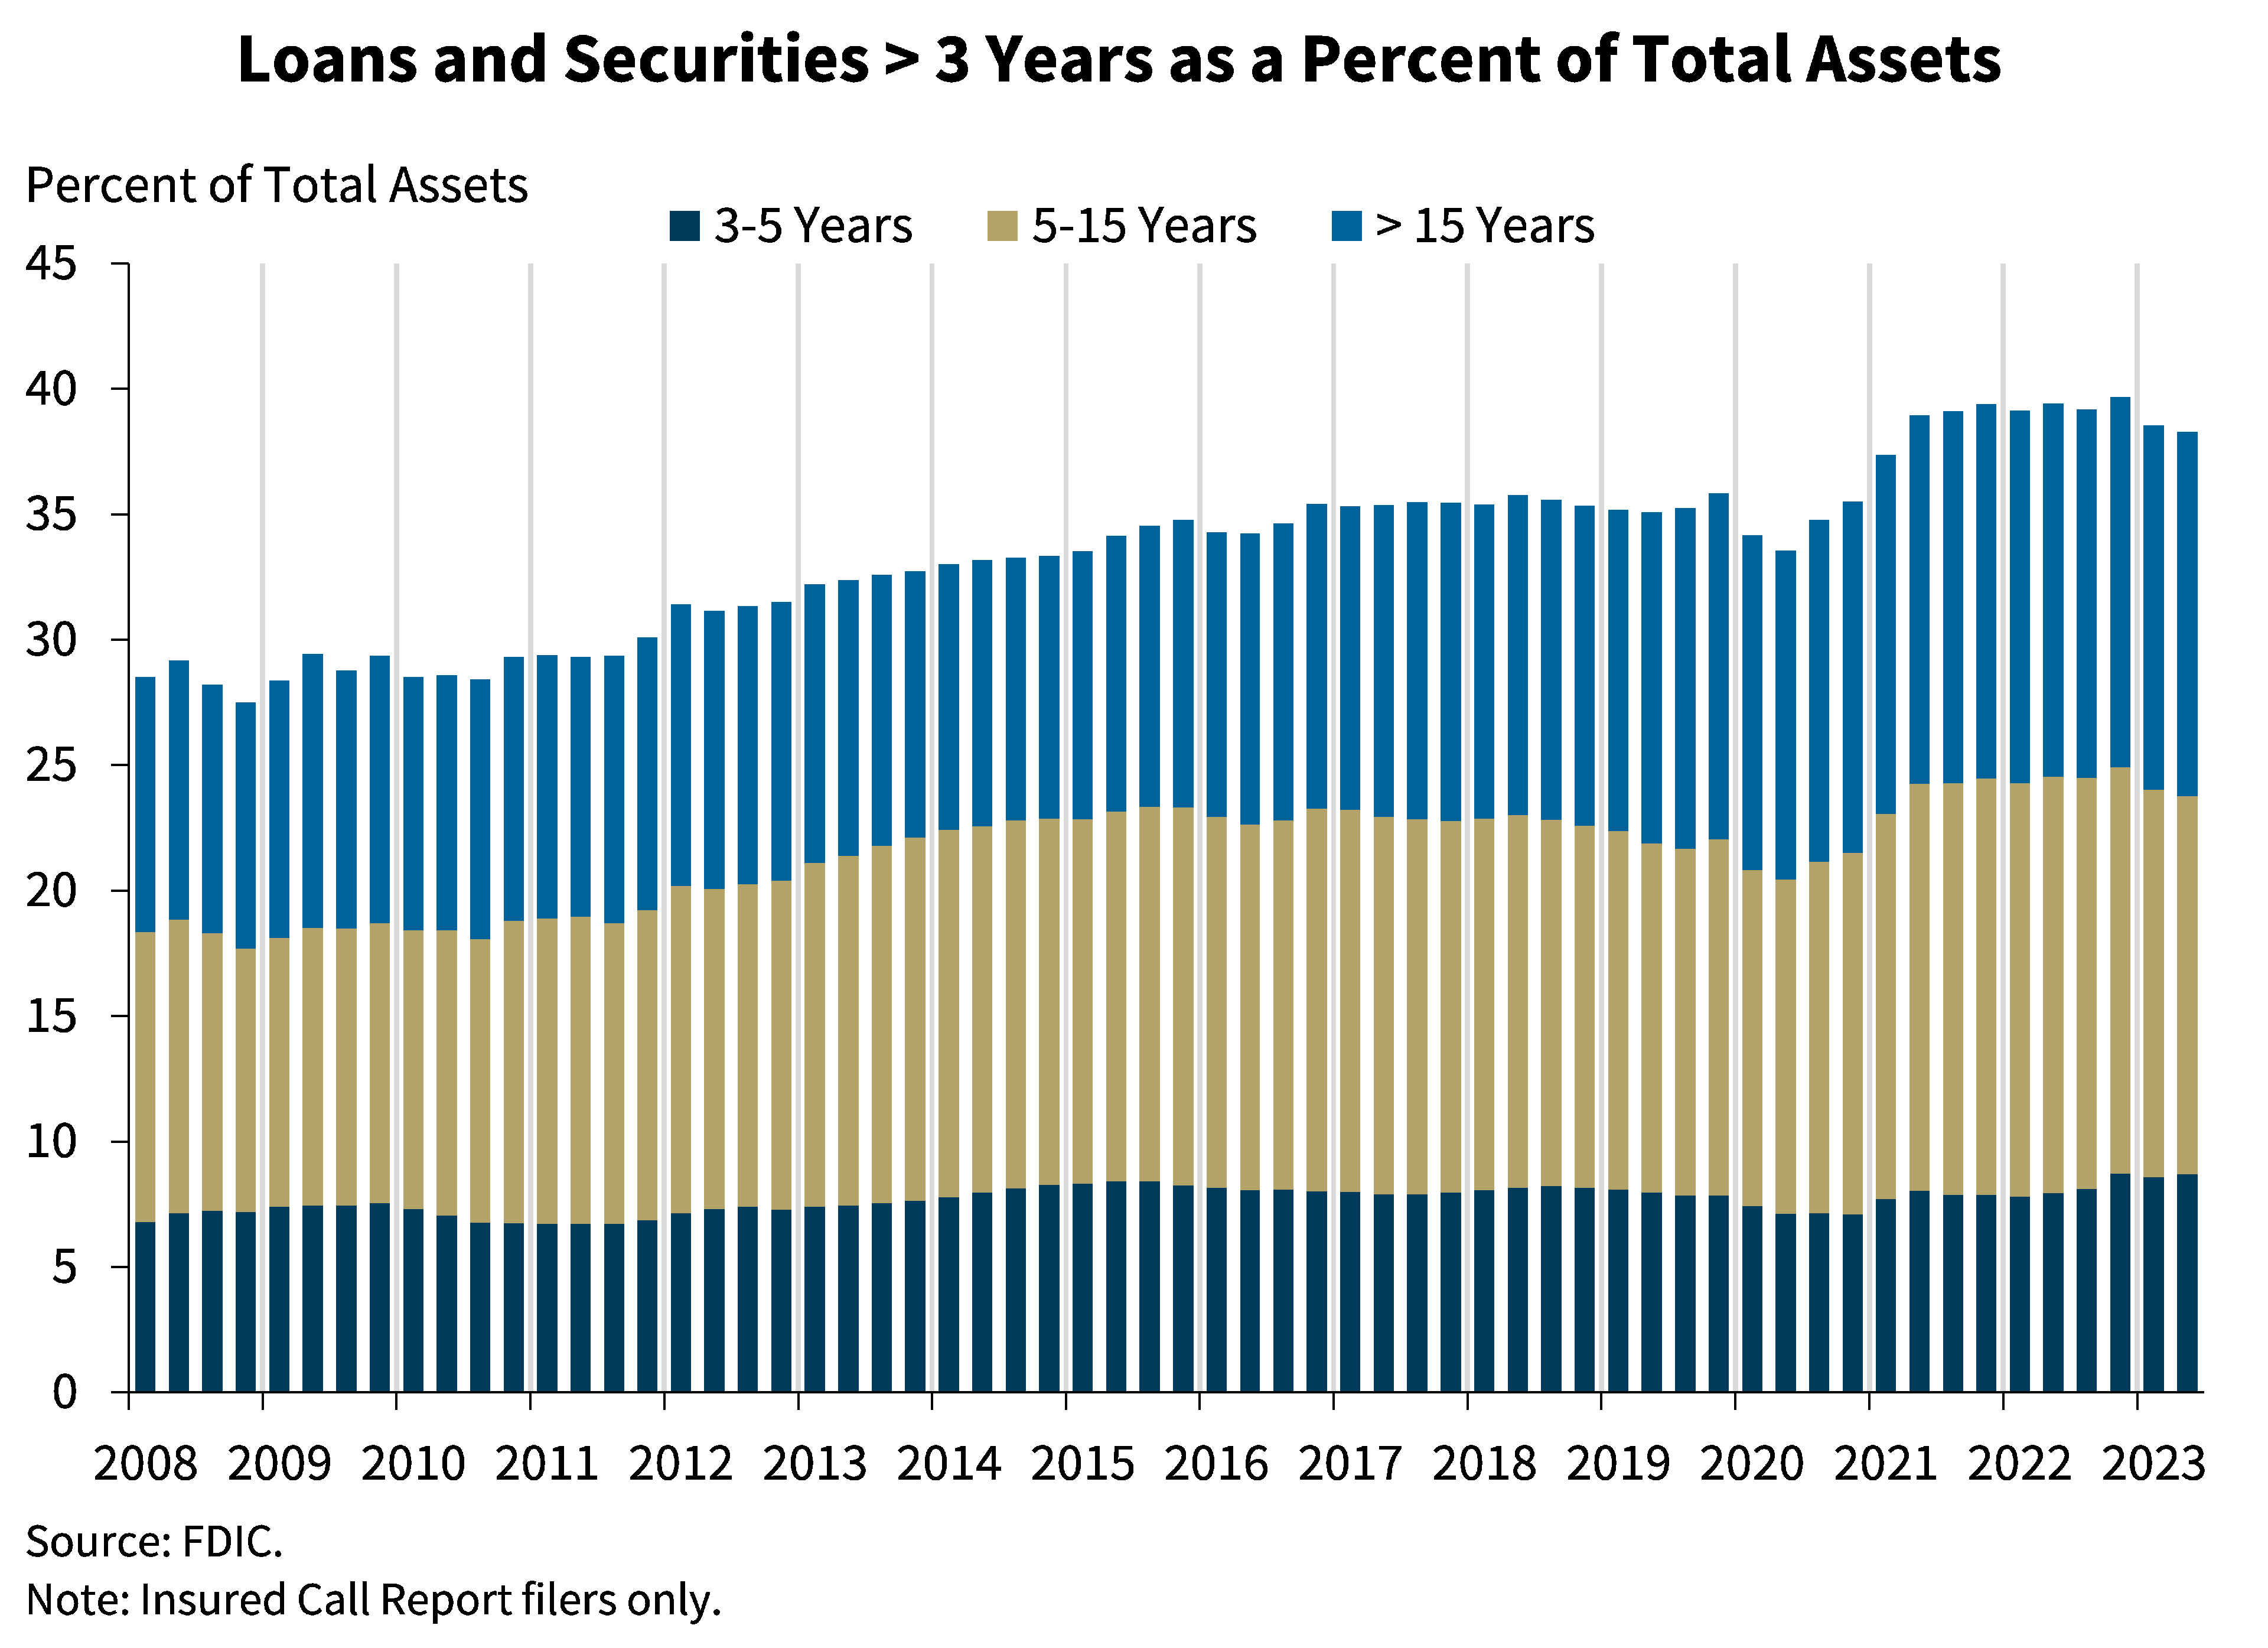
The next chart shows that the banking industry’s holdings of longer-term loans and securities declined slightly to 38.3 percent of total assets in the second quarter, driven by a reduction in securities portfolios. Loans and securities with longer maturities and locked-in, lower yields may pressure earnings in coming quarters.
Compared with the industry, community banks continued to report a higher proportion of assets with maturities longer than three years at 52.9 percent of total assets.
Chart 6:
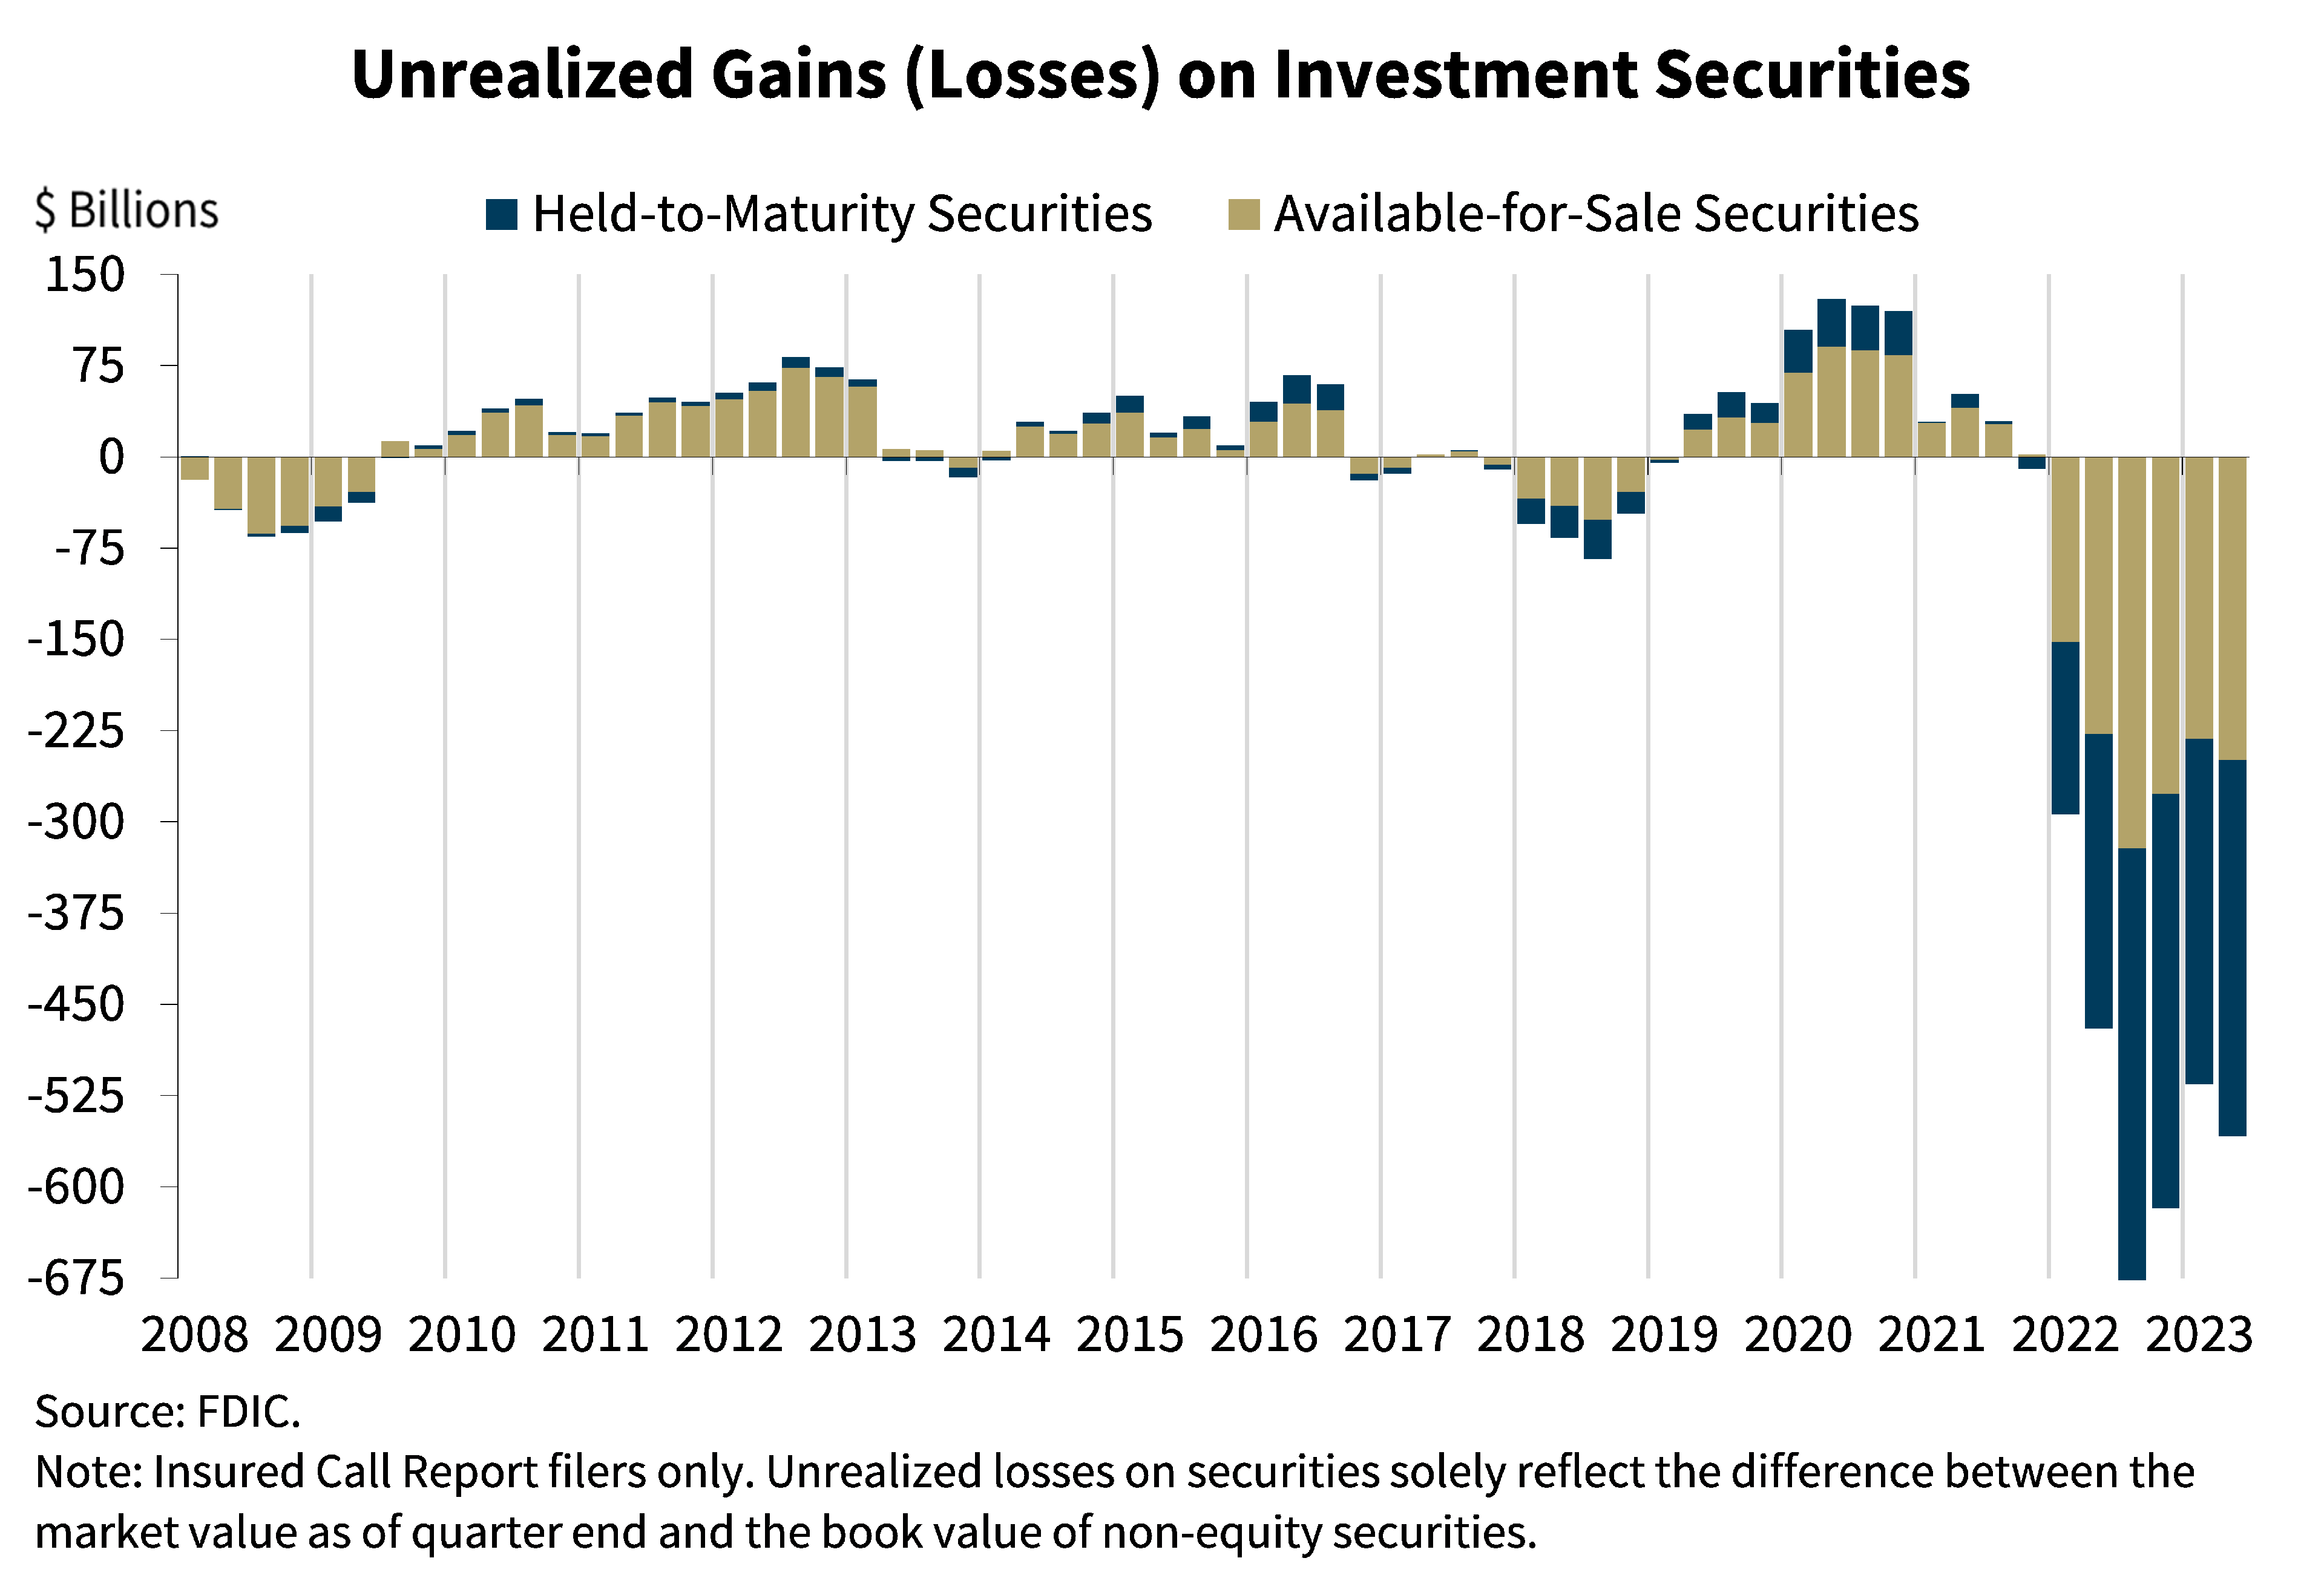
This chart shows the elevated level of unrealized losses on investment securities due to the increases in market interest rates since the beginning of 2022. Unrealized losses on available-for-sale and held-to-maturity securities totaled $558.4 billion in the second quarter, up 8.3 percent from the prior quarter, primarily due to increases in market interest rates and mortgage rates during the second quarter.
Chart 7:
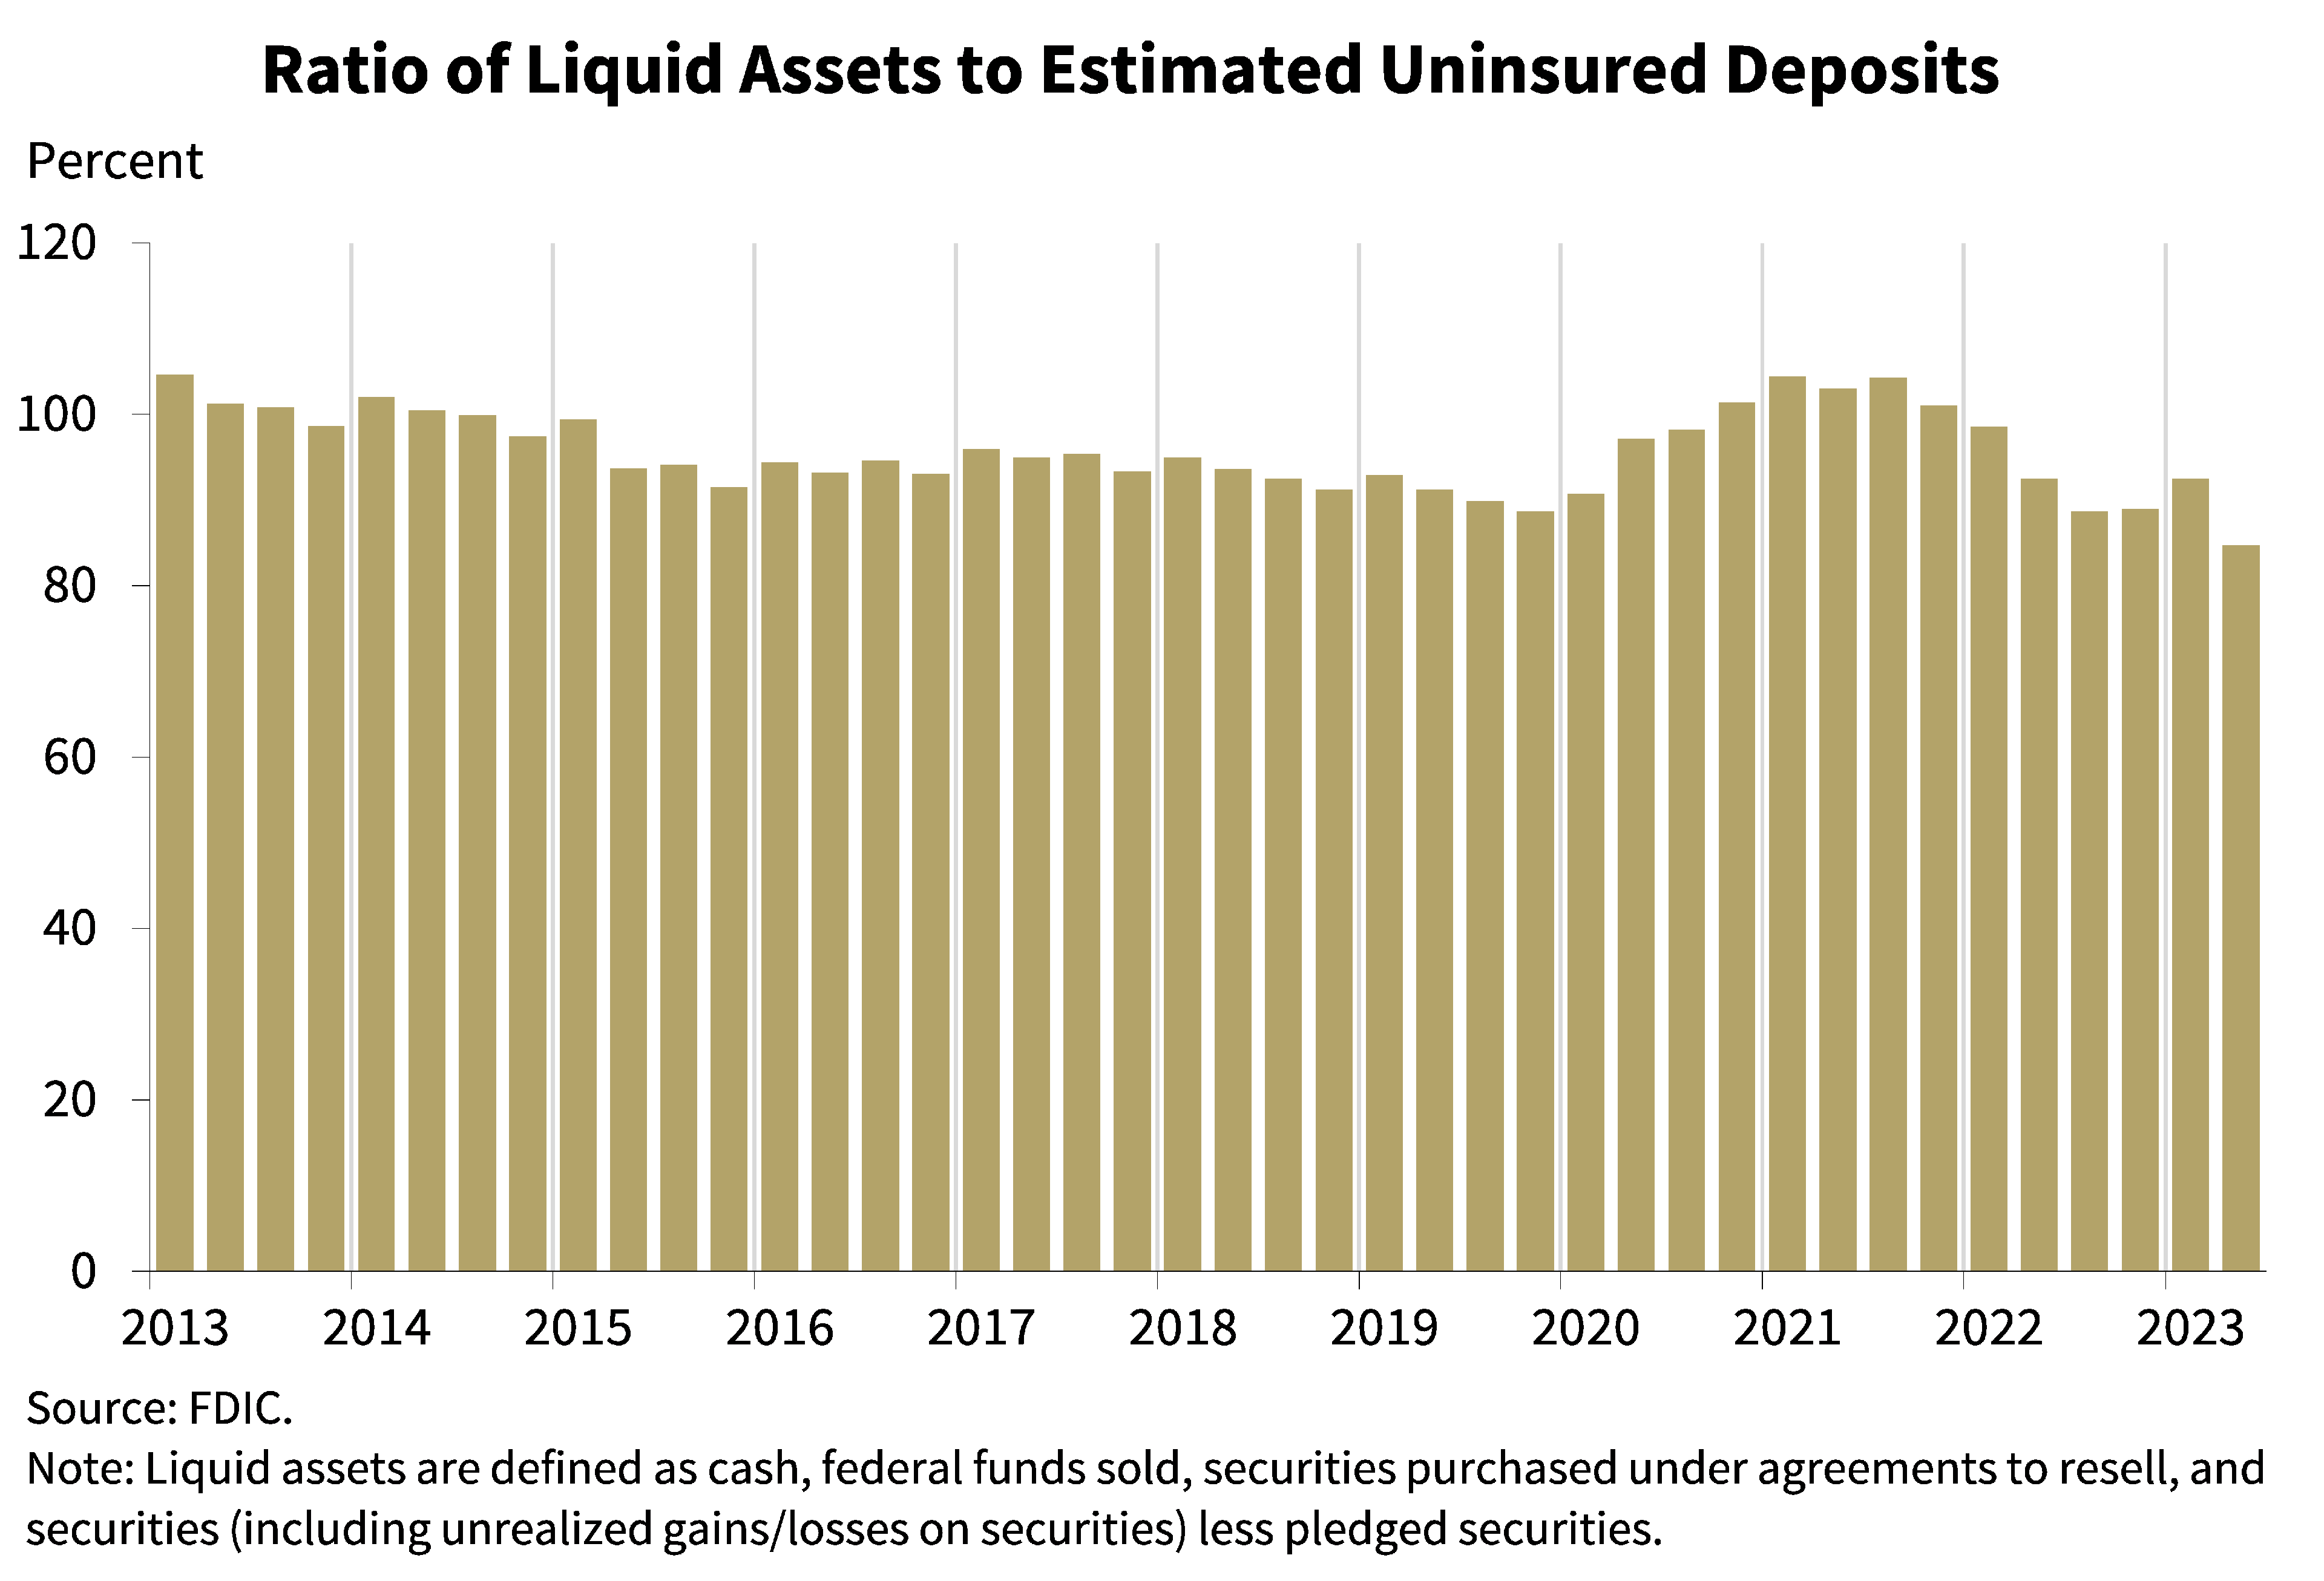
The FDIC continues to closely monitor liquidity and access to funds across the banking industry. This chart shows liquid assets as a ratio of estimated uninsured deposits, which is one measure of a bank’s ability to meet an outflow of deposits. This ratio increased significantly during the pandemic as bank deposits and liquid assets swelled, but has since declined back to more historical levels. The second quarter liquid-assets-to-uninsured-deposits ratio declined to 84.7 percent, which is below the pre-pandemic average. A substantial increase in pledged securities, the vast majority of which was for prudential liquidity contingency planning, drove the decline in liquid assets this quarter. A decline in securities portfolios and in cash and balances due from depository institutions also contributed to the quarterly decrease.
Chart 8:
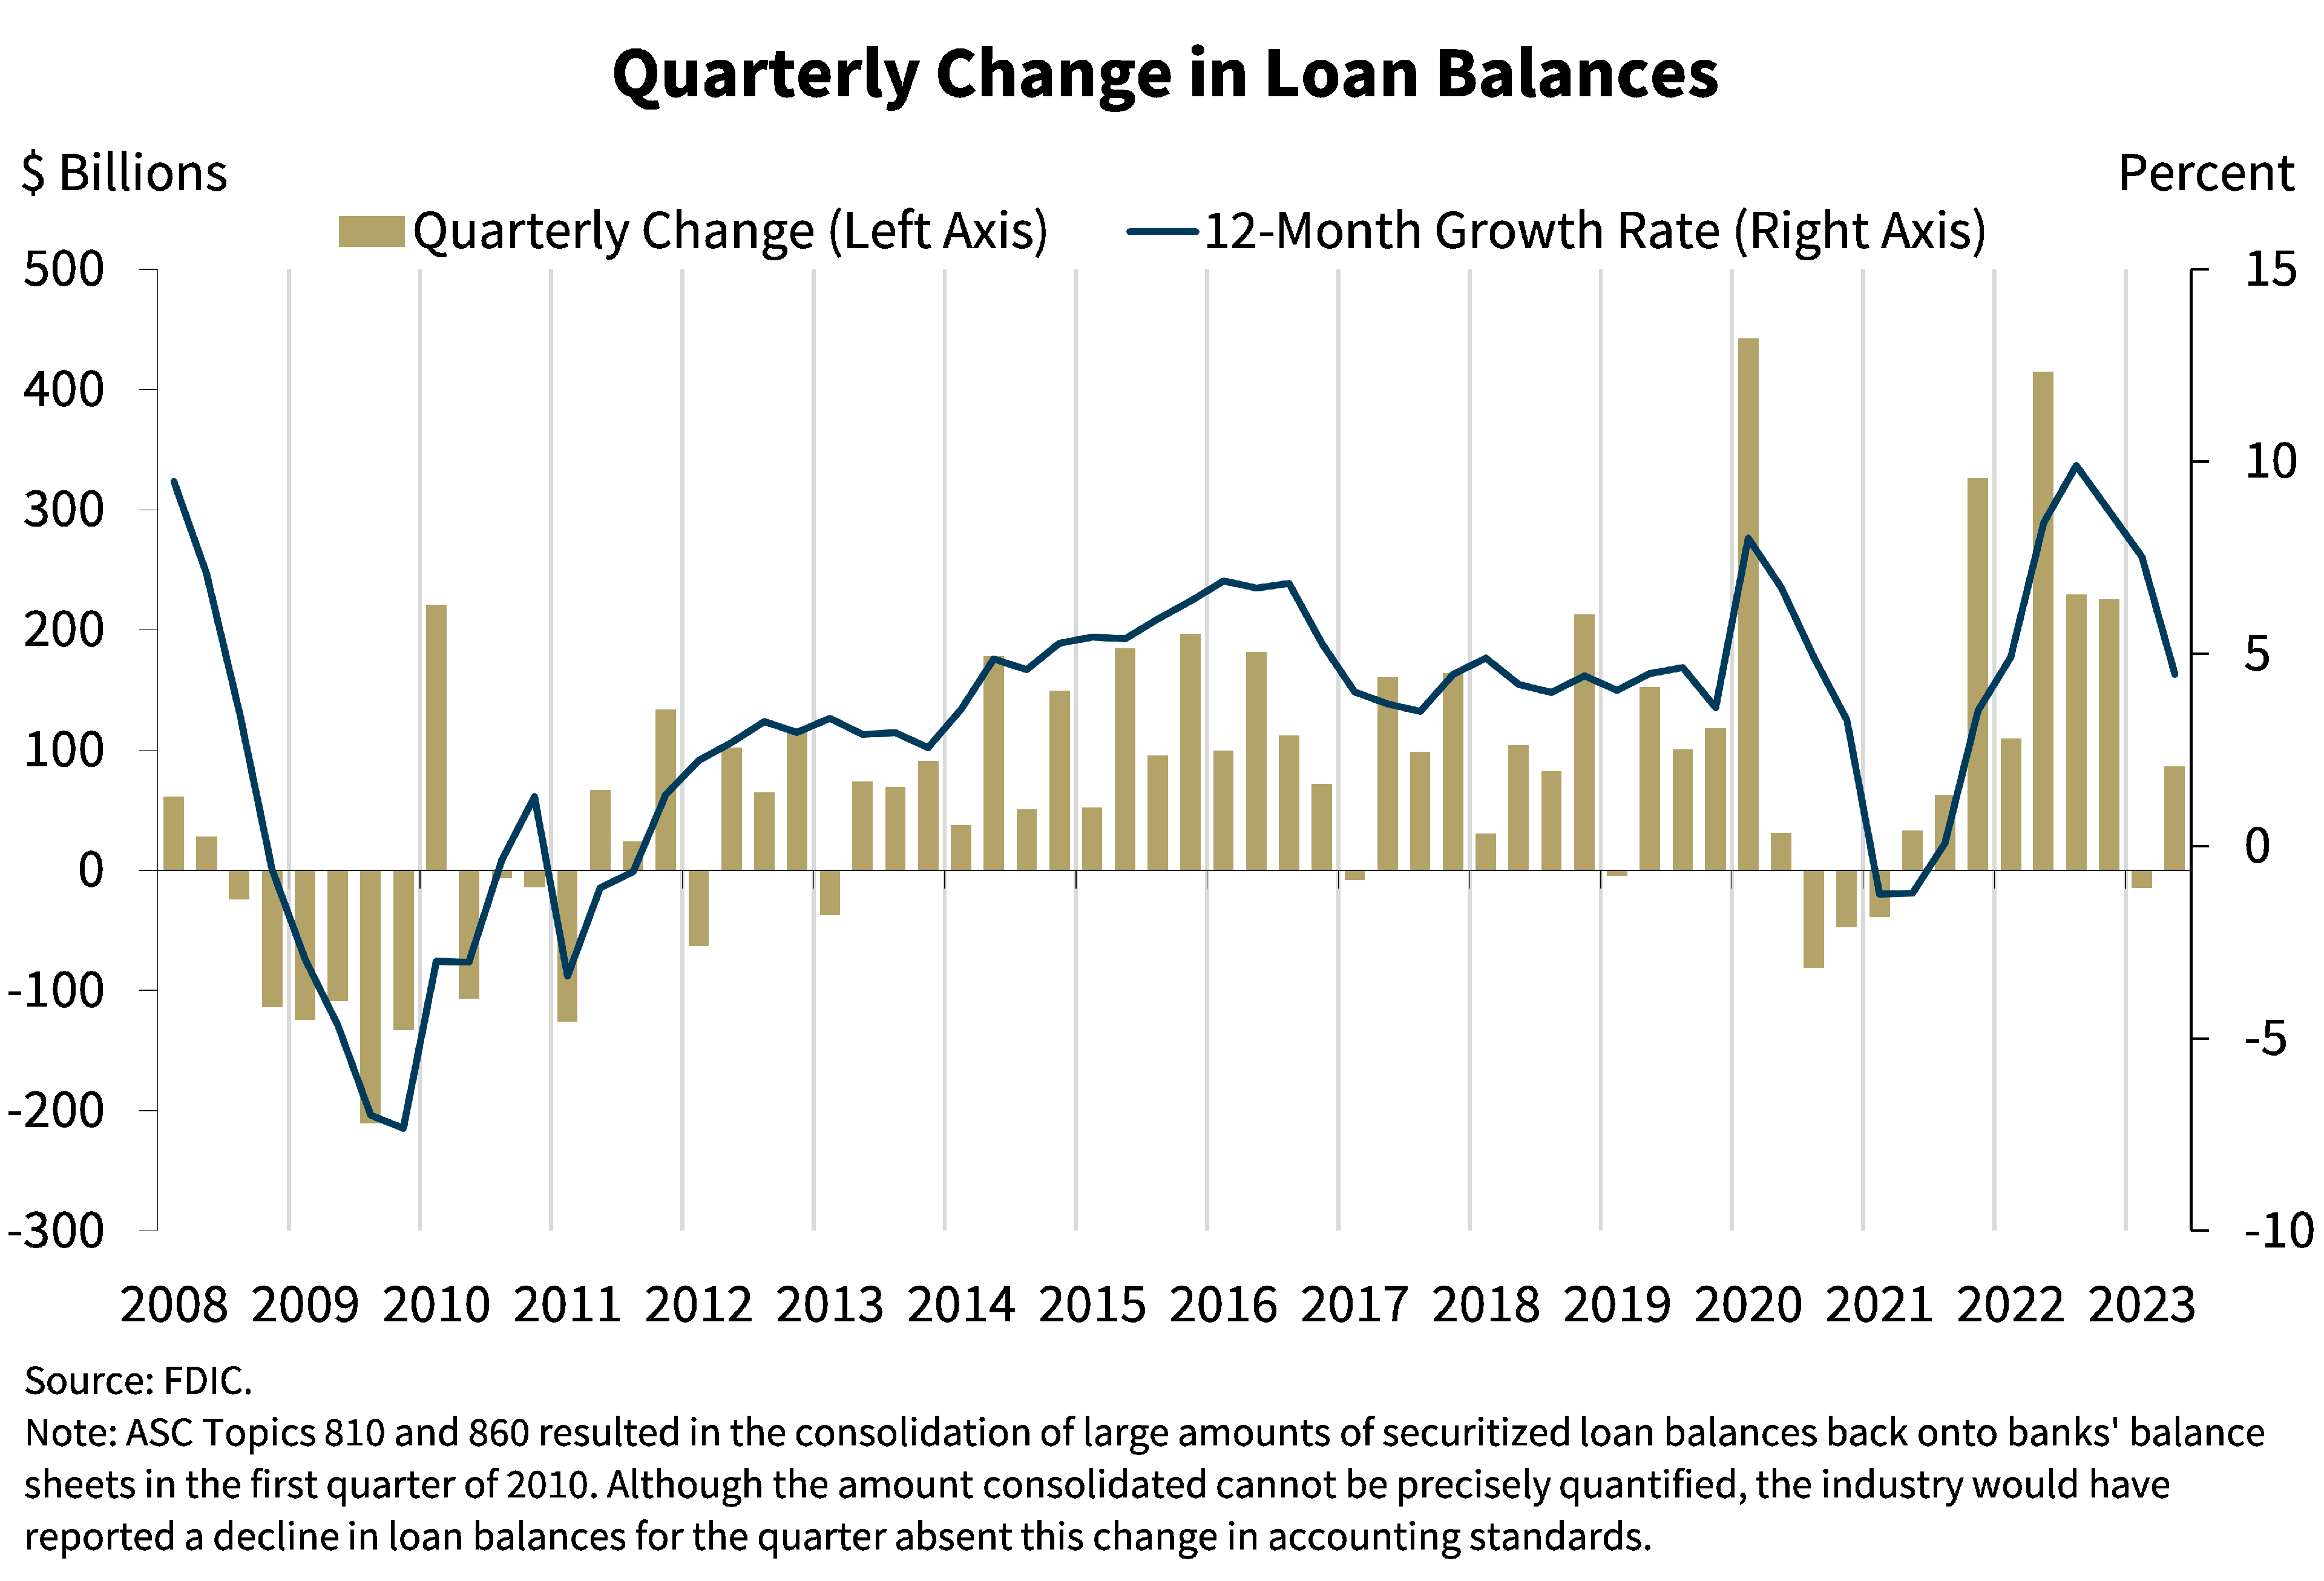
This chart shows that loan growth has normalized over the past two quarters after the large spike in lending that occurred last year. Total loans increased by $86.5 billion during the quarter, or 0.7 percent. An increase in credit card balances and loans to nondepository institutions offset declines in commercial and industrial and auto lending.
Despite the moderation in lending during the first two quarters of 2023, the banking industry still reported annual loan growth of 4.5 percent from the previous year. The growth was led by higher one-to-four family residential mortgages, consumer loans, and nonfarm, nonresidential commercial real estate mortgages.
Community banks reported stronger loan growth than the industry, increasing 2.6 percent quarter over quarter and 12.5 percent year over year. One-to-four family residential and nonfarm, nonresidential commercial real estate loan mortgages drove annual loan growth for community banks.
Despite the relatively robust loan growth reported over the past year, recent surveys indicate that loan demand is declining and underwriting standards are tightening, which may hinder growth rates in coming quarters.
Chart 9:
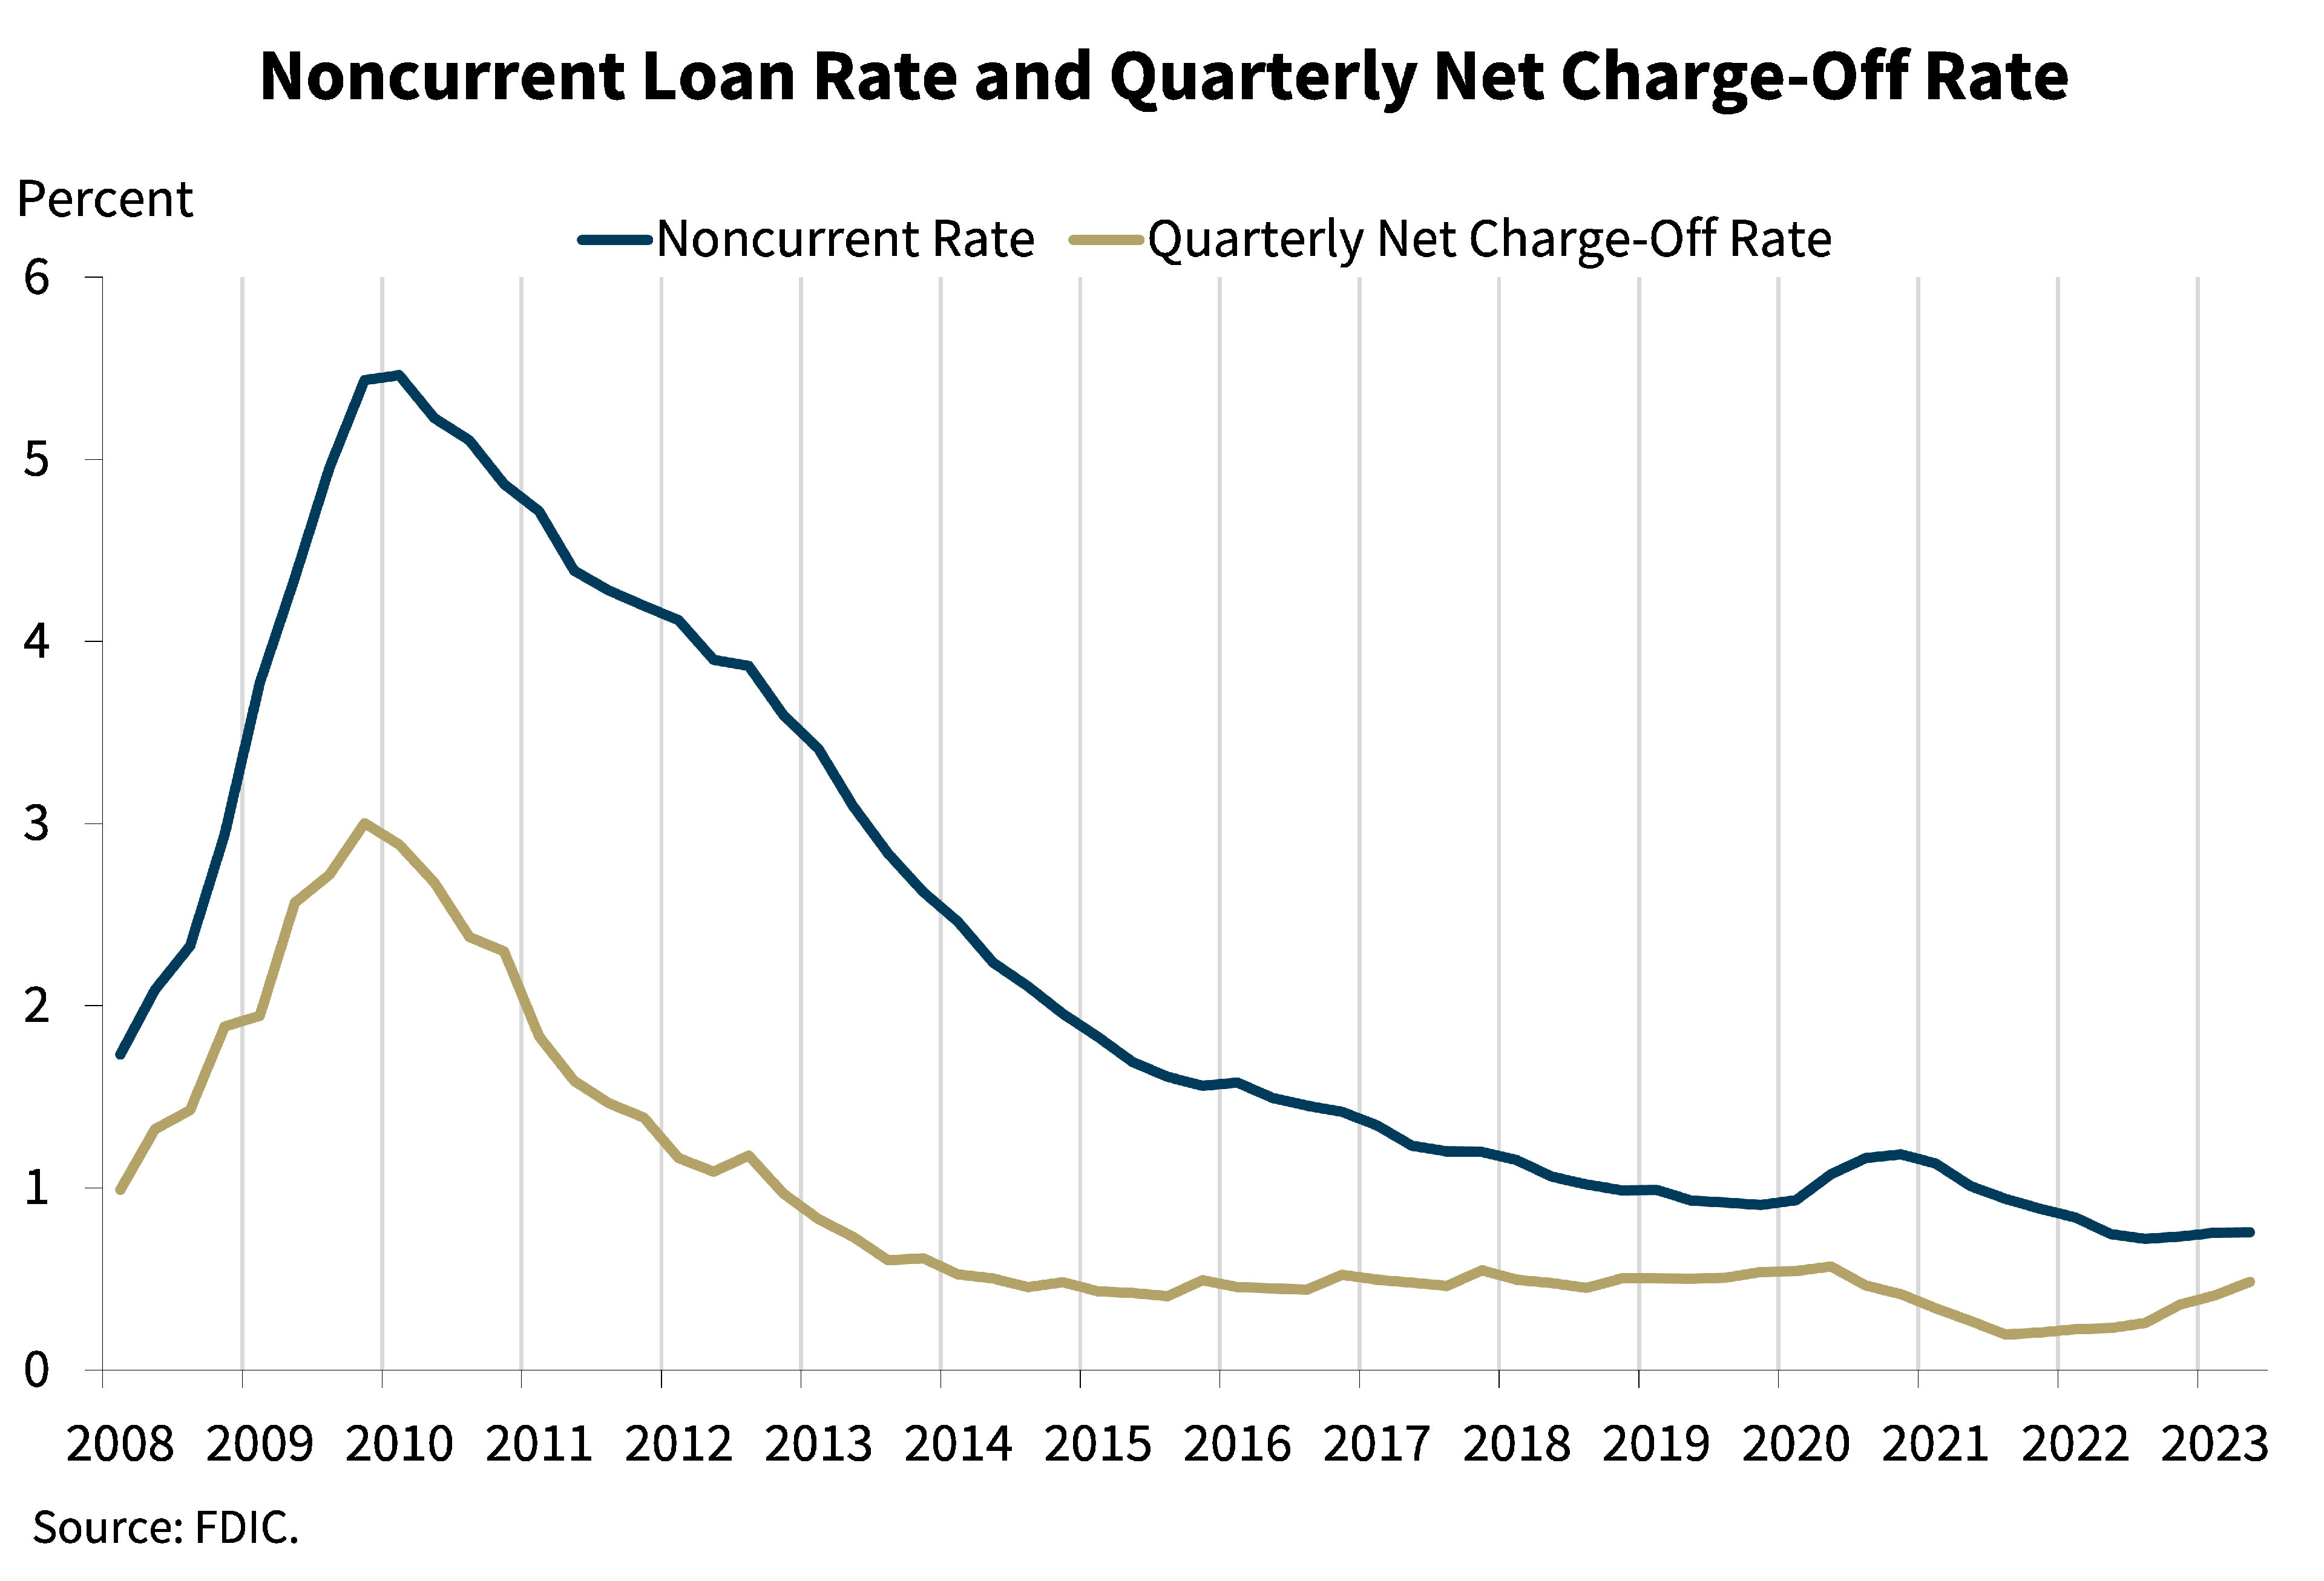
Our next chart shows that asset quality ratios for the industry remain favorable. The noncurrent and net charge-off rates increased modestly in the second quarter. The noncurrent rate increased one basis point from the first quarter to 0.76 percent, driven by increases in nonfarm, nonresidential commercial real estate noncurrent balances. This level is well below the industry’s 1.28 percent pre-pandemic average noncurrent rate. The industry’s net charge-off rate increased during the quarter to its pre-pandemic average of 0.48 percent, also driven by increases in nonfarm, nonresidential commercial real estate charge-off balances.
Community banks reported stable credit quality metrics that remain better than pre-pandemic averages. The community bank noncurrent rate increased two basis points from the previous quarter to 0.47 percent, and the net charge-off rate remained unchanged at 0.09 percent.
Chart 10:
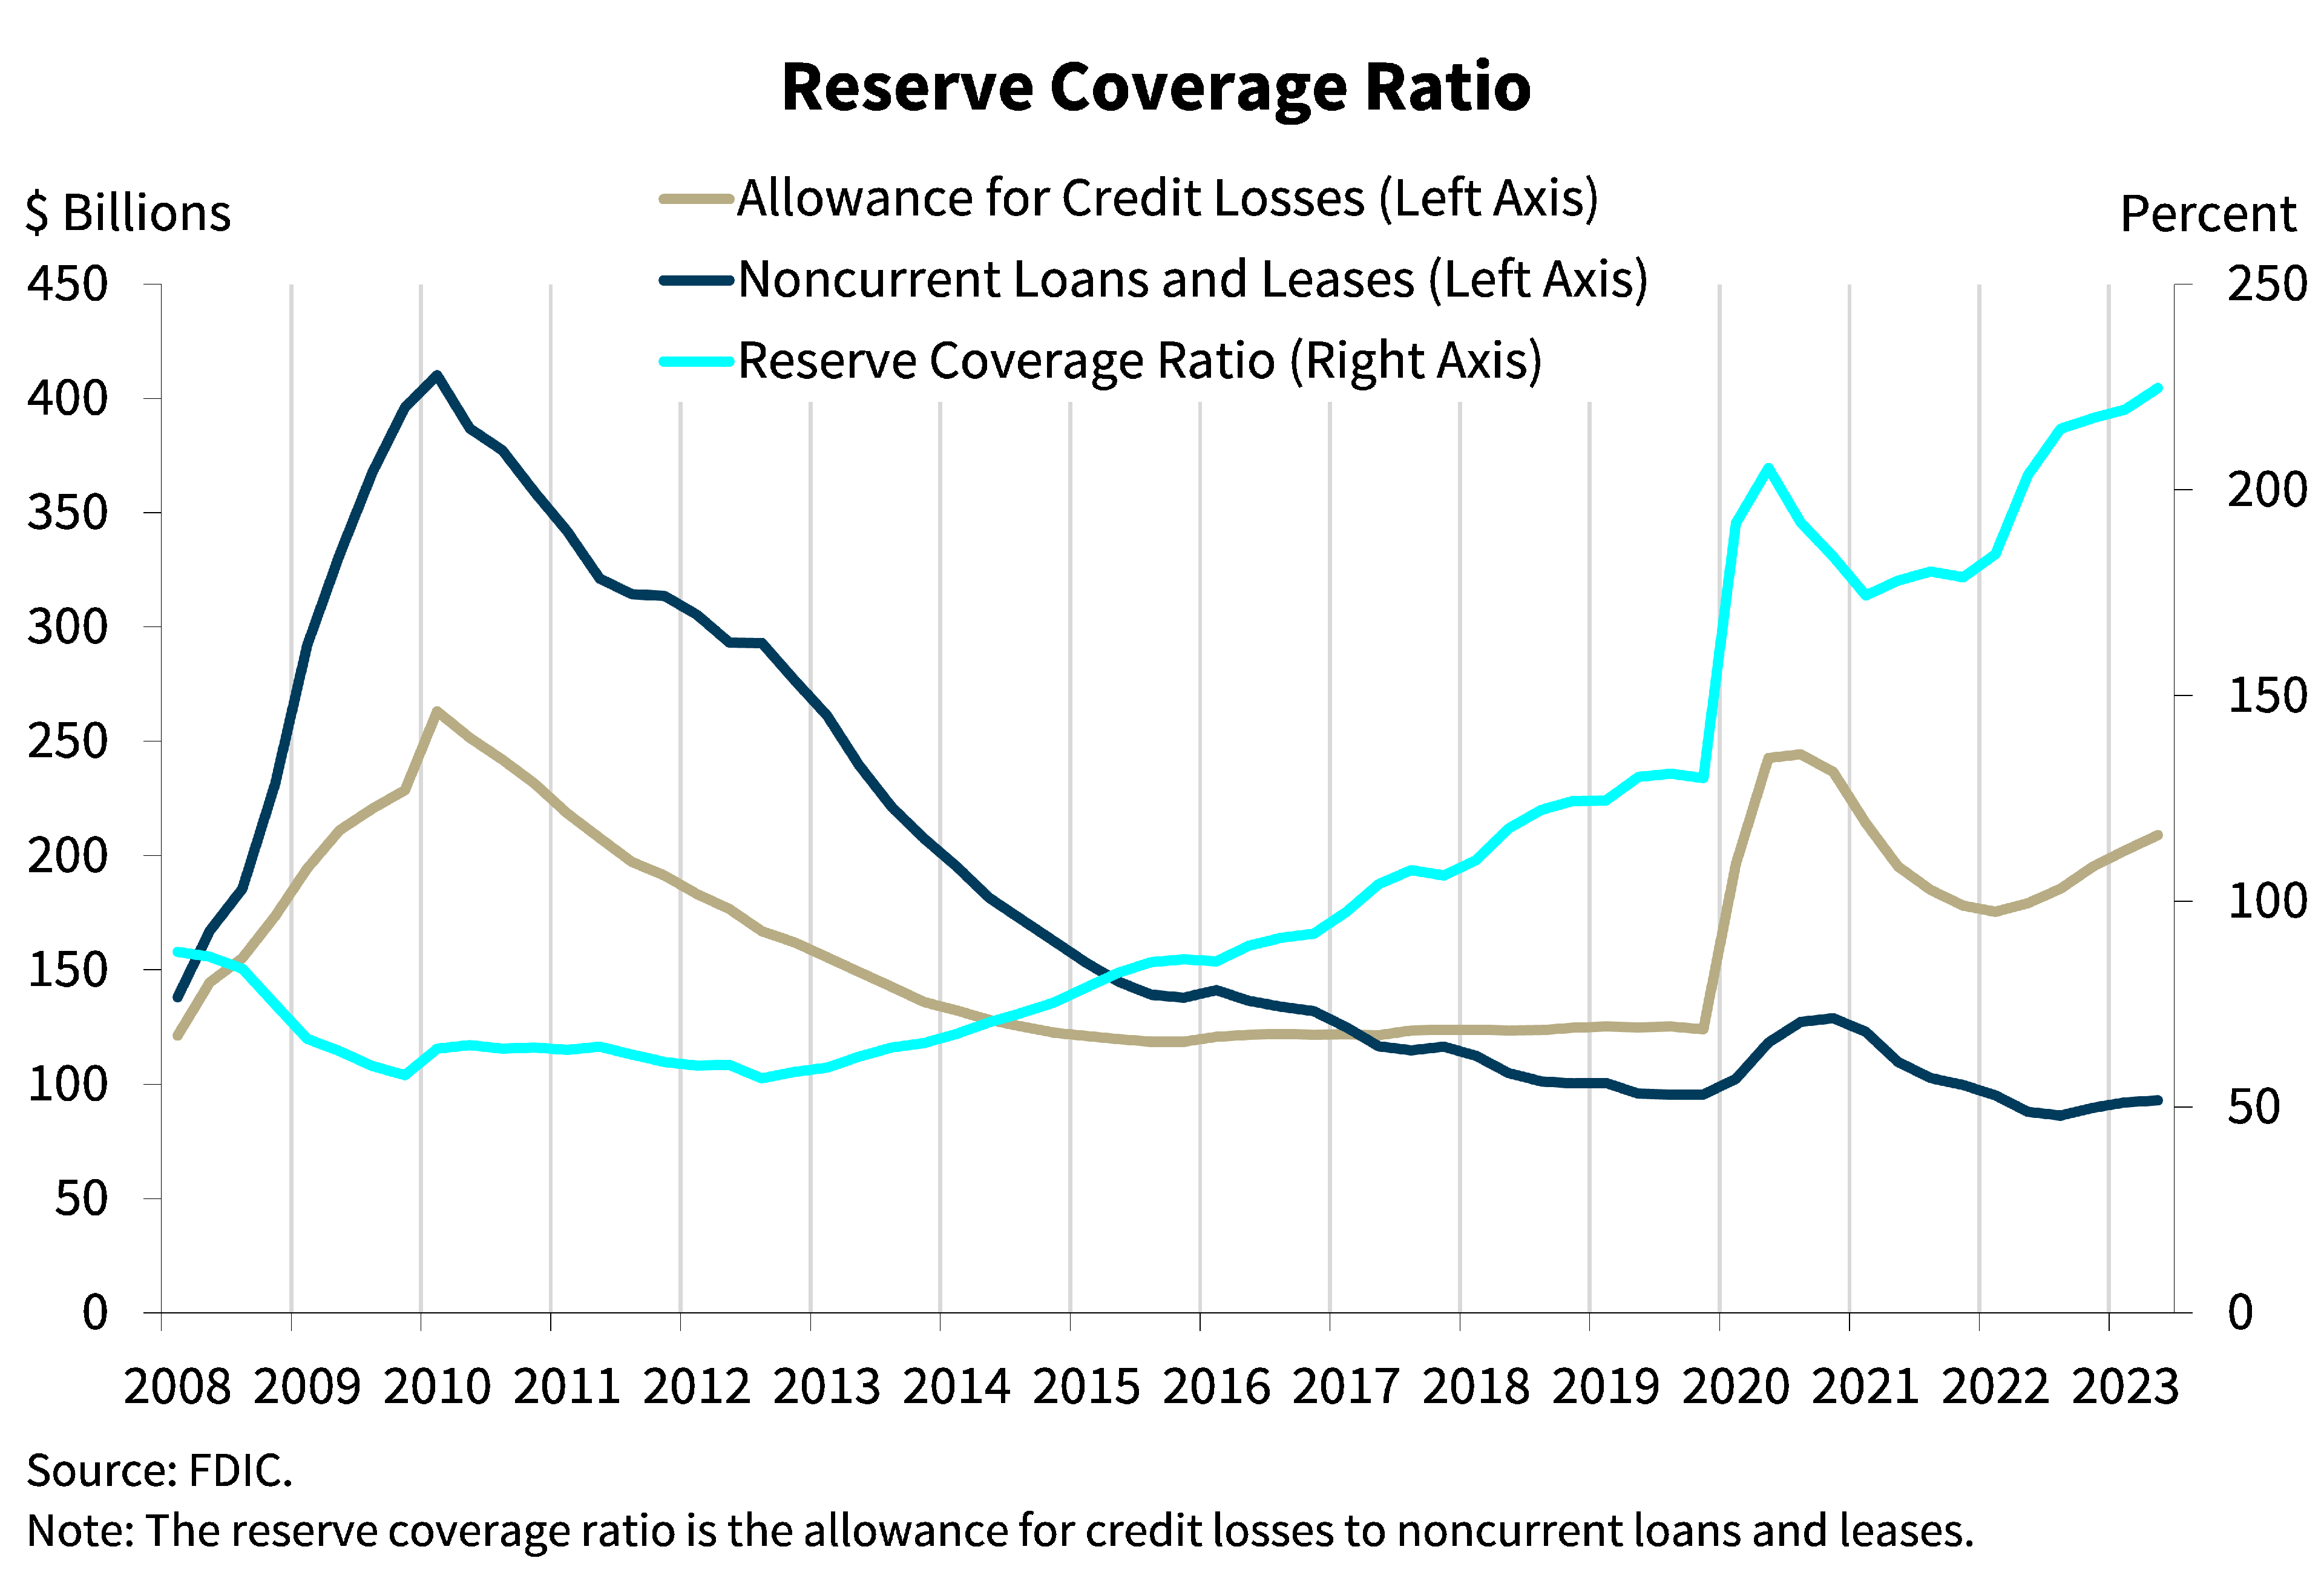
Our next chart shows that the allowance for credit losses grew at a faster pace than noncurrent loan balances, resulting in an increase in the reserve coverage ratio. The ratio of the allowance for credit losses to noncurrent loans increased from 203.6 percent one year ago to 224.8 percent this quarter, the highest level since we began publishing the Quarterly Banking Profile in 1986.
Chart 11:
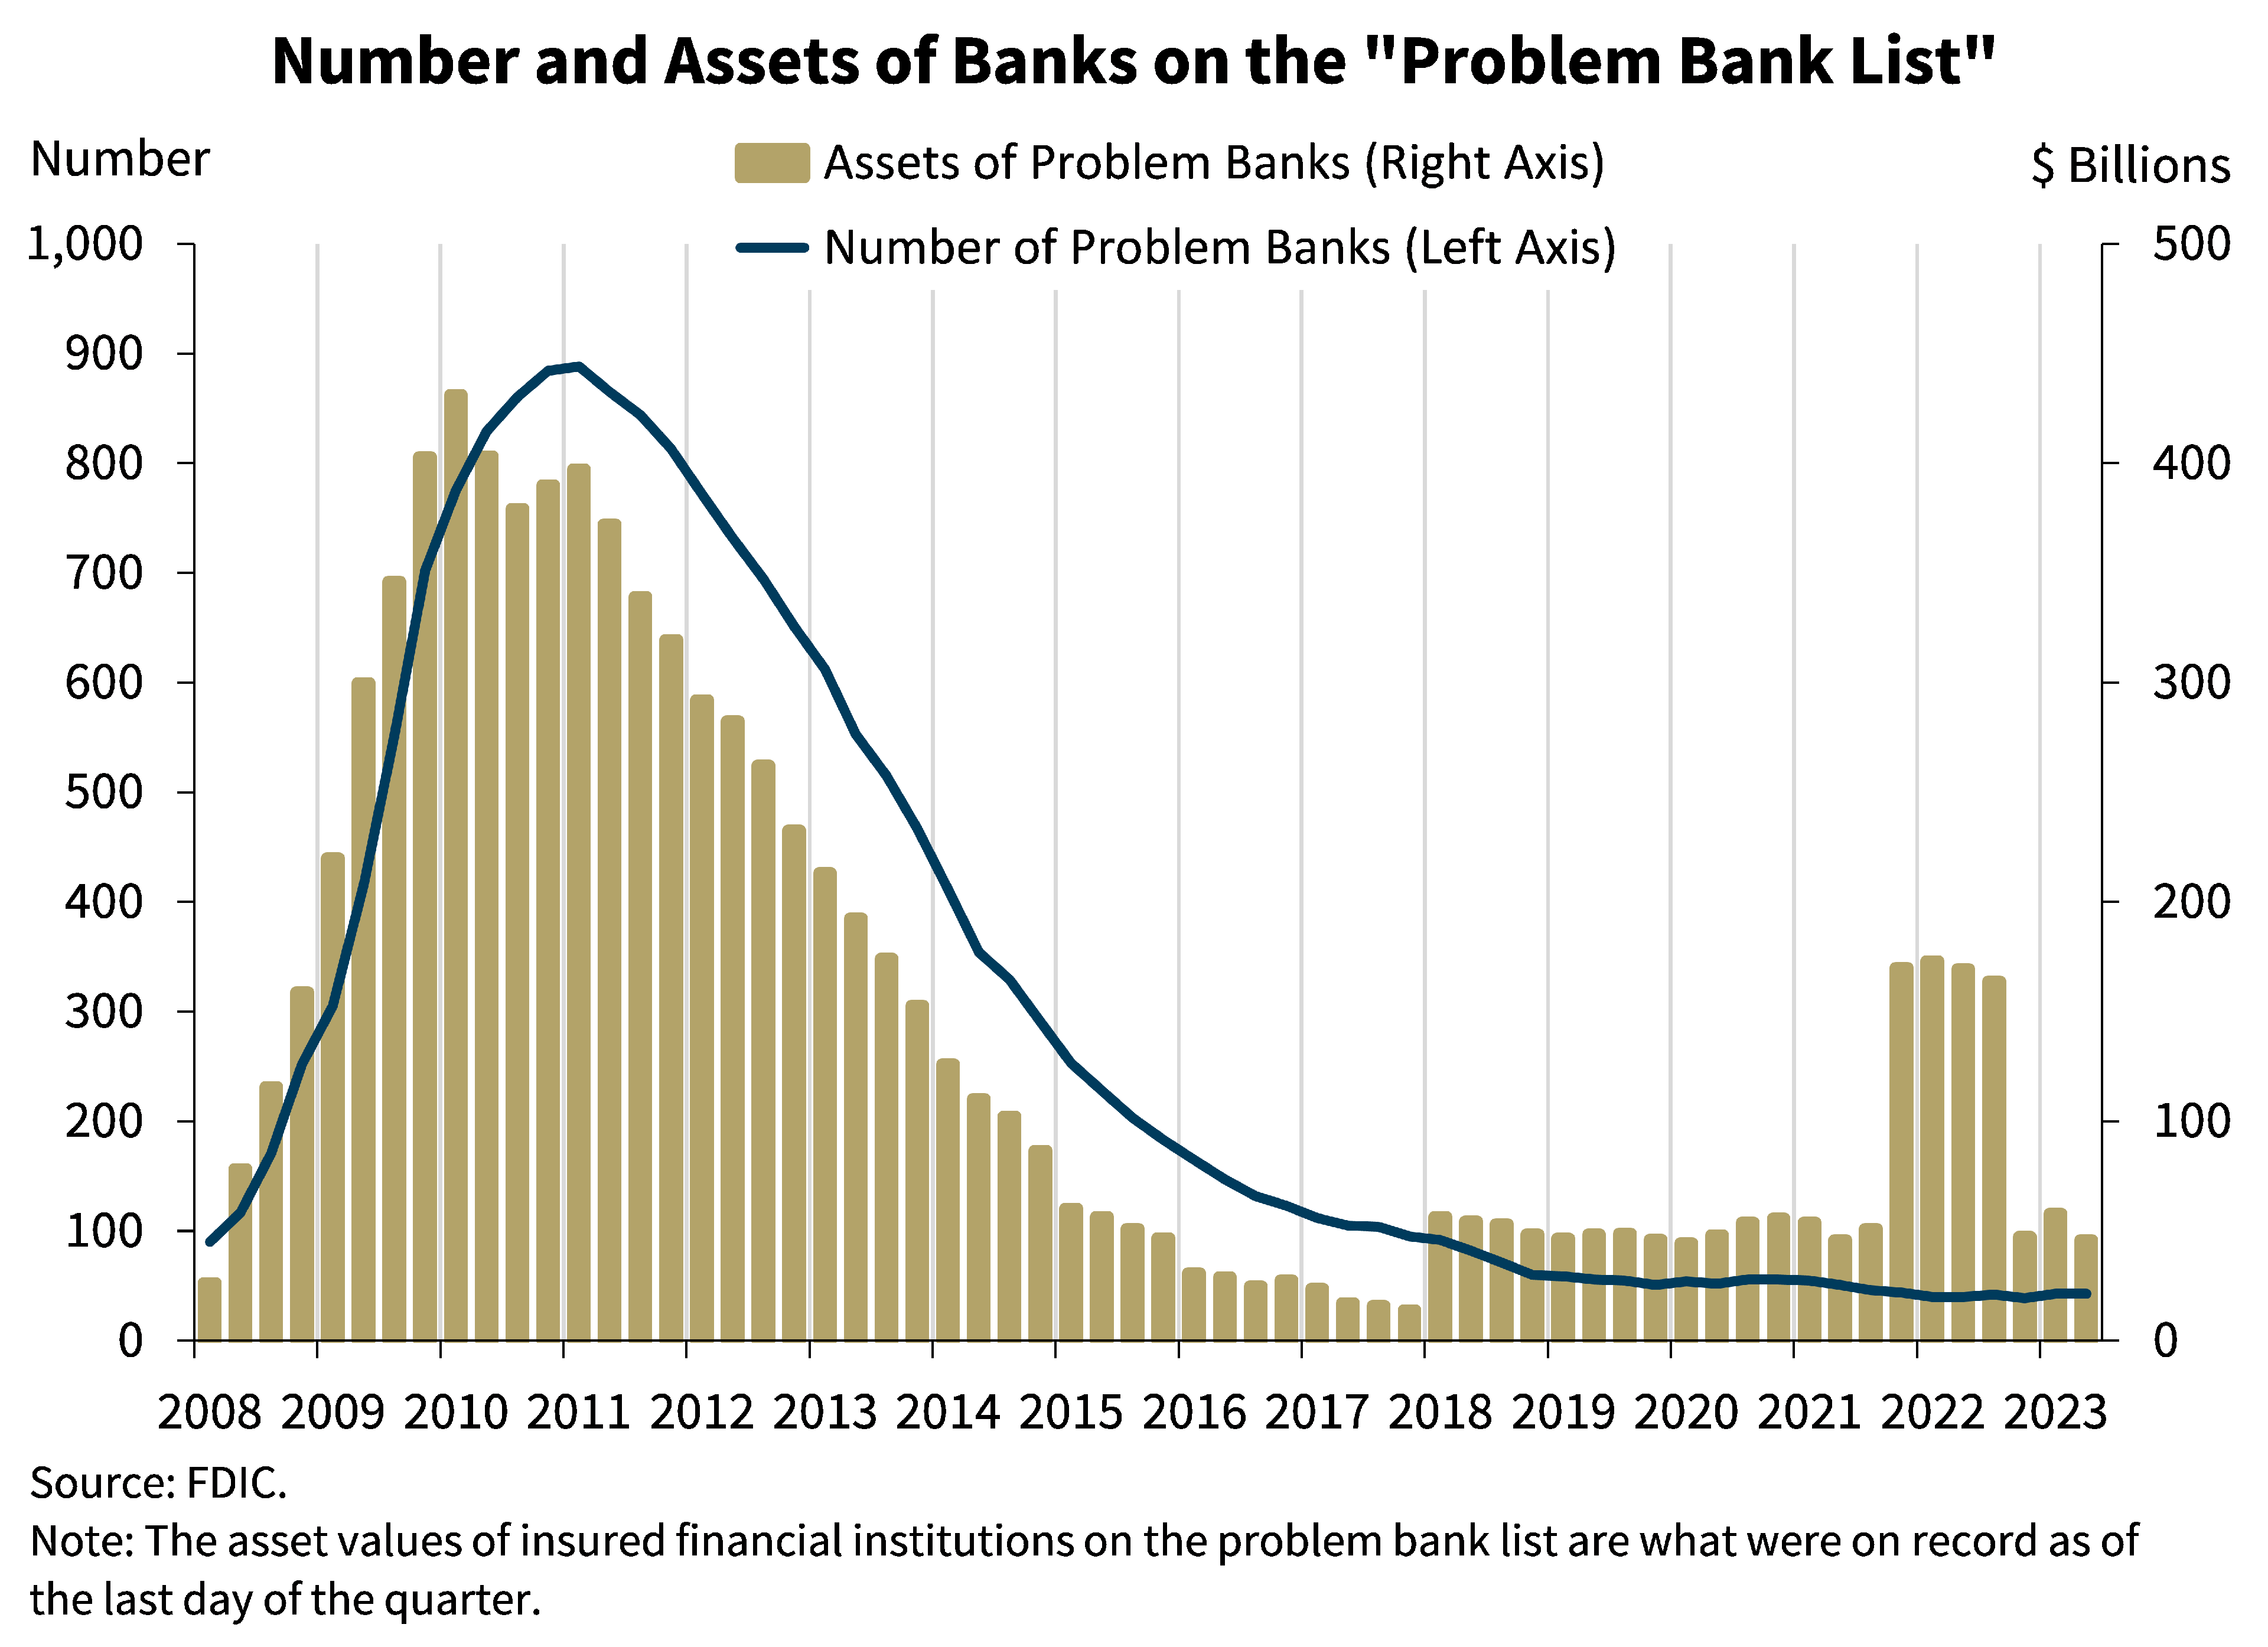
This next chart shows the number and total assets of banks on the “Problem Bank List.” Banks on this list have a CAMELS composite rating of “4” or “5” due to financial, operational, or managerial weaknesses, or a combination of such issues. The number of banks on the list remained unchanged from the previous quarter at 43 banks; however, total assets held by problem banks declined by $12 billion to $46 billion quarter over quarter. One bank failed in the second quarter.
Chart 12:
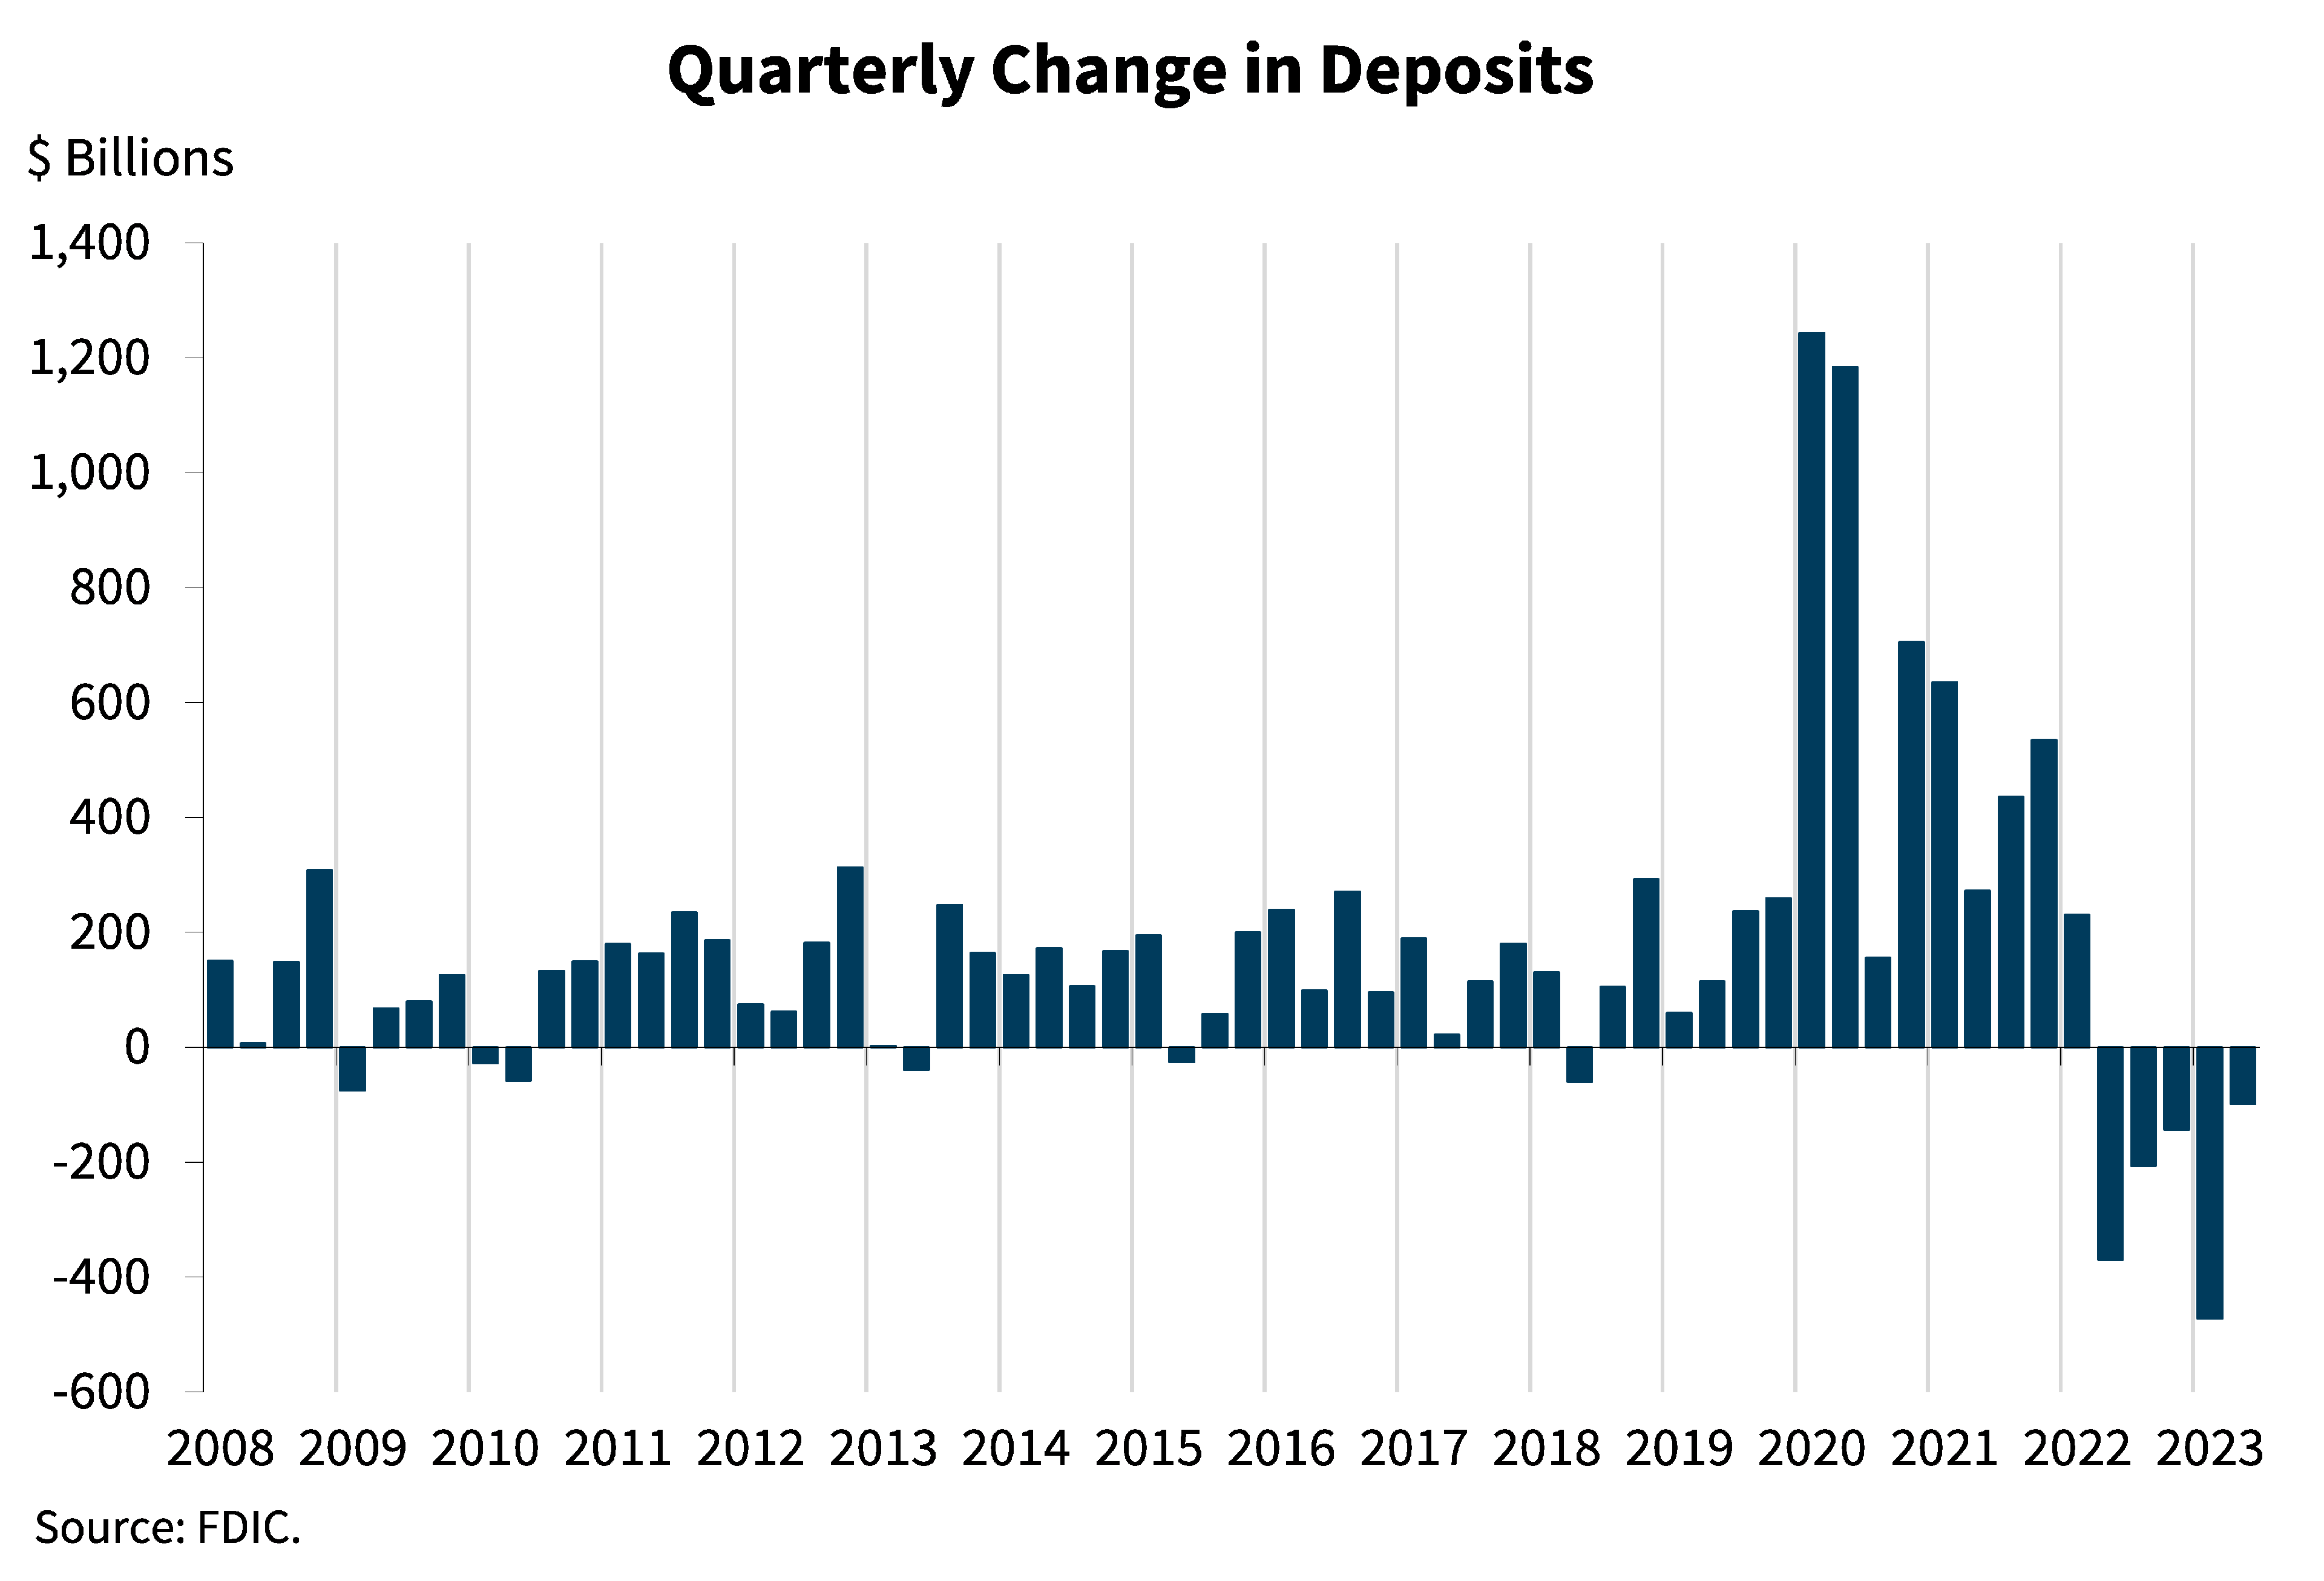
This chart shows that deposits declined for a fifth consecutive quarter. Total deposits were $18.6 trillion, down 0.5 percent quarter over quarter, a reduction from the 2.5 percent decline reported in the first quarter. In the second quarter, we observed the continuation of the trend in which customers are actively seeking higher yields. Lower-earning accounts such as transaction, money market deposit, and other savings accounts declined by $412.8 billion during the quarter, while time deposits increased by $306.7 billion. Brokered deposits increased by $177.4 billion, or 17.3 percent, during the quarter.
In the second quarter, uninsured deposits declined by 2.5 percent, far less than the 8 percent decline reported in the first quarter. By contrast, insured deposits increased by 0.8 percent during the second quarter, driven by higher insured brokered deposits and reciprocal deposits.
There has been a great deal of discussion about deposit flows between the nation’s larger banks, primarily under the assumption that deposits have flowed from regional banks to the largest banks. While deposit balances may have suggested that such flows occurred on a limited basis toward the end of the first quarter, that does not appear to have been the case in the second quarter. The nation’s global systemically important banks reported a 1.2 percent quarterly decline in total deposits in the second quarter, primarily driven by a 3 percent decline in uninsured deposits. Rather than a simple story of deposits flowing to the largest banks, the second quarter’s deposit story appears to have been more about pricing pressures from depositors seeking higher yields, often at nonbank financial institutions, particularly money market mutual funds.
Chart 13:
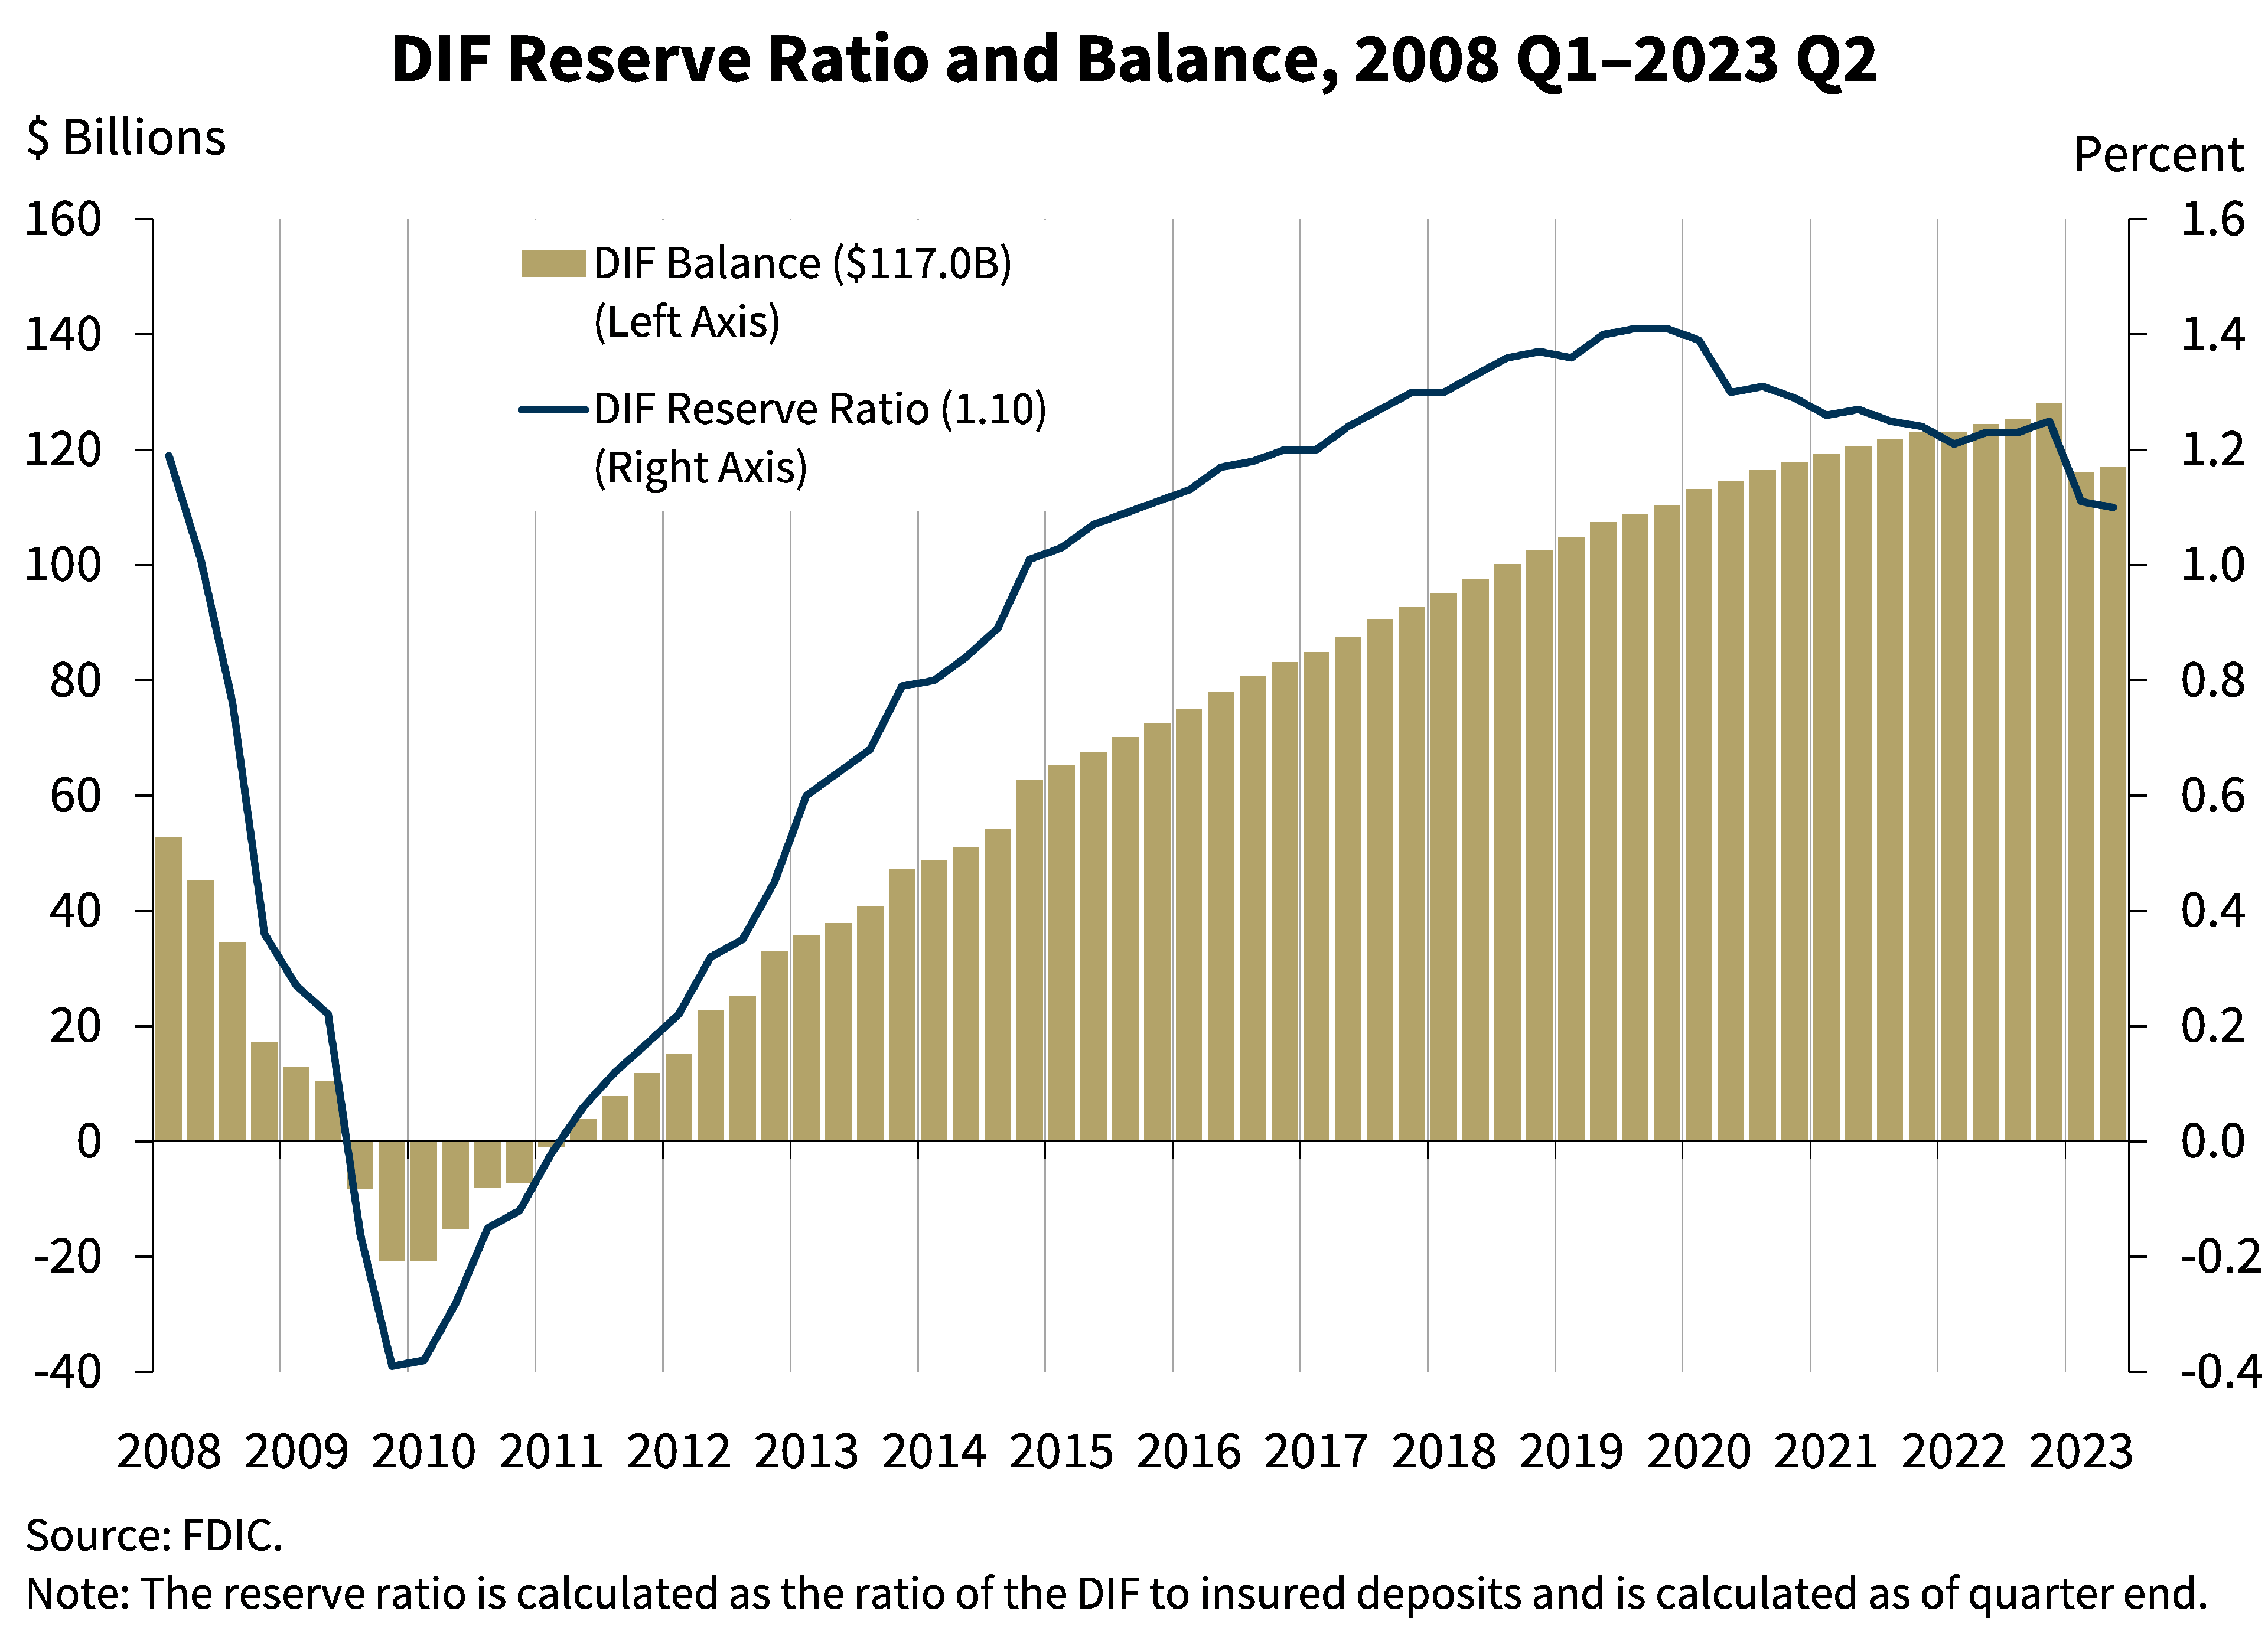
This chart shows that the DIF balance was $117.0 billion on June 30, up approximately $900 million from the first quarter. The rise in the DIF balance was primarily driven by assessment income of $3.1 billion. This income was offset by additional provisions for insurance losses of $2 billion related to the failure of First Republic, and operating expenses of $0.5 billion.
Insured deposits increased by 0.8 percent during the second quarter, bringing year-over-year insured deposit growth to 4.7 percent. This growth of insured deposits more than offset the growth of the DIF balance, resulting in the reserve ratio falling by one basis point to 1.10 percent as of June 30.
The FDIC adopted a DIF Restoration Plan on September 15, 2020, to return the reserve ratio to the statutory minimum of 1.35 percent by September 30, 2028, as required by law. Assuming normal growth in the DIF balance and insured deposits, the reserve ratio remains on track to reach 1.35 percent by the statutory deadline. The FDIC will continue to monitor factors affecting the reserve ratio, including but not limited to, insured deposit growth and potential losses due to bank failures and related reserves, as required under the current Restoration Plan.
In conclusion, the banking industry has proven to be resilient in 2023. In the second quarter, net income was flat from the first quarter—after adjusting for the accounting gains of failed-bank acquisitions—but still high by historical measures. In addition, asset quality metrics remained favorable and the industry remains well capitalized.
However, the banking industry still faces significant challenges from the effects of inflation, rising market interest rates, and geopolitical uncertainty. These risks, combined with concerns about commercial real estate fundamentals, especially in office markets, as well as pressure on funding levels and net interest margins, will be matters of continued supervisory attention by the FDIC.
Thank you.
I am happy to take your questions.
| 1 | In this statement, the "pre-pandemic average" refers to the period of first quarter 2015 through fourth quarter 2019. |