
Quarterly Banking Profile - First Quarter 2021
Good morning, and welcome to our release of first quarter 2021 performance results for FDIC-insured institutions.
The banking industry reported strong earnings in first quarter 2021 as the economic recovery continued. The main driver of the higher earnings was a negative provision expense, the first in the history of the Quarterly Banking Profile, as banks adjusted expectations for potential future credit losses. At the same time, the persistent low interest rate environment and a decline in loan volume caused further contraction in the average net interest margin, which reached a new record low. Although the banking industry reported an overall contraction in loan balances from both the previous quarter and a year ago, banks continued to support the recovery with lending through the second round of the Paycheck Protection Program. Furthermore, deposits continued to grow at a fast pace in the first quarter, continuing several quarters of unprecedented deposit growth.
Community banks reported strong revenue growth, improved asset quality, and modest loan growth in the first quarter. However, community banks continued to report net interest margin compression.
Despite continued challenges, the banking industry remains resilient. Strong capital and liquidity levels support lending needs and help protect against potential losses.
The Deposit Insurance Fund balance was $119.4 billion as of March 31, up $1.5 billion from the end of the fourth quarter. The reserve ratio declined four basis points to 1.25 percent, solely because of strong insured deposit growth. In accordance with the DIF Restoration Plan, FDIC staff continues to closely monitor the factors that affect the reserve ratio and will provide progress reports and, as necessary, modifications to the plan to the Board at least semiannually.
I am joined today by Diane Ellis, Director of the Division of Insurance and Research; Pat Mitchell, Deputy Director of the Division of Insurance and Research; and Doreen Eberley, Director of the Division of Risk Management Supervision, to discuss bank performance in first quarter 2021.
Diane, I will turn this over to you. Thank you.
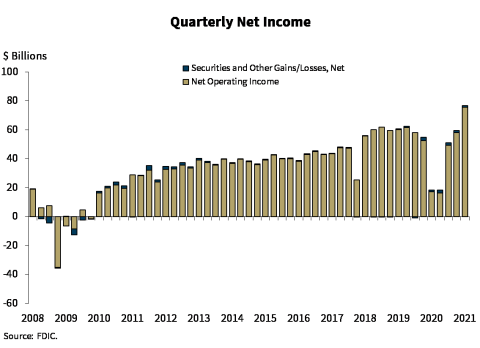
Chart 1:
Thank you, Chairman McWilliams.
The banking industry reported net income of $76.8 billion during the first quarter, up 315 percent from one year ago. Furthermore, nearly three fourths of all banks reported higher quarterly net income compared with a year ago. Along with the increase in income, the industry’s return on assets increased from 0.38 percent in first quarter 2020 to 1.38 percent this quarter.
A large decline in provision expense drove improvement in industry net income. Provision expense for the banking industry was negative $14.5 billion in the first quarter. This is the first quarter in the history of the QBP that the industry, in aggregate, had a negative provision expense.
Community banks reported quarterly net income of $8.4 billion up 78 percent from a year ago. A combination of higher noninterest income and lower provision expense drove the improvement in net income for community banks.
Chart 2:
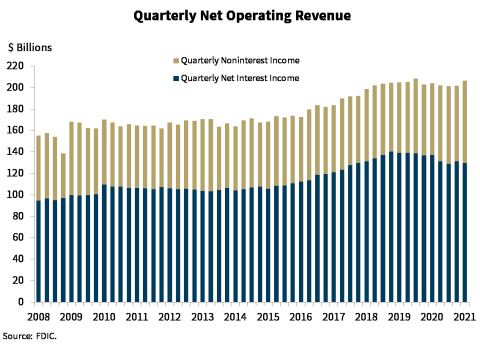
Quarterly net operating revenue increased 1.1 percent from first quarter 2020 to $206.5 billion. Net interest income declined, but noninterest income increased relative to a year ago.
Lower loan originations and relatively low interest rates were the primary contributors to the reduction in net interest income, which declined $7.6 billion from first quarter 2020. While the largest banks reported declines in net interest income, more than three-fifths of all banks reported higher net interest income compared with a year ago.
Noninterest income rose $9.9 billion from a year ago—driven by higher revenue from loan servicing fees, gains on loan sales, and trading activities.
Chart 3:
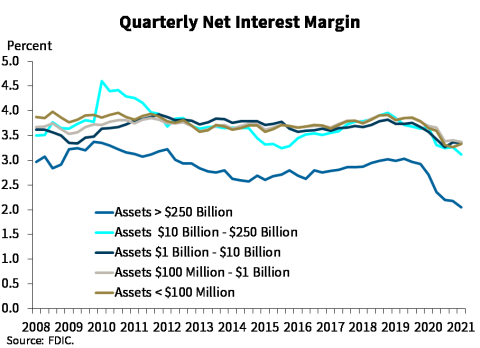
The industry’s net interest margin (NIM) continues to shrink. The industry NIM fell 57 basis points from a year ago to 2.56 percent, a new record low. Banks of all QBP asset size groups reported continued average NIM compression compared to year ago levels. The reduction in earning asset yields outpaced the reduction in funding costs, and both are at record lows this quarter.
The net interest margin for community banks also fell to a record low, declining 28 basis points from a year ago to 3.26 percent.
Chart 4:
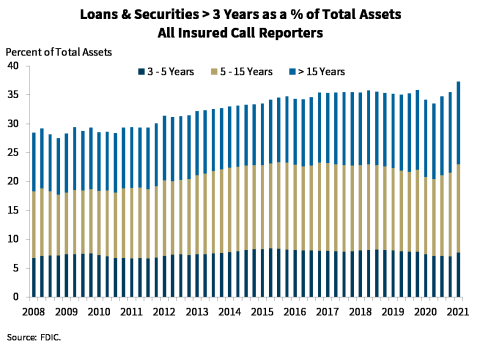
The share of longer-term assets continued to increase during the quarter, most of which was in securities with maturities of greater than 5 years. Banks have reacted to the prolonged low rate environment and reduced loan demand by investing in longer-term securities to limit net interest margin compression.
Chart 5:
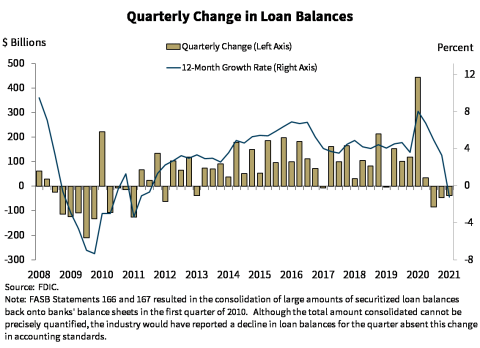
Loan balances declined $38.7 billion in first quarter 2021 from fourth quarter 2020. A reduction in credit card balances of $60.9 billion drove the decline. At the same time, Paycheck Protection Program loans, guaranteed by the Small Business Administration, grew $61.2 billion from the previous quarter to $469.4 billion.
Compared with first quarter 2020, loan balances declined 1.2 percent. This was the first annual loan contraction since third quarter 2011. Reductions in C&I loans and credit card balances drove the annual decrease.
Unlike the industry as a whole, community banks reported positive quarterly and annual loan growth. Their loan balances expanded 1.4 percent in the first quarter, compared to fourth quarter 2020, led by participation in the Paycheck Protection Program.
Chart 6:
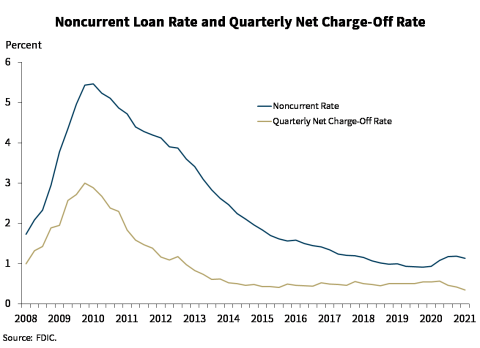
There were modest improvements in both the noncurrent rate and the net charge-off rate. The noncurrent loan rate declined 5 basis points from the previous quarter to 1.14 percent, driven by a decline in noncurrent commercial and industrial loans. The net charge-off rate declined 20 basis points from one year ago to 0.34 percent—just above the record low of 0.32 percent reported in first quarter 2006. A decline in credit card loan and commercial and industrial loan charge offs drove the annual reduction in net charge-off volume.
Community banks also reported a reduction in the noncurrent rate, which fell 8 bps from a year ago to 0.73 percent. However, for community banks, the noncurrent rate for nonfarm nonresidential real estate loans increased 8 basis points to 0.76 percent and the noncurrent rate for multifamily loans increased 4 basis points from a year ago to 0.30 percent.
Chart 7:
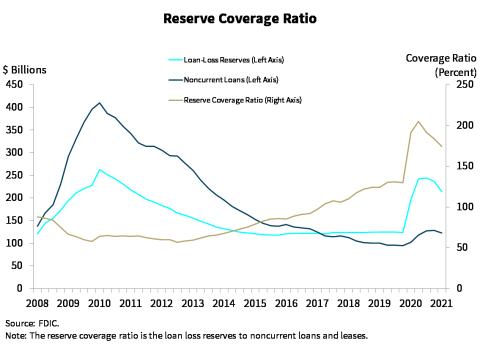
The level of loan-loss reserves in the industry declined in the first quarter, but remains substantially higher than pre-pandemic levels. The reserve coverage ratio for noncurrent loans declined 9 percentage points from the previous quarter to 174.2 percent. However, the current coverage ratio remains well above the Financial Crisis average of 79.1 percent.
Chart 8:
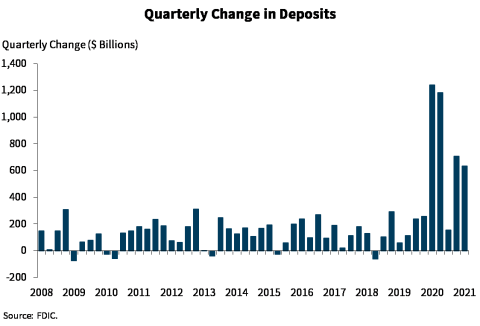
Deposit growth continues to be strong. Deposits increased by $635 billion or 3.6 percent in the first quarter 2021. The total volume of deposits increased to $18.5 trillion—the largest level on record.
Unprecedented deposit growth over the last several quarters has increased the industry’s liquidity position. Cash and due from balances rose $440 billion from the previous quarter, and total securities increased $367 billion, led by an increase in mortgage backed security holdings, which rose $220 billion.
Chart 9:
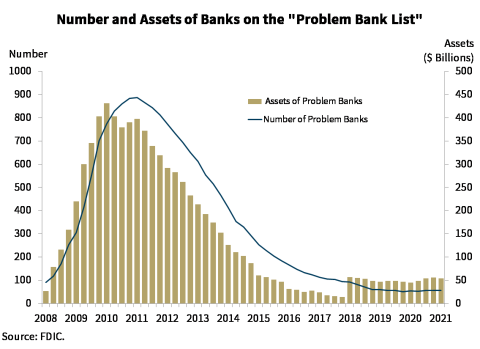
The number of banks on the FDIC’s “Problem Bank List” remained relatively flat from the previous quarter—declining by one to 55. The number of problem banks remains near historical lows.
Chart 10:
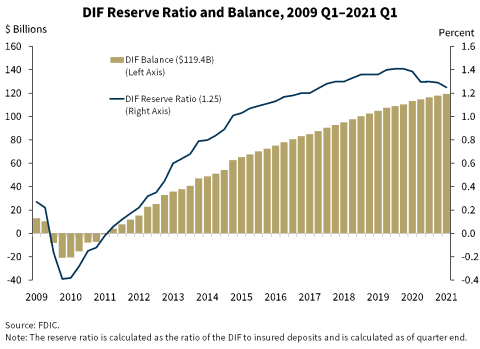
The Deposit Insurance Fund (DIF) balance was $119.4 billion as of March 31, up $1.5 billion from the end of the fourth quarter. The reserve ratio declined four basis points to 1.25 percent, solely because of strong estimated insured deposit growth. Estimated insured deposits grew by 4.4 percent during the first quarter 2021, continuing a trend of significant growth since first quarter 2020.
In accordance with the Restoration Plan, FDIC staff continues to closely monitor the factors that affect the reserve ratio and will provide progress reports and, as necessary, modifications to the plan to the Board at least semiannually.
Overall, the banking industry remains strong. Improved economic indicators and optimism about the pace of the economic recovery resulted in increased quarterly net income. The banking industry holds a record level of deposits and remains well positioned to support the country’s lending needs as the economy continues to recover. Asset quality metrics are favorable and capital levels are strong. Nevertheless, the continued low interest rate environment coupled with low loan demand will continue to present challenges for the banking industry.
We will now answer questions regarding first quarter performance.
Thank you.