Skip Header
U.S. flag

An official website of the United States government

Analysis

Custom Data Table Tool Instructions

Last Updated: October 25, 2022

The FDIC National Survey of Unbanked and Underbanked Households supports the FDIC's commitment to expanding Americans' access to safe, secure, and affordable banking services, which is integral to the FDIC's mission of maintaining the stability of and public confidence in the U.S. financial system. Conducted biennially since 2009 partly in response to a statutory mandate, the survey is administered in partnership with the U.S. Census Bureau.

You can use this tool to explore the data from all years of the household survey.

Resources:   Household Survey Home | Custom Data Table Tool | FAQs

Instructions

To start, follow the prompts in the custom data table tool.

  1. First, select the year, geography, and analysis variable.
    • Year: The tool includes data from each year of the survey (biennially since 2009).
    • Geography: Available geographic breakdowns include national, a single state, a single Metropolitan Statistical Area (MSA), and one of four census regions.
    • Analysis Variable:
      • Variable: The variable is the household behavior or subject of interest, such as Unbanked, Most common way to access account, or Used prepaid card. Due to changes in the survey over time, not all variables are available in each year.
      • Topic: For ease of use, the tool organizes variables by topic. For example, the topics in the 2021 data are Bank Account Ownership, Account Access Methods and Branch Visits, Bank and Nonbank Credit, Nonbank Financial Transaction Services, Nonbank Online Payment Services, and Prepaid Cards.
      • The user selects a topic and then a variable to be displayed in the table. By default, the tool provides a list of frequently used variables for each topic. Click the See all variables radio button for an expanded list of variables.
  2. After selecting the year, geography, topic, and variable, click the Get Table button. The table displayed on the screen contains a preselected set of row variables, such as race/ethnicity, education, and family income.
  3. To further refine or filter the data, click the Change Row Variables or Add Filter button located just above the table. Here you can change the row variables displayed in the table and/or add one or two filters to limit the data analyzed. For each filter selection, select a topic, variable, and the value(s) of the variable to filter on.
  4. After making your selections in the Change Row Variables or Add Filter box, click the Update Table button to generate a new table that reflects your additional selections.
  5. After generating a table on the screen, you can save the table as a PDF or spreadsheet (CSV) by clicking the appropriate file type next to Download As above or below the table.

Example:

Suppose you would like to make a table of estimated unbanked rates in 2021 among all U.S. households that used a prepaid card, by age group. The first step is to generate a table with your variable of interest, Unbanked. To do this, select Year = 2021, Geography = National, Topic = Bank Account Ownership, and Variable = Unbanked. Then click the Get Table button to produce the initial table shown below.

Screenshot showing the basic table
  • Depicted is a screenshot showing a table of estimated unbanked rates in 2019 among all U.S. households that used a prepaid card in the past 12 months, by age group.
  • The Title of the table is: Unbanked for Nation, 2019 by Selected Household Characteristics. The Subtitle is All Households.
  • The image of the table displays the following information:
    • The left column headers are: 1) All Households followed by a breakout of households by Race/Ethnicity(PCT): (Black, Hispanic, Asian, American Indian or Alaska Native, Native Hawaiian or Other Pacific Islander, White and Two or more races).
    • The row headers are: Number of Households (1000s), Number of Households (PCT), Unbanked, Has bank account.
    • The cells display the numeric information resulting from the intersection between the rows and columns described above.
    • The table information continues as the user scrolls down.
  • Two download options are located in the upper right of the screen above the table. They are: a) download PDF and b) Download Spreadsheet.

Unbanked for Nation, 2019 by Selected Household Characteristics

All Households

Change Row Variables or Add Filter
PDF Download PDF XLS Download Spreadsheet
Number of Households (1000s) Number of Households (PCT) Unbanked Has bank account
All Households 131248 100 5.4 94.6
Race/Ethnicity (PCT)
Black 16728 100 13.8 86.2
Hispanic 18352 100 12.2 87.8
Asian 7007 100 1.7 98.3
American Indian or Alaska Native 955 100 16.3 83.7
Native Hawaiian or Pacific Islander NA 100 NA NA
White 86152 100 2.5 97.5
Two or more races 1769 100 4.9 95.1
Age Group (PCT)

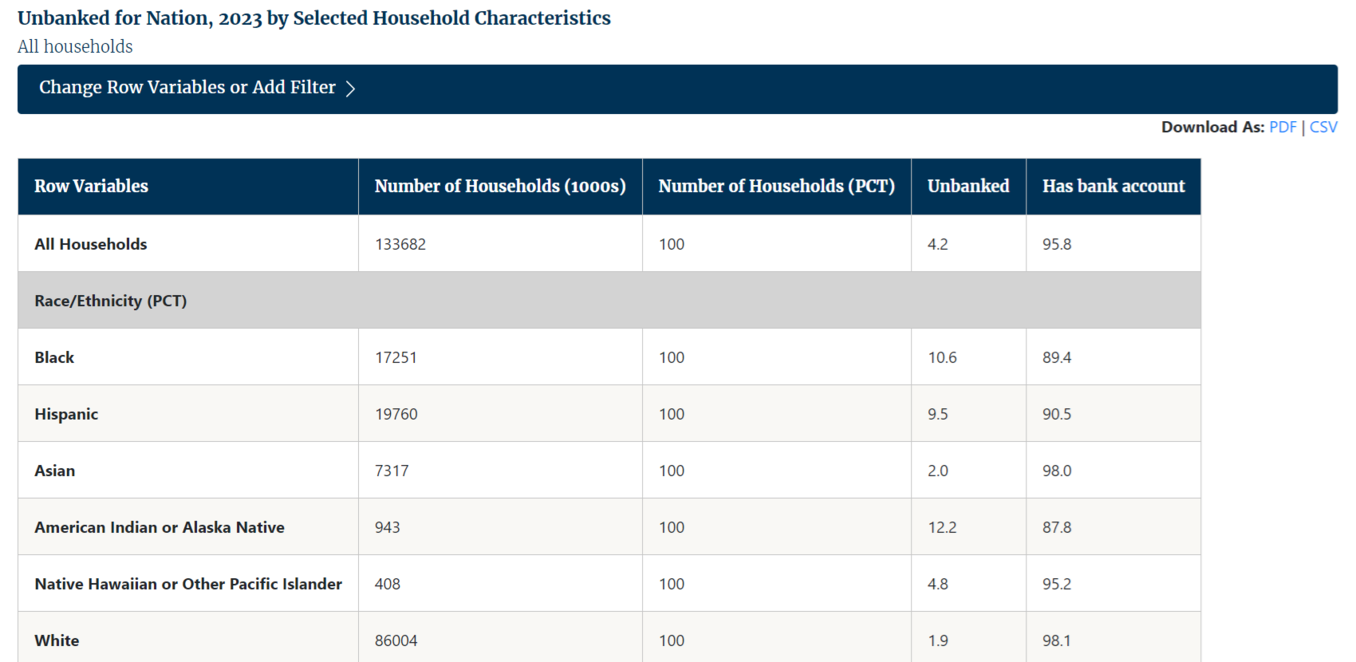
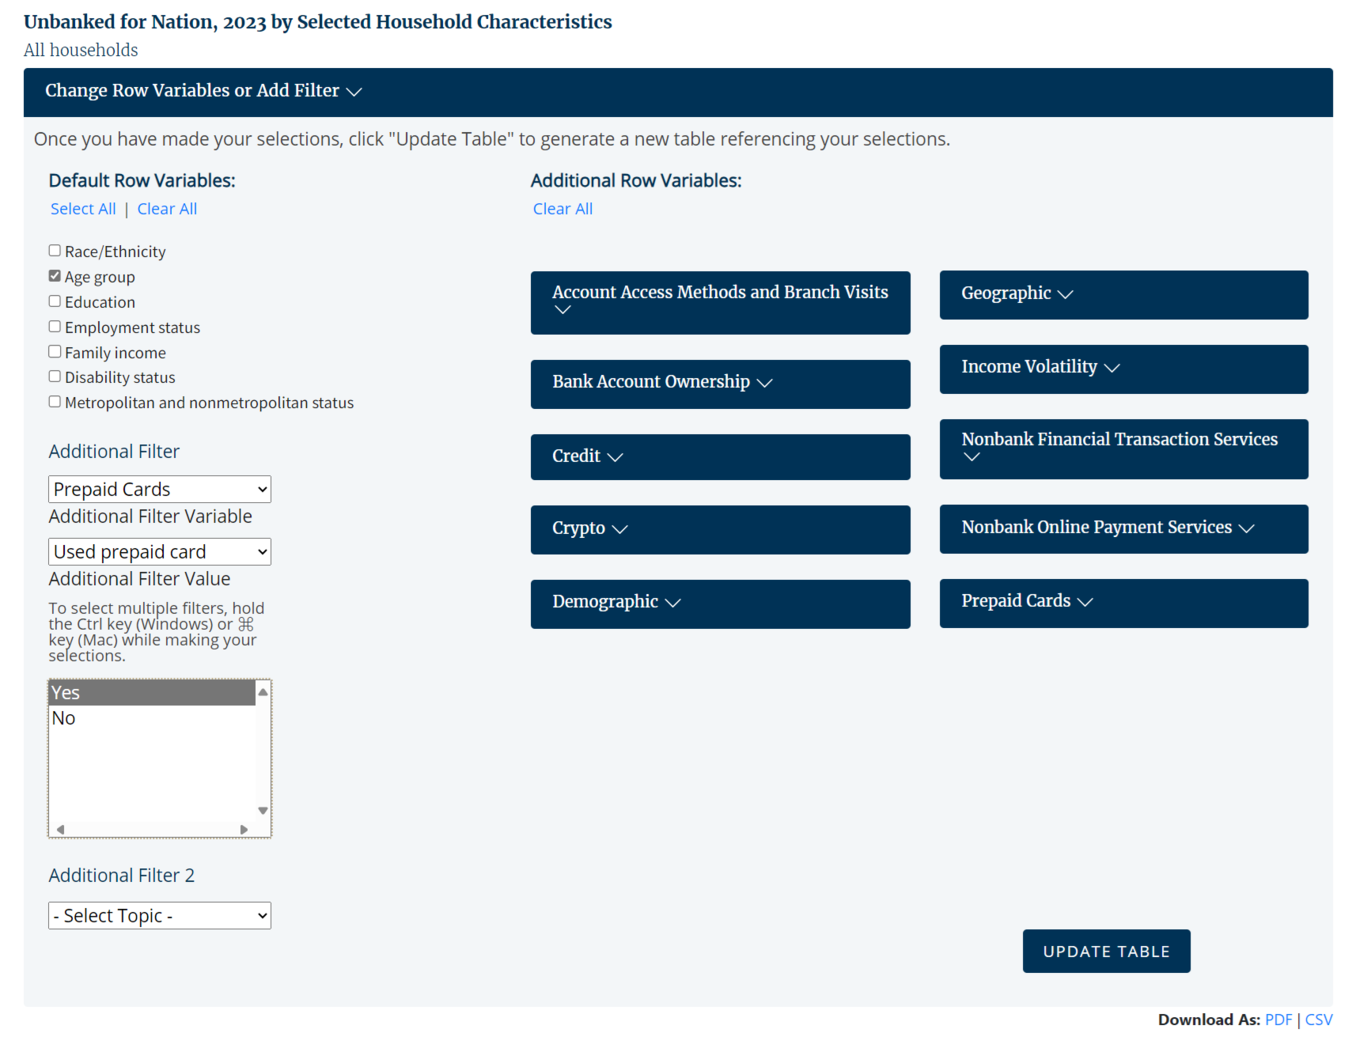
The table above shows estimated unbanked rates in 2021 among all U.S. households, as indicated in the table subtitle, “All Households.” To limit the table to include only households that used a prepaid card and to include only age group as a row variable, click the Change Row Variables or Add Filter button. Deselect all Default Row Variables except Age group, and under Additional Filter select Prepaid Cards, Used prepaid card, and the filter value, “Yes.”

Screenshot showing the change row variable or add filter options with the selections described above changed
  • Depicted is a screenshot showing a table of Unbanked Households for the Nation, 2019 by Selected Household Characteristics.
  • The title of the table is: Unbanked for Nation, 2019 by Selected Household Characteristics. The Subtitle is All Households.
  • The image of the table allows the user to filter selected variables in order to create a custom table.
  • The text introducing the table reads: 'Once you've made your selection, Click "Update Table" to generate a new table reflecting your additional selections'.
    • The left column filter is titled 'Default Row Variables'. There is a selection box entitled 'Additional Filter' with two drop down lists and directions on how to select multiple filters by holding the Ctrl key (windows) or the MAC command key ⌘.

Unbanked for Nation, 2019 by Selected Household Characteristics

Change Row Variables or Add Filter
  • Default Row Variables

    Select All | Clear All


    Additional Row Variables

    Clear All

    Account Access Methods and Branch Visits

    Bank Account Ownership

    Bank and Nonbank Credit

    Clarity and Satisfaction

    Demographic

    Geographic

    Income Volatility

    Nonbank Financial Transaction Services

    Prepaid Cards

    Saving for Unexpected Expenses or Emergencies


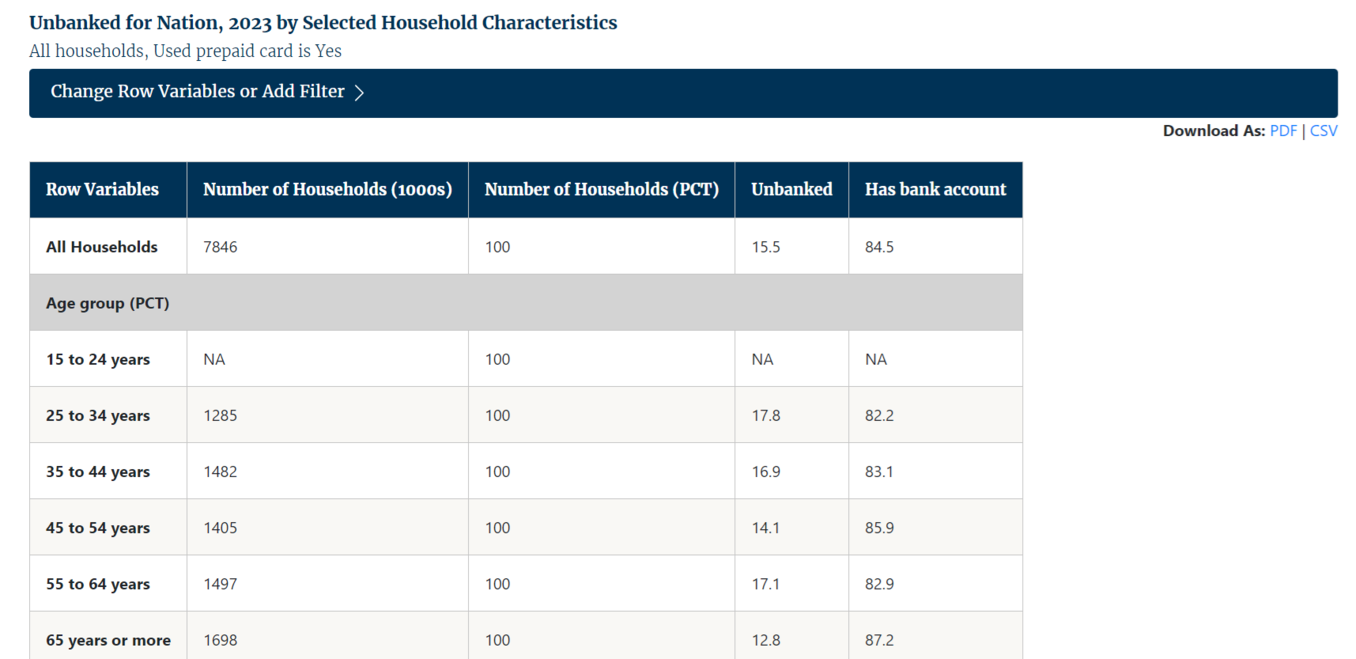
Finally, click the Update Table button to produce your table. As indicated in the table title and subtitle, the estimated unbanked rates in 2021 are among all U.S. households that used a prepaid card.

Screenshot showing table results of the filtered search
  • Depicted is a screenshot showing a table of Unbanked Households for the Nation, 2019 by Selected Household Characteristics.
  • The image of the table displays the following information:
    • The left column headers are: 1) All Households followed by a breakout of households by Age Group (PCT).
    • The row headers are: Number of Households (1000s), Number of Households (PCT), Unbanked, Has bank account.
    • The cells display the numeric information resulting from the intersection between the rows and columns described above.

Unbanked for Nation, 2019 by Selected Household Characteristics

All Households, Prepaid Card in last 12 months is yes

Change Row Variables or Add Filter
PDF Download PDF XLS Download Spreadsheet
Row Variables Number of Households (1000s) Number of Households (PCT) Unbanked Has bank account
All Households 11174 100 17.5 82.5
Age Group (PCT)
15 to 24 years 728 100 22.6 77.4
25 to 34 years 2265 100 23.8 76.2
35 to 44 years 2272 100 20.2 79.8
45 to 54 years 2191 100 14.4 85.6
55 to 64 years 1982 100 17.7 82.3
65 years or more 1736 100 7.4 92.6

For additional information, please see the Custom Data Table Tool Frequently Asked Questions. You may also submit a question or a request for technical support.