DIF Balance Sheet - Second Quarter 2022
| Balance Sheet | |||||
|---|---|---|---|---|---|
| Jun-22 | Dec-21 | Quarterly Change | Mar-21 | Year-Over-Year Change | |
| Cash and cash equivalents | $6,694 | $5,802 | $892 | $5,361 | $1,333 |
| Investment in U.S. Treasury securities | 114,574 | 114,230 | 344 | 111,991 | 2,583 |
| Assessments receivable | 1,968 | 1,818 | 150 | 1,755 | 213 |
| Interest receivable on investments and other assets, net | 792 |
776 |
16 |
832 |
(40) |
| Receivables from resolutions, net | 733 |
815 |
(82) |
908 |
(175) |
| Property and equipment | 348 |
326 |
22 |
320 |
28 |
| Operating lease right-of-use assets | 73 |
80 |
(7) |
100 |
(27) |
| Total Assets | $125,182 |
$123,847 |
$1,335 |
$121,267 |
$3,915 |
| Accounts payable and other liabilities | 248 |
245 |
3 |
235 |
13 |
| Operating lease liabilities | 77 |
85 |
(8) |
107 |
(30) |
| Liabilities due to resolutions | 1 |
1 |
0 |
7 |
(6) |
| Postretirement benefit liability | 332 |
332 |
0 |
336 |
(4) |
| Contingent liability for anticipated failures | 66 |
145 |
(79) |
35 |
31 |
| Contingent liability for litigation losses | 0 |
0 |
0 |
0 |
0 |
| Total Liabilities | $724 |
$808 |
($84) |
$720 |
$4 |
| FYI: Unrealized gain (loss) on U.S. Treasury securities, net | (2,382) |
(1,835) |
(547) |
552 |
(2,934) |
| FYI: Unrealized postretirement benefit (loss) gain | (83) |
(83) |
0 |
(98) |
15 |
| Fund Balance | $124,458 |
$123,039 |
$1,419 |
$120,547 |
$3,911 |

| 3Q 2020 | 4Q 2020 | 1Q 2021 | 2Q2021 | 3Q2021 | 4Q2021 | 1Q 2022 | 2Q 2022 | |
|---|---|---|---|---|---|---|---|---|
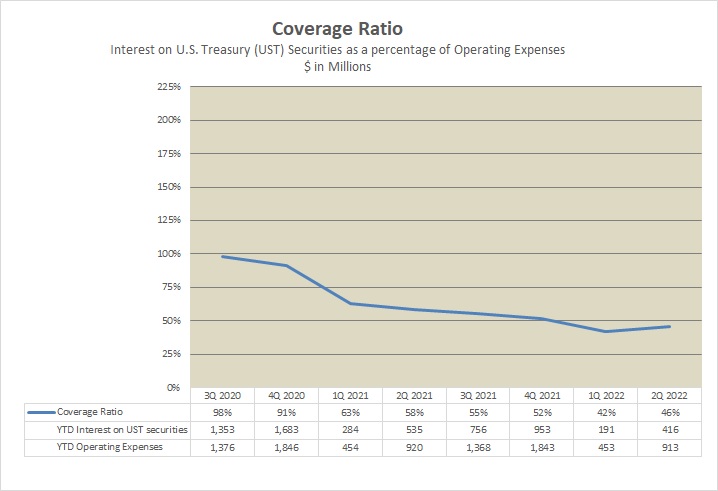
| Coverage Ratio | 98% | 91% | 63% | 58% | 55% | 52% | 42% | 46% |
| YTD Interest on UST securities | 1,353 | 1,683 | 284 | 535 | 756 | 953 | 191 | 416 |
| YTD Operating Expenses | 1,376 | 1,846 | 454 | 920 | 1,368 | 1,843 | 453 | 913 |
Overnight interest has meaningfully increased, as the Federal Open Market Committee raised rates twice during the second quarter and reiterated its commitment to fighting inflation. Yields on longer term securities have also increased, however, the majority of the current holdings were captured in a lower rate environment. The portfolio's future maturities are likely be reinvested in higher yielding securities as nearly 30% of the portfolio is scheduled to mature in the second half of the year.
