DIF Balance Sheet - Third Quarter 2023
| Balance Sheet | |||||
|---|---|---|---|---|---|
| Sep-23 | Jun-23 | Quarterly Change | Sep-22 | Year-Over-Year Change | |
| Cash and cash equivalents | $30,230 | $25,353 | $4,877 | $5,767 | $24,463 |
| Investment in U.S. Treasury securities | 52,215 | 53,459 | (1,244) | 116,572 | (64,357) |
| Assessments receivable | 3,273 | 3,231 | 42 | 2,101 | 1,172 |
| Special Assessments receivable | 16,274 |
15,776 |
498 |
0 |
16,274 |
| Interest receivable on investments and other assets, net | 350 |
286 |
64 |
745 |
(395) |
| Receivables from resolutions, net | 158,395 |
159,468 |
(1,073) |
590 |
158,805 |
| Property and equipment | 368 |
366 |
2 |
355 |
13 |
| Operating lease right-of-use assets | 79 |
81 |
(2) |
98 |
(19) |
| Total Assets | $261,184 |
$258,020 |
$3,164 |
$126,228 |
$134,956 |
| Accounts payable and other liabilities | 401 |
256 |
145 |
259 |
142 |
| Operating lease liabilities | 100 |
101 |
(1) |
114 |
(14) |
| Liabilities due to resolutions | 140,311 |
140,242 |
69 |
0 |
140,311 |
| Postretirement benefit liability | 232 |
232 |
0 |
332 |
(100) |
| Contingent liability for anticipated failures | 801 |
220 |
581 |
65 |
736 |
| Contingent liability for litigation losses | 0 |
1 |
(1) |
1 |
(1) |
| Total Liabilities | $141,845 |
$141,052 |
$793 |
$771 |
$141,074 |
| FYI: Unrealized gain (loss) on U.S. Treasury securities, net | (667) |
(1,007) |
340 |
(3,459) |
2,792 |
| FYI: Unrealized postretirement benefit (loss) gain | 27 |
27 |
0 |
(83) |
110 |
| Fund Balance | $119,339 |
$116,968 |
$2,371 |
$125,457 |
($6,118) |

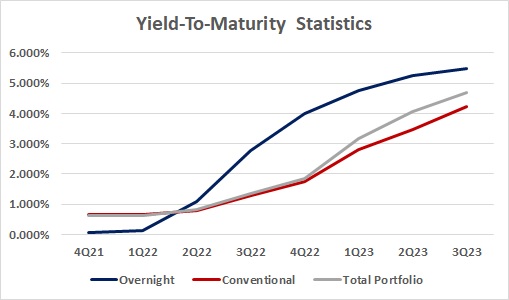
The portfolio’s yield has experienced a dramatic shift with rising interest rates over the last year. This quarter’s increase can be attributed to both the Federal Open Market Committee’s last rate hike, a heavy concentration of funds in the overnight portfolio, and taking an impairment on certain securities in the conventional portfolio.
| Overnight | Conventional | Total Portifio | |
|---|---|---|---|
| 4Q21 | 0.061% | 0.661% | 0.633% |
| 1Q22 | 0.132% | 0.667% | 0.641% |
| 2Q22 | 1.095% | 0.805% | 0.821% |
| 3Q22 | 2.758% | 1.282% | 1.351% |
| 4Q22 | 4.005% | 1.761% | 1.865% |
| 1Q23 | 4.755% | 2.811% | 3.163% |
| 2Q23 | 5.262% | 3.471% | 4.046% |
| 3Q23 | 5.475% | 4.234% | 4.689% |
