Selected Financial Data - Second Quarter 2020
| Jun-20 | Mar -19 | Quarterly Change | Jun -19 | Year-Over-Year Change |
|---|---|---|---|---|---|
| FSLIC Resolution Fund | |||||
| Cash and cash equivalents | $926 | $926 | $0 | $912 | $14 |
| Accumulated deficit | (124,563) | (124,563) | 0 | (124,576) | 13 |
| Total resolution equity | 907 | 926 | (19) | 913 | (6) |
| Total revenue | 3 | 3 | 0 | 11 | (8) |
| Operating expenses | 0 | 0 | 0 | 0 | 0 |
| Recovery of tax benefits | 0 | 0 | 0 | 0 | 0 |
| Losses related to thrift resolutions | 0 | 0 | 0 | 0 | 0 |
| Net Income (Loss) | $3 | $3 | $0 | $11 | ($8) |
$ in millions | DIF | FRF | ALL FUNDS | ||||||
|---|---|---|---|---|---|---|---|---|---|
| Jun-20 | Jun-19 | Change | Jun-20 | Jun-19 | Change | Jun-20 | Jun-19 | Change | |
| Total Receiverships | 244 | 263 | (19) | 0 | 0 | 0 | 244 | 263 | (19) |
| Assets in Liquidation | $380 | $1,039 | ($659) | $1 | $2 | ($1) | $381 | $1,041 | ($660) |
| YTD Collections | $285 | $555 | ($270) | $1 | $0 | $1 | $286 | $555 | ($269) |
| YTD Dividend/Other Pmts - Cash | $797 | $859 | ($62) | $0 | $0 | $0 | $797 | $859 | ($62) |

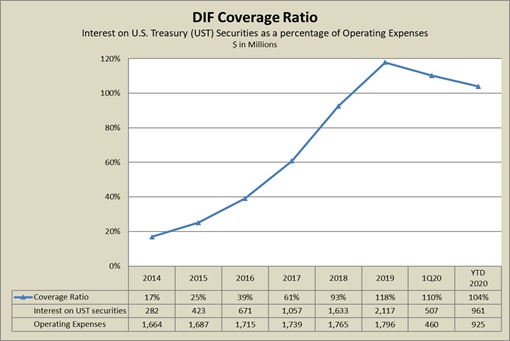
Coverage Ratio | Interest on UST securities | Operating Expenses | |
|---|---|---|---|
| 2014 | 17% | 282 | 1,664 |
| 2015 | 25% | 423 | 1,687 |
| 2016 | 39% | 671 | 1,715 |
| 2017 | 61% | 1,057 | 1,739 |
| 2018 | 93% | 1,633 | 1,765 |
| 2019 | 118% | 2,117 | 1,796 |
| 1Q20 | 110% | 507 | 460 |
| YTD 2020 | 104% | 961 | 925 |
The coverage ratio peaked in 2019 at 118%, after years of seeing a steady rise. Since 2014, the DIF balance has grown by over 80% and therefore has generated an increasing amount of interest income. Secondarily, Treasury yields remained below their historical averages, but did gradually rise from 2015 to 2018. However in 2019, yields dropped slowly, then in March 2020, the entire yield curve suffered extraordinary downward pressure as the FOMC slashed the overnight Fed Funds rate to nearly zero to support the economy.
While the investment portfolio balance should continue to grow at a slower pace, the maturing securities purchased at past higher yields can only be reinvested in significantly lower yields. Interest revenue in the coming quarters is expected to decrease as the Federal Funds Target Rate sits between 0bps and 25bps, and the 5-year tenor is yielding approximately 30.6bps.
