
Selected Financial Data - Fourth Quarter 2019
Dec-19 | Sep -19 | Quarterly Change | Dec -18 | Year-Over-Year Change | |
|---|---|---|---|---|---|
| FSLIC Resolution Fund | |||||
| Cash and cash equivalents | $923 | $918 | $5 | $902 | $21 |
| Accumulated deficit | (124,566) | (124,570) | 4 | (124,587) | 21 |
| Total resolution equity | 923 | 919 | 4 | 902 | 21 |
| Total revenue | 20 | 17 | 3 | 17 | 3 |
| Operating expenses | 1 | 0 | 1 | 0 | 1 |
| Recovery of tax benefits | (1) | 0 | (1) | 0 | (1) |
| Losses related to thrift resolutions | 0 | 0 | 0 | 0 | 0 |
| Net Income (Loss) | $21 | $17 | $4 | $17 | $4 |
| $ in millions | DIF | FRF | ALL FUNDS | ||||||
|---|---|---|---|---|---|---|---|---|---|
Dec-19 | Dec-18 | Change | Dec-19 | Dec-18 | Change | Dec-19 | Dec-18 | Change | |
| Total Receiverships | 248 | 272 | (24) | 0 | 0 | 0 | 248 | 272 | (24) |
| Assets in Liquidation | $524 | $1,176 | ($652) | $ 0 | $ 2 | $ (2) | $524 | $1,178 | ($654) |
| YTD Collections | $1,341 | $1,449 | ($108) | $2 | $ 1 | $ 1 | $1,343 | $1,450 | ($107) |
| YTD Dividend/Other Pmts - Cash | $1,675 | $3,252 | ($1,577) | $ 0 | $ 0 | $ 0 | $1,675 | $3,252 | ($1,577) |
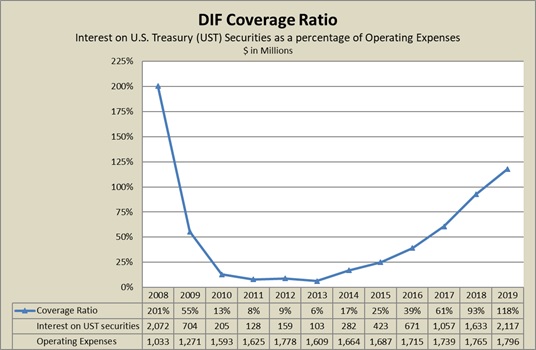
| DIF Coverage Ratio Interest on U.S. Treasury (UST) Securities as a percentage of Operating Expenses ($ in millions) | |||
|---|---|---|---|
Coverage Ratio | Interest on UST securities | Operating Expenses | |
| 2008 | 201% | 2,072 | 1,033 |
| 2009 | 55% | 704 | 1,271 |
| 2010 | 13% | 205 | 1,593 |
| 2011 | 8% | 128 | 1,625 |
| 2012 | 9% | 159 | 1,778 |
| 2013 | 6% | 103 | 1,609 |
| 2014 | 17% | 282 | 1,664 |
| 2015 | 25% | 423 | 1,687 |
| 2016 | 39% | 671 | 1,715 |
| 2017 | 61% | 1,057 | 1,739 |
| 2018 | 93% | 1,633 | 1,765 |
| 2019 | 118% | 2,117 | 1,796 |
Since 2013, the coverage ratio has steadily risen as a result of significant increases in interest revenue of U.S. Treasury securities (an annual average increase of 79%), nominally offset by increases in operating expenses (an annual average increase of 2%).
Increases in interest revenue of U.S. Treasury securities are due largely to steady growth in the investment portfolio balance.