DIF Balance Sheet - Fourth Quarter 2019
|
|
| Quarterly |
| Year-Over-Year |
|---|---|---|---|---|---|
| Balance Sheet | |||||
| Cash and cash equivalents | $5,991 | $4,268 | $1,723 | $5,774 | $217 |
| Investment in US Treasury securities | 100,072 | 100,873 | (801) | 92,708 | 7,364 |
| Assessments receivable | 1,242 | 1,115 | 127 | 1,376 | (134) |
| Interest receivable on investments and other assets, net | 1,021 | 582 | 439 | 550 | 471 |
| Receivables from resolutions, net | 2,669 | 2,801 | (132) | 3,058 | (389) |
| Property and equipment, net | 330 | 317 | 13 | 329 | 1 |
| Total Assets | $111,325 | $109,956 | $1,369 | $103,795 | $7,530 |
| Accounts payable and other liabilities | 215 | 212 | 3 | 198 | 17 |
| Liabilities due to resolutions | 346 | 427 | (81) | 605 | (259) |
| Postretirement benefit liability | 289 | 236 | 53 | 236 | 53 |
| Contingent liability for anticipated failures | 94 | 108 | (14) | 114 | (20) |
| Contingent liability for guarantee payments and litigation losses | 34 | 33 | 1 | 33 | 1 |
| Total Liabilities | $978 | $1,016 | $(38) | $1,186 | $(208) |
| FYI: Unrealized gain (loss) on US Treasury securities, net | 587 | 586 | 1 | (615) | 1,202 |
| FYI: Unrealized postretirement benefit (loss) gain | (61) | (14) | (47) | (14) | (47) |
| Fund Balance | $110,347 | $108,940 | $1,407 | $102,609 | $7,738 |

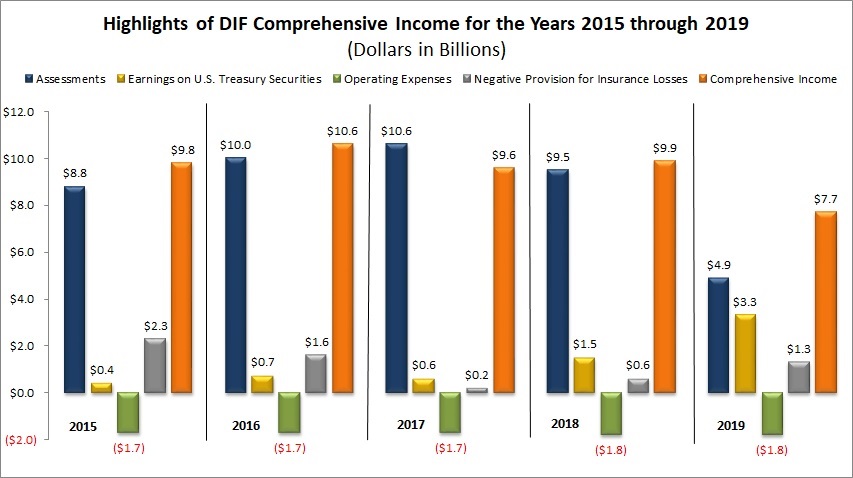
Assessments | Earnings on U.S. Treasury Securities | Operating Expenses | Negative Provision for Insurance Losses | Comprehensive Income | |
|---|---|---|---|---|---|
| 2015 | $8.8 | $0.4 | ($1.7) | $2.3 | $9.8 |
| 2016 | $10.0 | $0.7 | ($1.7) | $1.6 | $10.6 |
| 2017 | $10.6 | $0.6 | ($1.7) | $0.2 | $9.6 |
| 2018 | $9.5 | $1.5 | ($1.8) | $0.6 | $9.9 |
| 2019 | $4.9 | $3.3 | ($1.8) | $1.3 | $7.7 |
The mix of the DIF 2019 Comprehensive Income components is notably different from the prior 4 years presented in 2 of the 4 categories. Assessment Revenue is just over half of the prior 4 year average, reflecting the cessation of surcharge assessments, lower assessment rates, and the application of small bank credits. Earnings on the DIF investment portfolio, however, continue to increase, with 2019 posting a high not seen since 2008. Operating expenses have remained relatively constant, and the DIF is still benefiting from negative provisions due to reductions in estimated losses from past failures.
