
DIF Balance Sheet - Fourth Quarter 2020
| Dec-20 | Sep-19 | Quarterly Change | Dec-19 | Year-Over-Year Change |
|---|---|---|---|---|---|
| Balance Sheet | |||||
| Cash and cash equivalents | $3,311 | $6,801 | ($3,490) | $5,991 | ($2,680) |
| Investment in US Treasury securities | 110,464 | 105,830 | 4,634 | 100,072 | 10,392 |
| Assessments receivable | 1,949 | 1,902 | 47 | 1,242 | 707 |
| Interest receivable on investments and other asses, net | 1,159 | 864 | 295 | 1,021 | 138 |
| Receivables from resolutions, net | 1,367 | 1,352 | 15 | 2,669 | (1,302) |
| Property and equipment, net | 321 | 314 | 7 | 330 | (9) |
| Operating lease right-of-use assets | 112 | 115 | (3) | 0 | 112 |
| Total Assets | 118,683 | 117,178 | 1,505 | 111,325 | 7,358 |
| Accounts payable and other liabilities | 251 | 234 | 17 | 215 | 36 |
| Operating lease liabilities | 119 | 122 | (3) | 0 | 119 |
| Liabilities due to resolutions | 11 | 5 | (4) | 346 | (34) |
| Postretirement benefit liability | 336 | 289 | 47 | 289 | 47 |
| Contingent liabilty for anticipated failures | 79 | 62 | 17 | 94 | (15) |
| Contingent liabilty for guarantee payments and litigaton losses | 0 | 32 | (32) | 34 | (34) |
| Total Liabilities | 786 | 744 | (42) | 978 | (192) |
| FYI: Unrealized gain (loss) on US Treasury securities, net | 1,070 | 1,370 | (300) | 587 | 483 |
| FYI: Unrealized postretirement benefit (loss) gain | (98) | (61) | (37) | (61) | (37) |
| Fund Balance | $117,897 | $116,434 | $1,463 | $110,347 | $7,550 |
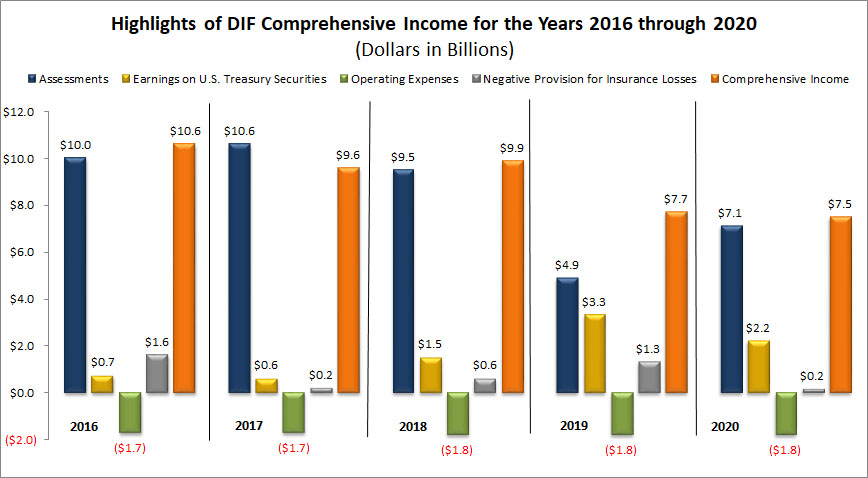
| 2016 | 2017 | 2018 | 2019 | 2020 |
|---|---|---|---|---|---|
| Assessments | $10.0 | $10.6 | $9.5 | $4.9 | $7.1 |
| Earnings on U.S. Treasury Securities | $0.7 | $0.6 | $1.5 | $3.3 | $2.2 |
| Operating Expenses | ($1.7) | ($1.7) | ($1.8) | ($1.8) | ($1.8) |
| Negative Provision for Insurance Losses | $1.6 | $0.2 | $0.6 | $1.3 | $0.2 |
| Comprehensive Income | $10.6 | $9.6 | $9.9 | $7.7 | $7.5 |
While 2020 comprehensive income was relatively consistent with 2019, the contribution mix from 3 of the 4 components varied significantly. Assessment revenue increased in 2020, however, the negative provision for insurance losses and earnings on UST securities decreased. The increase in assessment revenue resulted from the combination of assessment base growth, higher assessment rates, and the wind-down of small bank credit usage. The negative provision for losses declined in 2020 as a result of lower reductions to the estimated losses for prior year failures. In addition, the decrease in earnings on UST securities was attributable to the reinvestment of matured securities at record low yields.