
DIF Balance Sheet - First Quarter 2019
|
|
| Quarterly |
| Year-Over-Year |
|---|---|---|---|---|---|
| Balance Sheet | |||||
| Cash and cash equivalents | $7,062 | $5,774 | $1,288 | $3,119 | $3,943 |
| Investment in U.S. Treasury securities | 93,507 | 92,708 | 799 | 84,831 | 8,676 |
| Assessments receivable | 1,372 | 1,376 | (4) | 2,783 | (1,411) |
| Interest receivable on investments and other assets, net | 567 | 550 | 17 | 581 | (14) |
| Receivables from resolutions, net | 3,187 | 3,058 | 129 | 5,194 | (2,007) |
| Property and equipment, net | 324 | 329 | (5) | 325 | (1) |
| Total Assets | $106,019 | $103,795 | $2,224 | $96,833 | $9,186 |
| Accounts payable and other liabilities | 211 | 198 | 13 | 200 | 11 |
| Liabilities due to resolutions | 554 | 605 | (51) | 1,154 | (600) |
| Postretirement benefit liability | 236 | 236 | (0) | 259 | (23) |
| Contingent liability for anticipated failures | 115 | 114 | 1 | 113 | 2 |
| Contingent liability for guarantee payments and litigation losses | 33 | 33 | (0) | 35 | (2) |
| Total Liabilities | $1,149 | $1,186 | ($37) | $1,761 | ($612) |
| FYI: Unrealized gain (loss) on U.S. Treasury securities, net | (194) | (615) | 421 | (975) | 781 |
| FYI: Unrealized postretirement benefit (loss) gain | (14) | (14) | 0 | (46) | 32 |
| Fund Balance | $104,870 | $102,609 | $2,261 | $95,072 | $9,798 |
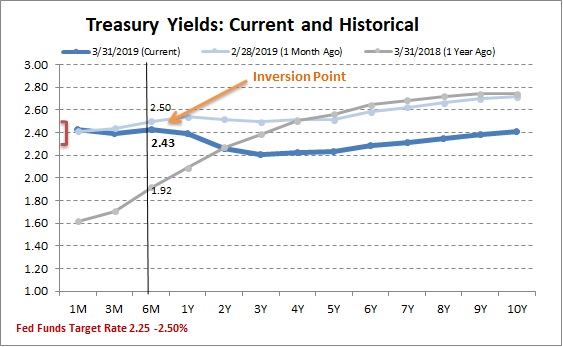
| 3/31/2019 | 02/28/2019 | 03/31/2018 |
|---|---|---|---|
| 1M | 2.43 | 2.41 | 1.62 |
| 3M | 2.39 | 2.44 | 1.71 |
| 6M | 2.43 | 2.50 | 1.92 |
| 1Y | 2.39 | 2.54 | 2.09 |
| 2Y | 2.26 | 2.52 | 2.27 |
| 3Y | 2.21 | 2.50 | 2.38 |
| 4Y | 2.23 | 2.51 | 2.50 |
| 5Y | 2.23 | 2.51 | 2.56 |
| 6Y | 2.29 | 2.58 | 2.65 |
| 7Y | 2.31 | 2.62 | 2.69 |
| 8Y | 2.35 | 2.66 | 2.72 |
| 9Y | 2.38 | 2.70 | 2.74 |
| 10Y | 2.41 | 2.72 | 2.74 |
The Treasury yield curve is now inverted reflecting concerns about economic growth both in the U.S. and internationally. The short end of the curve is anchored due to the current Fed Funds Target which is set to 2.25-2.50%. The inversion which starts in the 6-month sector became stronger in February and reflects growing concerns for a mild recession in 2020 and market speculation that there will be no Fed rate hikes and even the possibility of a cut in the next year. At the same time, inflation remains muted which is keeping yields for the longer maturity sectors down and fairly flat.