
Quarterly Banking Profile - Third Quarter 2023
I am pleased to report on the release of third quarter 2023 performance results for FDIC–insured institutions.
The banking industry continued to show resilience in the third quarter. Net income remained high, overall asset quality metrics remained favorable, and the industry remained well capitalized. Despite a modest improvement in the industry’s net interest margin, funding pressures continued to challenge the industry.
In the third quarter, the banking industry’s net income was $68.4 billion, a decrease of $2.4 billion from last quarter. But after adjusting for non–recurring accounting gains, the industry’s profitability has been remarkably stable for the past year. In the first two quarters of this year, the industry’s noninterest income was boosted by the accounting treatment of the acquisition of the three large failed banks. Without these non–recurring gains, net income would have been right around $68 billion—a high level by historical standards—for the past four quarters.
For community banks, third quarter net income declined from the prior quarter as higher losses on the sale of securities and higher noninterest expenses more than offset higher noninterest income. Community banks also reported lower net income compared to a year ago.
After declining in the prior two quarters, the industry’s net interest margin increased modestly in the third quarter. Although this is an improvement, it largely reflects stabilization in the cost of non–deposit liabilities this quarter as the cost of deposits increased more than the yield on loans. The net interest margin for community banks declined for the third consecutive quarter, driven by lagging earning asset yields.
In the third quarter, domestic deposits declined for the sixth consecutive quarter, though the outflow of deposits continued to moderate from the large outflows experienced in the first quarter. The level of liquid assets fell in the third quarter due to a reduction in securities portfolios.
The Deposit Insurance Fund (DIF) balance was $119.3 billion on September 30, approximately $2.4 billion higher than at the end of the second quarter. The reserve ratio—the fund balance relative to insured deposits—increased by two basis points to 1.13 percent, as insured deposits increased by just 0.1 percent during the quarter. The reserve ratio currently remains on track to reach the 1.35 percent minimum reserve ratio by the statutory deadline of September 30, 2028.
Unrealized losses on available–for–sale and held–to–maturity securities increased to $683.9 billion in the third quarter. Higher market interest rates and mortgage rates caused market values for debt to decline during the quarter.
Though the U.S. economy has remained strong in 2023, the banking industry still faces significant downside risks from the continued effects of inflation, rising market interest rates, and geopolitical uncertainty. These issues could cause credit quality, earnings, and liquidity challenges for the industry.
In addition, deterioration in the industry’s commercial real estate portfolio is beginning to materialize in office properties, in which weak demand for space, softening property values, and higher interest rates are affecting the credit quality of underlying loans. Total noncurrent non–owner–occupied commercial real estate loans increased 36.4 percent from last quarter, and the noncurrent rate for these loans is the highest since third quarter 2014. Higher interest rates pose risks for other commercial real estate properties as well, as maturing fixed–rate loans will need to be renewed at what are now much higher market interest rates.
These issues, together with funding and earnings pressures, will remain matters of ongoing supervisory attention by the FDIC.
Chart 1:
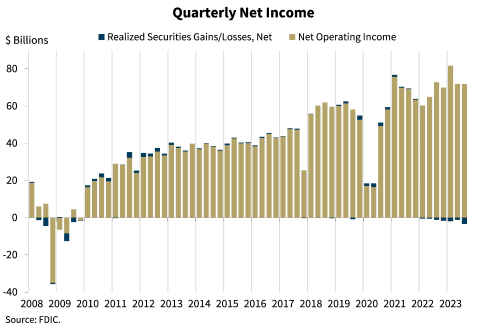
As shown in this chart, the banking industry reported net income of $68.4 billion in the third quarter, down $2.4 billion (or 3.4 percent) from the prior quarter. First and second quarter noninterest income benefitted from the accounting treatment for the acquisition of three large bank failures this spring. Excluding these one–time items, net income would have been roughly flat for the past four quarters. The industry also reported higher realized losses on securities compared to last quarter, mostly from one large financial institution selling its securities portfolio to re–invest at higher rates.
Community banks reported a decline of 4.8 percent in net income from last quarter as higher losses on the sale of securities and higher noninterest expenses more than offset higher noninterest income.
Chart 2:
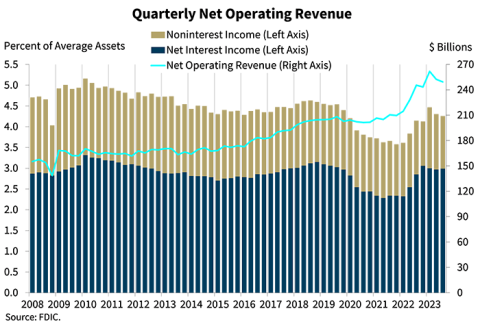
Our next chart shows that quarterly net operating revenue fell 1.3 percent from second quarter 2023 to $249.3 billion. Net interest income as a percentage of average assets increased from the previous quarter and is above the pre–pandemic average.1 Noninterest income decreased by $4.1 billion, or 5.2 percent, largely from the accounting gain from the failed–bank acquisition last quarter that I mentioned earlier.
Chart 3:
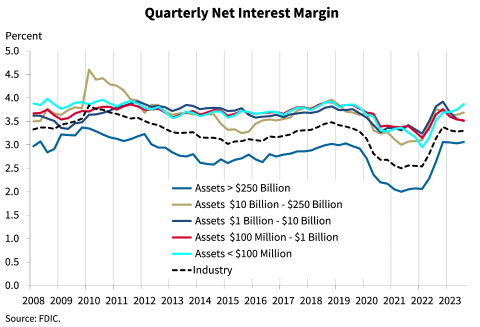
The next chart shows the net interest margin for the industry and the five asset size groups on which the Quarterly Banking Profile reports. The industry’s net interest margin increased three basis points from last quarter to 3.30 percent, and is five basis points above the pre–pandemic average. Though deposit costs increased more than loan yields in the third quarter, the stabilization in the cost of non–deposit liabilities helped to moderate the industry’s overall cost of funds.
The net interest margin for community banks declined four basis points from the second quarter to 3.35 percent. This is the third straight quarter of NIM decline at community banks, driven by loan yields that have lagged deposit costs.
Chart 4:
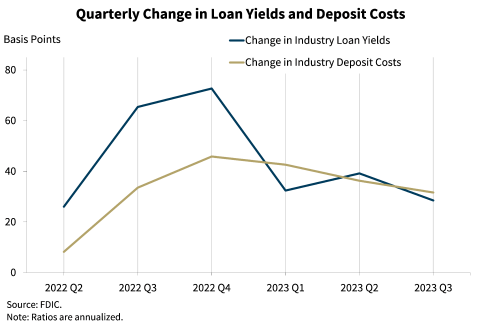
The next chart shows the quarter–over–quarter changes in the industry’s yield on loans and cost of deposits. Both loan yields and deposit costs began to increase in 2022 when market interest rates started to increase. In the last three quarters of 2022, industry loan yields rose much faster than deposit costs, which is typical for the industry early in a period of increasing market interest rates. In the first three quarters of 2023, however, loan yields have increased more in line with deposit costs, and deposit costs outpaced loan yields by three basis points in the third quarter. This year the banking industry has reported a sizeable shift from lower–yielding deposit accounts such as transaction and savings accounts into higher–yielding time deposits, a trend that continued in the third quarter. However, the cost of non–deposit liabilities, which increased substantially last quarter, was stable this quarter, helping the industry to improve its net interest margin modestly.
Community banks reported a decline in NIM of four basis points caused primarily by a 27 basis–point increase in deposit costs paired with just a 19 basis–point increase in loan yields.
Chart 5:
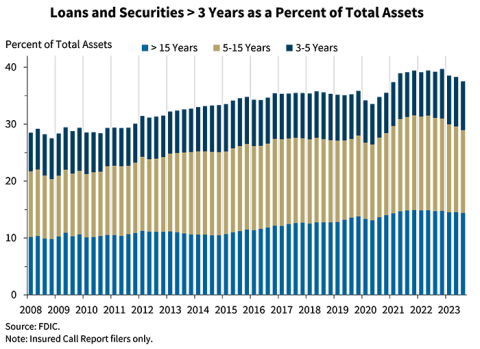
The next chart shows that the banking industry’s holdings of longer–term loans and securities declined for a third consecutive quarter. The ratio of longer–term assets to total assets is 37.5 percent, still above the pre–pandemic average of 35.0 percent. The quarterly decline was led by a reduction in securities portfolios. Loans and securities with fixed, lower yields may pressure earnings in coming quarters.
Compared with the industry, community banks continued to report a higher proportion of assets with maturities longer than three years at 51.8 percent of total assets. This higher level of longer–term assets helps to explain community banks’ lagging loan and earning asset yields in relation to those of the industry.
Chart 6:
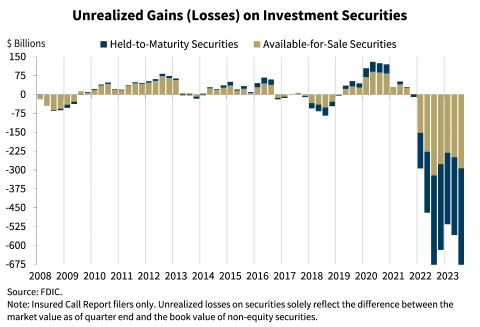
This chart shows the elevated level of unrealized losses on investment securities that has persisted in the industry since market interest rates began to rise in early 2022. Unrealized losses on available–for–sale and held–to–maturity securities totaled $683.9 billion in the third quarter, up 22.5 percent from the prior quarter, primarily due to an increase in mortgage rates. These unrealized losses represent a drag on future earnings as these securities tend to be long term and fixed rate, while funding costs continue to increase.
Chart 7:
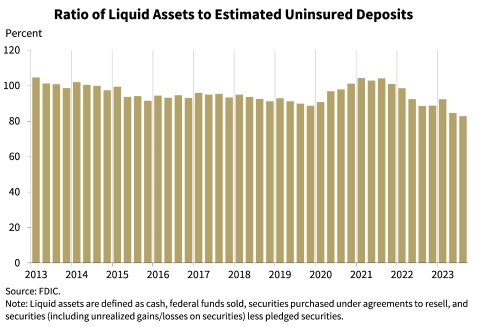
The FDIC continues to closely monitor liquidity and access to funds across the banking industry. This chart shows liquid assets as a ratio of estimated uninsured deposits, which is one measure of a bank’s ability to meet an outflow of deposits. This ratio increased significantly during the pandemic as bank deposits and liquid assets swelled, but has since declined as banks have reduced their securities holdings and increased securities pledging as a contingency measure. The third quarter liquid–assets–to–uninsured–deposits ratio declined to 82.8 percent because of a reduction in securities.
Chart 8:
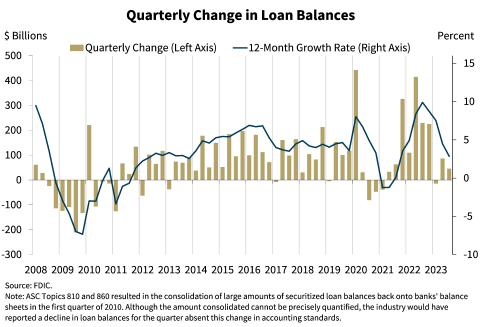
This chart shows that loan growth continued in the third quarter, but at a more moderate rate than last quarter. Total loans increased by $45.9 billion, or 0.4 percent, during the quarter. An increase in credit card balances and one–to–four family residential mortgages more than offset declines in commercial and industrial loans.
On an annual basis, the banking industry continued to report a moderation in lending. The annual loan growth rate declined to 2.9 percent in the third quarter, reflecting surveys that indicate lower loan demand and tighter underwriting standards compared to last year.
Growth in credit card balances, one–to–four family residential mortgages, and nonfarm, nonresidential commercial real estate loans drove the annual increase.
Community banks reported stronger loan growth than the industry overall, including a 1.7 percent quarter–over–quarter increase and a 9.8 percent year–over–year increase. One–to–four family residential mortgages and nonfarm, nonresidential commercial real estate loans drove the quarterly and annual loan growth for community banks.
Chart 9:
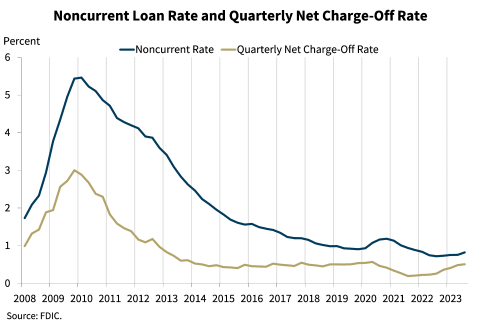
Our next chart shows that asset quality metrics for the industry remain favorable, though the noncurrent and net charge–off rates increased modestly in the third quarter. The noncurrent rate increased seven basis points from the second quarter to 0.82 percent, driven by increases in nonfarm, nonresidential commercial real estate noncurrent balances. This ratio is well below the industry’s 1.28 percent pre–pandemic average noncurrent rate.
The industry’s net charge–off rate increased two basis points during the quarter to 0.51 percent; this ratio is above its pre–pandemic average of 0.48 percent. Higher credit card charge–off balances drove the annual increase.
The community bank noncurrent rate increased four basis points from the previous quarter to 0.51 percent, and the net charge–off rate rose two basis points to 0.11 percent. These ratios remain near historical low levels and are much better than pre–pandemic averages.
Chart 10
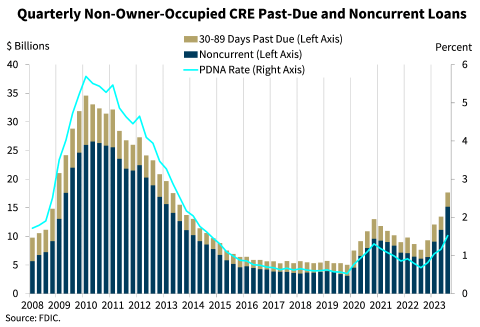
Looking more closely at commercial real estate portfolios, we are beginning to see concerning trends in non–owner–occupied property loans. The volume of noncurrent non–owner occupied CRE loans increased by $4.1 billion, or 36.4 percent, quarter over quarter. In addition, these loans had a noncurrent rate of 1.31 percent in the third quarter, up from 0.96 percent last quarter and 0.54 percent a year ago. This is the highest noncurrent rate reported for this loan portfolio since third quarter 2014.
These trends are being driven primarily by deterioration in office loans.
Chart 11:
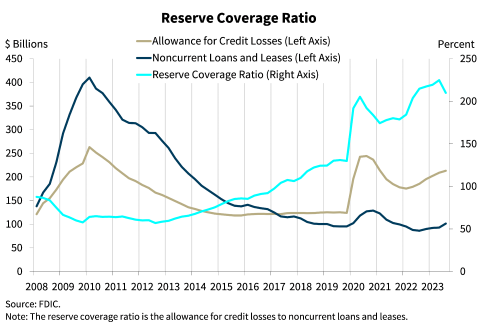
Our next chart shows that the noncurrent loan balances grew at a faster pace than the allowance for credit losses, resulting in a decline in the reserve coverage ratio. The ratio of the allowance for credit losses to noncurrent loans fell from a peak of 224.8 percent last quarter to 209.9 percent this quarter.
Chart 12:
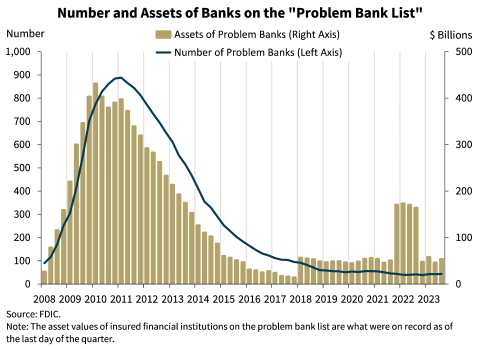
This next chart shows the number and total assets of banks on the “Problem Bank List.” Banks on this list have a CAMELS composite rating of “4” or “5” due to financial, operational, or managerial weaknesses, or a combination of such issues. The number of banks on the list increased by one from the previous quarter to 44 banks, and total assets held by problem banks increased by $7.5 billion quarter over quarter to $53.5 billion. One bank failed and two banks voluntarily liquidated in the third quarter.
Chart 13:
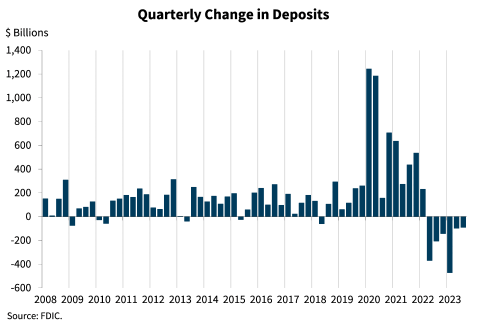
This chart shows that deposits declined for a sixth consecutive quarter. Total deposits were $18.6 trillion, down 0.5 percent quarter over quarter, similar to the 0.5 percent decline reported in the second quarter. Domestic deposits declined $39.6 billion, or 0.2 percent quarter over quarter.
In the third quarter, we observed the continuation of the trend in which customers are actively seeking higher yields. Lower–earning accounts such as transaction, money market deposit, and other savings accounts declined by $285.2 billion during the quarter, while higher–yielding time deposits increased by $245.5 billion. Brokered deposits increased 7.4 percent from the prior quarter and now make up 7.0 percent of total deposits, up from 3.9 percent a year ago.
In the third quarter, insured deposits increased by 0.1 percent, driven by higher levels of insured brokered and reciprocal deposits. Uninsured deposits declined by 0.4 percent, much less than the 2.5 percent decline reported in the second quarter.
Chart 14:
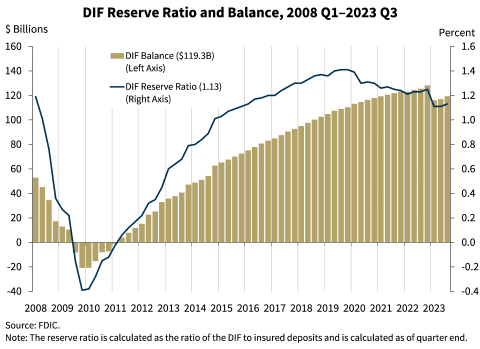
This chart shows that the DIF balance was $119.3 billion on September 30, up approximately $2.4 billion from the second quarter balance. Assessment revenue was the primary driver of the increase in the fund. Insured deposits increased by 0.1 percent during the third quarter, and year–over–year insured deposit growth was 4.1 percent. The reserve ratio—the fund balance relative to insured deposits—increased by two basis points in the third quarter to 1.13 percent as of September 30. The reserve ratio was 10 basis points lower than a year ago.
The FDIC adopted a DIF Restoration Plan on September 15, 2020, to return the reserve ratio to the statutory minimum of 1.35 percent by September 30, 2028, as required by law. Based on FDIC projections, the reserve ratio remains on track to reach 1.35 percent by the statutory deadline. The FDIC will continue to monitor factors affecting the reserve ratio, including but not limited to insured deposit growth and potential losses due to bank failures and related reserves.
In conclusion, the banking industry again proved to be resilient in the third quarter. After excluding non–recurring accounting gains in the first half of 2023, net income would have been roughly flat for the past four quarters at a level considered high by historical measures. In addition, overall asset quality metrics remained favorable and the industry remains well capitalized.
However, the banking industry still faces significant challenges from the effects of inflation, rising market interest rates, and geopolitical uncertainty. These risks, combined with concerns about commercial real estate fundamentals, especially in office markets, as well as continued pressure on funding levels and earnings, will be matters of continued supervisory attention by the FDIC.
| 1 | In this statement, the "pre–pandemic average" refers to the period of first quarter 2015 through fourth quarter 2019. |