
Quarterly Banking Profile - First Quarter 2023
Good morning, and welcome to our release of first quarter 2023 performance results for FDIC-insured institutions.
Despite the recent period of stress, the banking industry has proven to be quite resilient. Net income still remains high by historical measures even after deducting one-time transactions, asset quality metrics are favorable, and the industry remains well capitalized. However, these results, especially for earnings, include the effects of only a few weeks of the industry’s stress that began in early March, rather than over the course of the entire quarter. The more lasting effects of the industry’s response to that stress may not become fully apparent until second quarter results.
In the first quarter, the banking industry’s net income was $79.8 billion, an increase of $11.5 billion from fourth quarter 2022. After excluding accounting gains on failed bank acquisitions, net income was roughly flat from the prior quarter, but still relatively high by historical measures and would have been 13.8 percent higher than the year-ago quarter. For community banks, first quarter net income declined, as reductions in net interest income and noninterest income were higher than decreases in provision expense and noninterest expense. Nevertheless, community bank net income improved relative to a year ago and remained high compared to the pre-pandemic average.1
The recent banking stress amplified the outflow of deposits from the banking system, causing total deposits to decline for the fourth consecutive quarter and at a faster rate than in prior quarters. However, deposit outflows have moderated since the end of the quarter. The interest rates banks earned on their loans increased, but the interest rates they paid on deposits increased by a larger amount, which contributed to lower quarterly net interest margins for the industry as a whole and for community banks.
The Deposit Insurance Fund (DIF) balance was $116.1 billion on March 31, down $12.1 billion from the end of the fourth quarter. The reserve ratio—the fund balance relative to insured deposits—decreased by 14 basis points to 1.11 percent due to loss provisions for actual and anticipated failures that reduced the fund balance, and strong growth in insured deposits. Despite the decline, the reserve ratio currently remains on track to reach the 1.35 percent minimum reserve ratio by the statutory deadline of September 2028.
Unrealized losses on available-for-sale and held-to-maturity securities also remain elevated at $515.5 billion and may hinder future earnings, although recent declines in medium- and long-term rates have reduced the volume of these unrealized losses from $617.8 billion in the previous quarter.
The banking industry continues to face significant downside risks from the effects of inflation, rising market interest rates, slower economic growth, and geopolitical uncertainty. Credit quality and profitability may weaken due to these risks and may result in a further tightening of loan underwriting, slower loan growth, higher provision expenses, and liquidity constraints. Commercial real estate portfolios, particularly loans backed by office properties, face challenges should demand for office space remain weak and property values continue to soften. These will be matters of ongoing supervisory attention by the FDIC.
Chart 1:
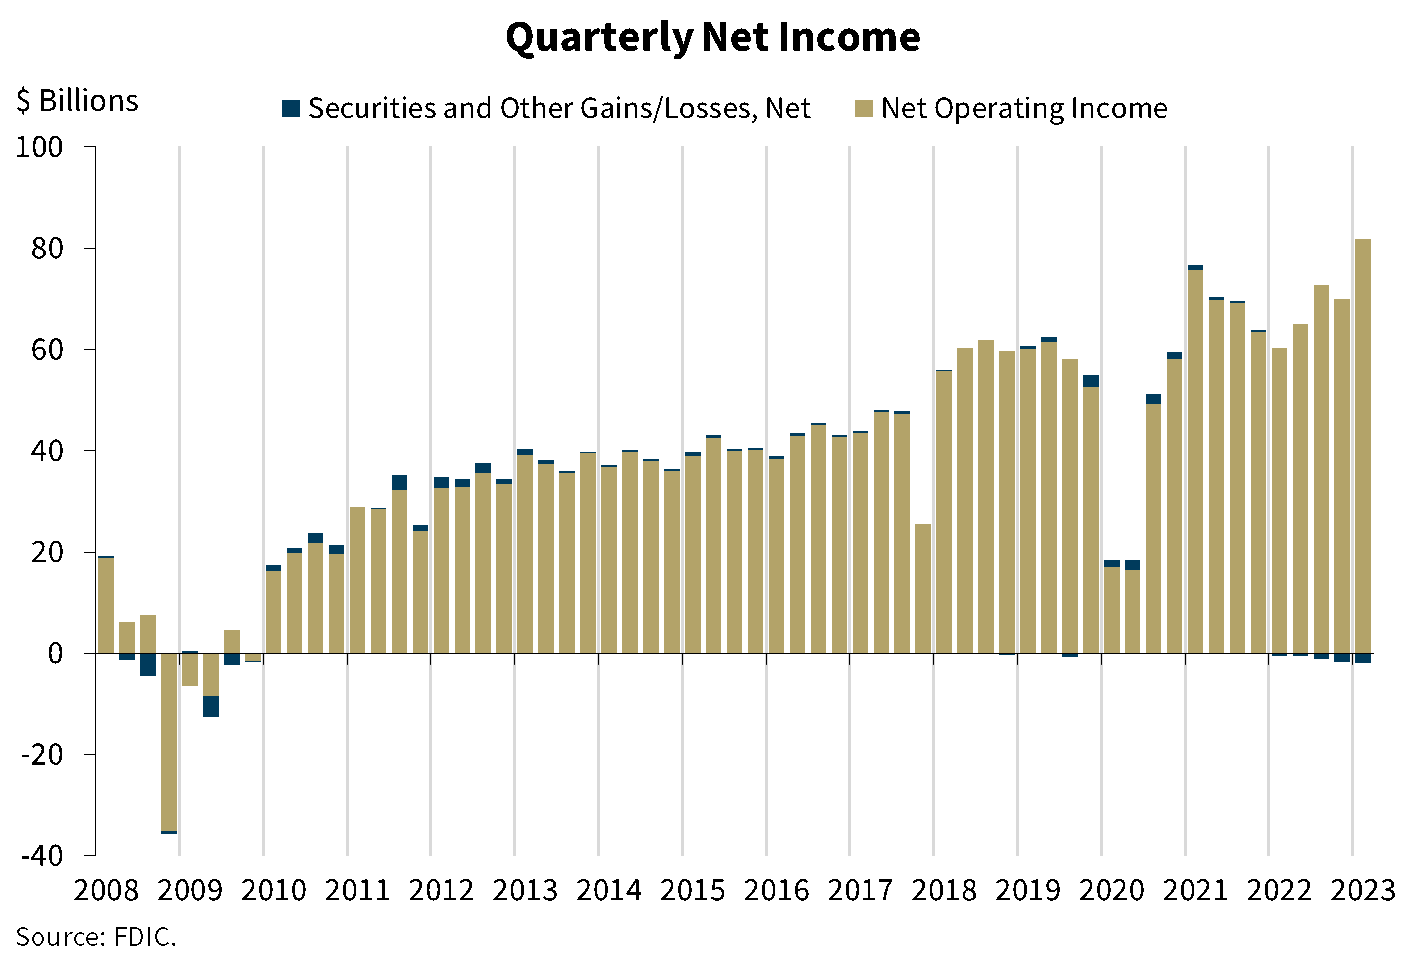
As shown in this chart, the banking industry reported net income of $79.8 billion in the first quarter, up $11.5 billion (or 16.9 percent) from the prior quarter.
Strong growth in noninterest income, reflecting the accounting treatment of the acquisition of two failed institutions and record-high trading revenue at large banks, outpaced lower net interest income and higher noninterest expense. As I mentioned earlier, industry net income would have been roughly flat quarter-over-quarter without the accounting impact of two failed bank acquisitions.
Community banks reported a decline of 4.2 percent in net income from last quarter, as reductions in net interest income and noninterest income were higher than decreases in provision expense and noninterest expense.
Chart 2:
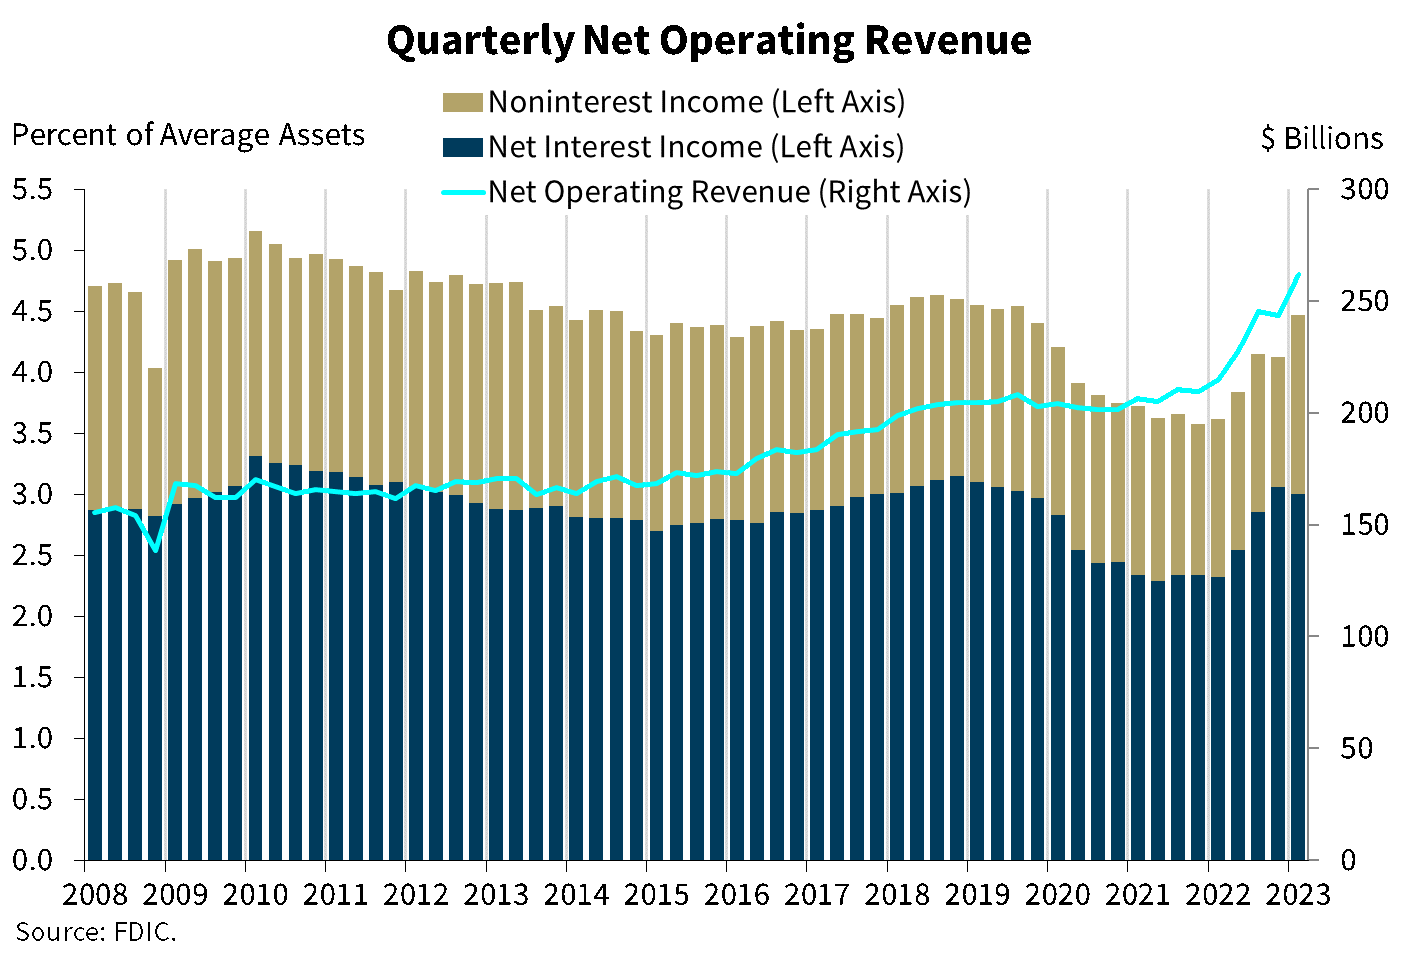
Our next chart shows that quarterly net operating revenue increased 7.6 percent from the fourth quarter 2022 to $261.7 billion. After three consecutive quarters of increase, net interest income as a percentage of average assets declined relative to the fourth quarter, but still exceeds the pre-pandemic average. Noninterest income increased by $23.0 billion, or 36.5 percent, from fourth quarter 2022. The accounting treatment of banks’ acquisition of two failed banks represented $11.8 billion of the increase, and record-high trading revenue accounted for another $7.9 billion.
Chart 3:
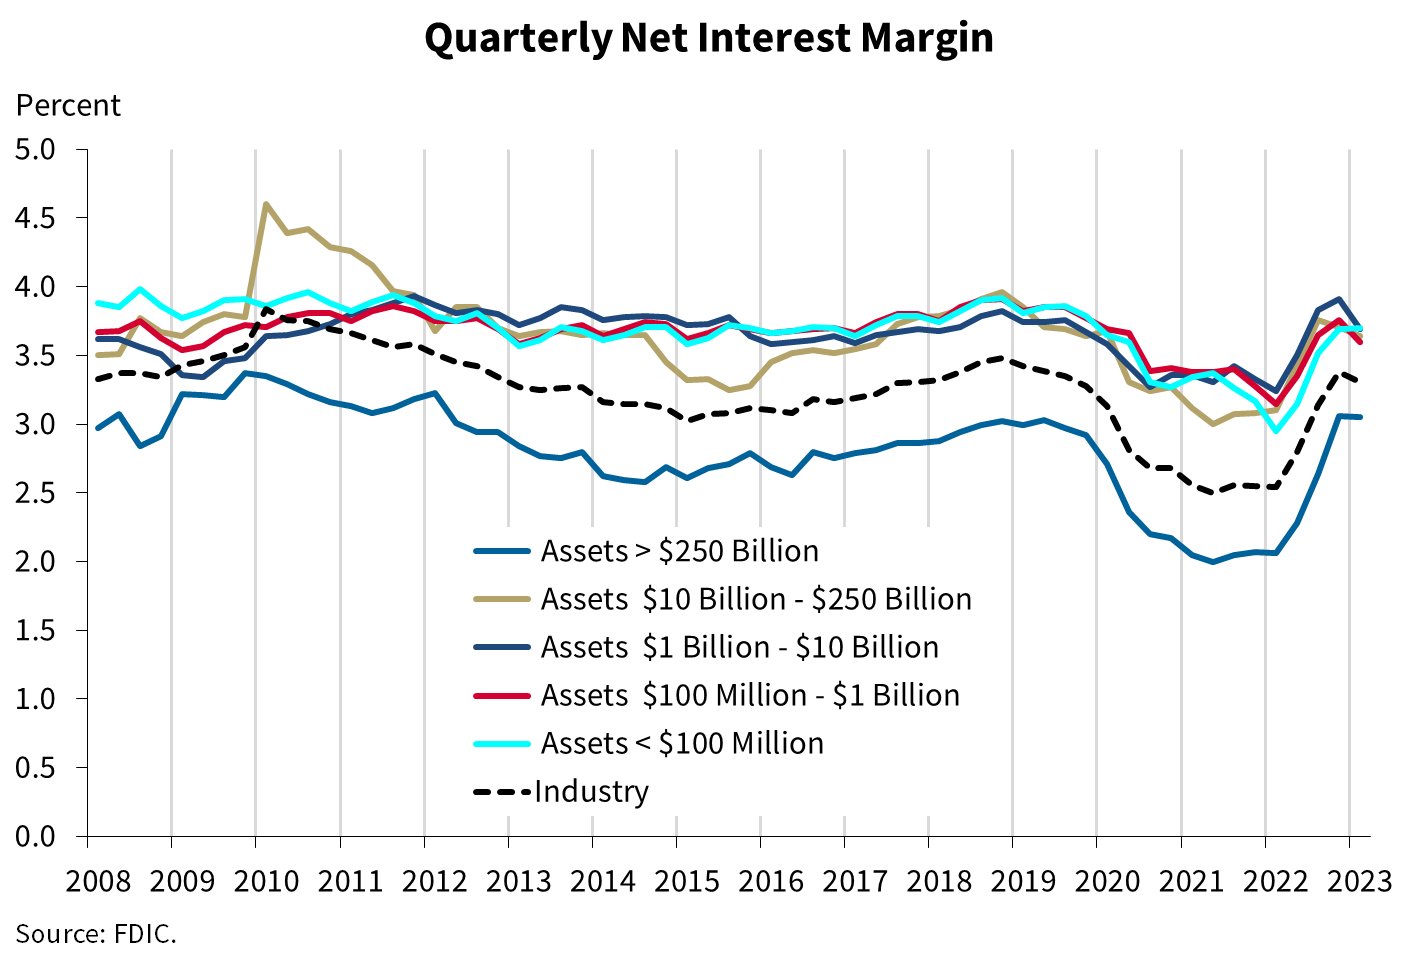
The next chart shows the net interest margin for the industry and the five asset size groups on which the Quarterly Banking Profile reports. The net interest margin for the banking industry as a whole declined seven basis points from last quarter to 3.31 percent, but still remains above the pre-pandemic average of 3.25 percent. All QBP asset size groups, except for the group with less than $100 million in assets, reported quarterly declines in the net interest margin, though the margin for the largest banks narrowed just slightly. The decline in the net interest margin for the banking industry reflects funding costs rising at a faster rate than earning asset yields over the quarter.
The net interest margin for community banks also declined, and by a greater amount than for the industry as a whole. The net interest margin at community banks fell 22 basis points from the fourth quarter to 3.49 percent. Community banks continue to report higher net interest margins than the overall industry.
Chart 4:
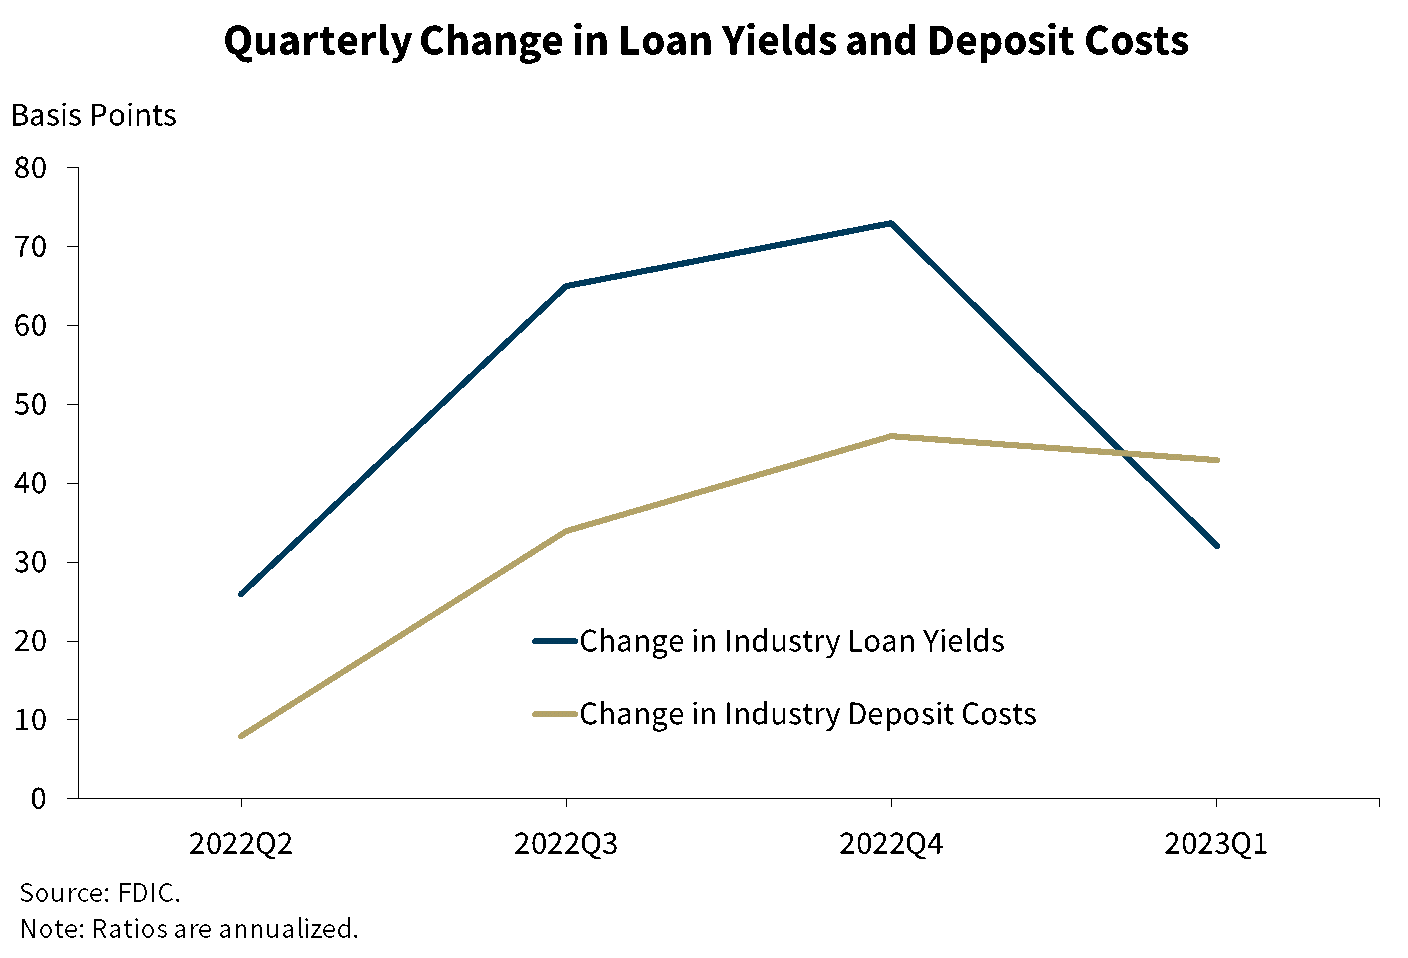
The next chart shows the quarter-over-quarter changes in the industry’s yield on loans and cost of deposits, which help to explain the recent tightening of the net interest margin. Both loan yields, the interest banks charge on loans, and deposit costs, the interest banks pay on deposits, began to increase in the second quarter of 2022 when market interest rates began to increase rapidly. Loan yields increased significantly more than deposit costs between second quarter 2022 and fourth quarter 2022. This trend reversed in the first quarter, as the banking industry reported that yields on loans increased by 32 basis points while the cost of deposits increased by 43 basis points. Over the course of the quarter, the industry reported a sizeable shift from lower-yielding accounts such as transaction and savings accounts into higher-yielding time deposits, which explains much of the increase in deposit costs.
Historical experience suggests that the gap between changes in loan yields and deposit costs tends to increase early in rate-rising cycles but then decreases and often reverses when market rates stabilize or decline.
Chart 5:
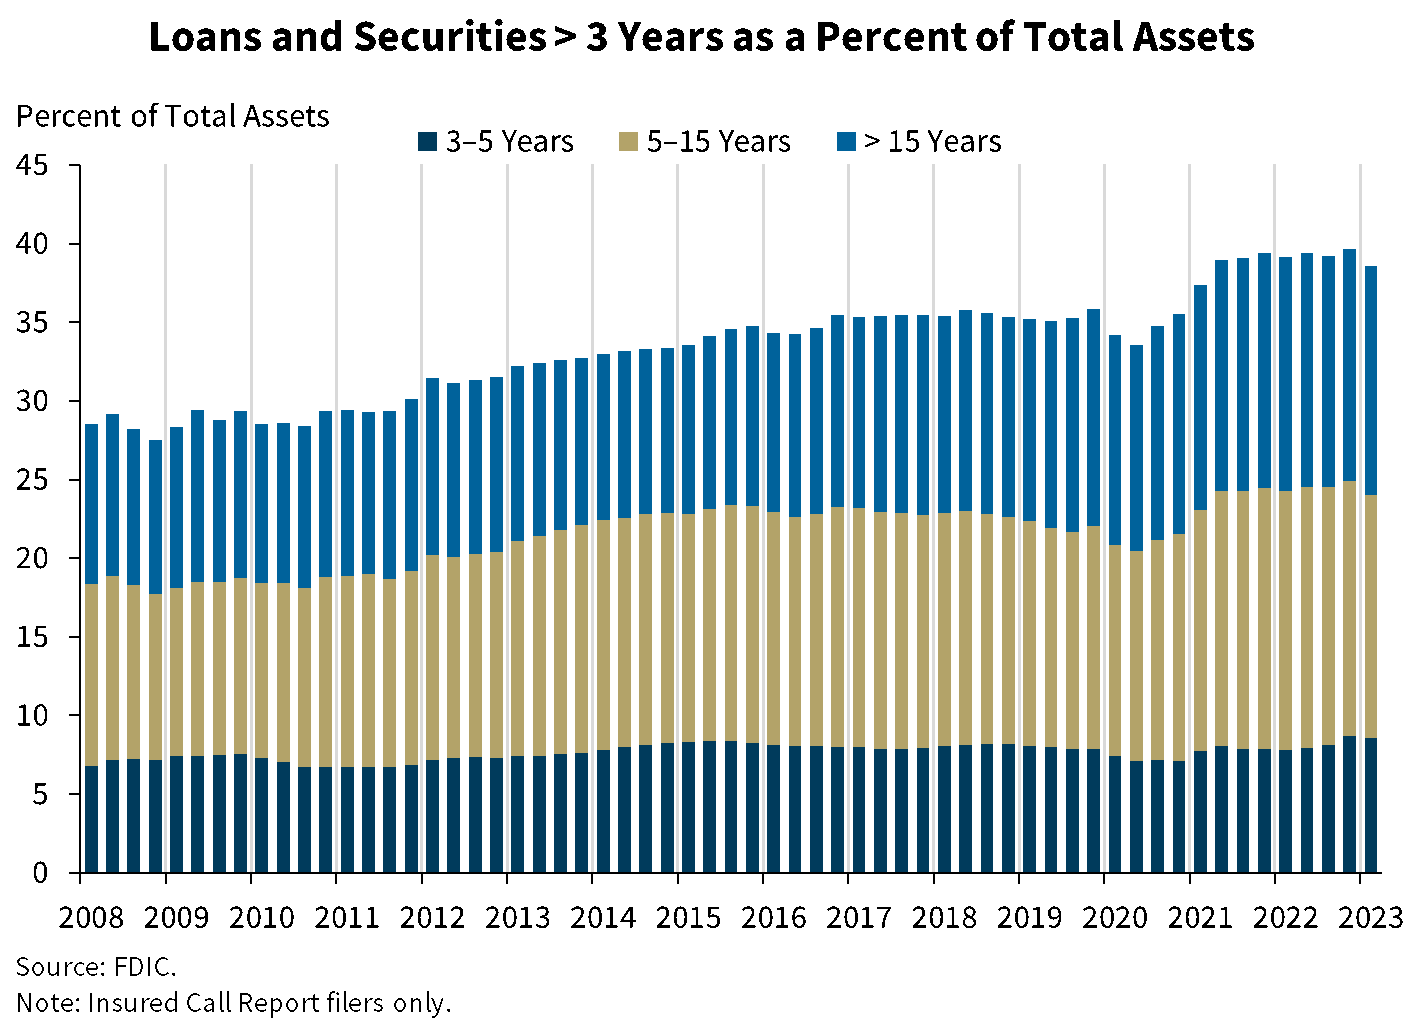
The next chart shows that the banking industry’s holdings of longer-term loans and securities declined to 38.5 percent of total assets in the first quarter, driven by a reduction in securities portfolios. Loans and securities with longer maturities and locked-in, lower yields may hinder earnings in coming quarters.
Compared with the industry, community banks continued to report a higher proportion of assets with maturities longer than three years at 53.9 percent of total assets.
Chart 6:
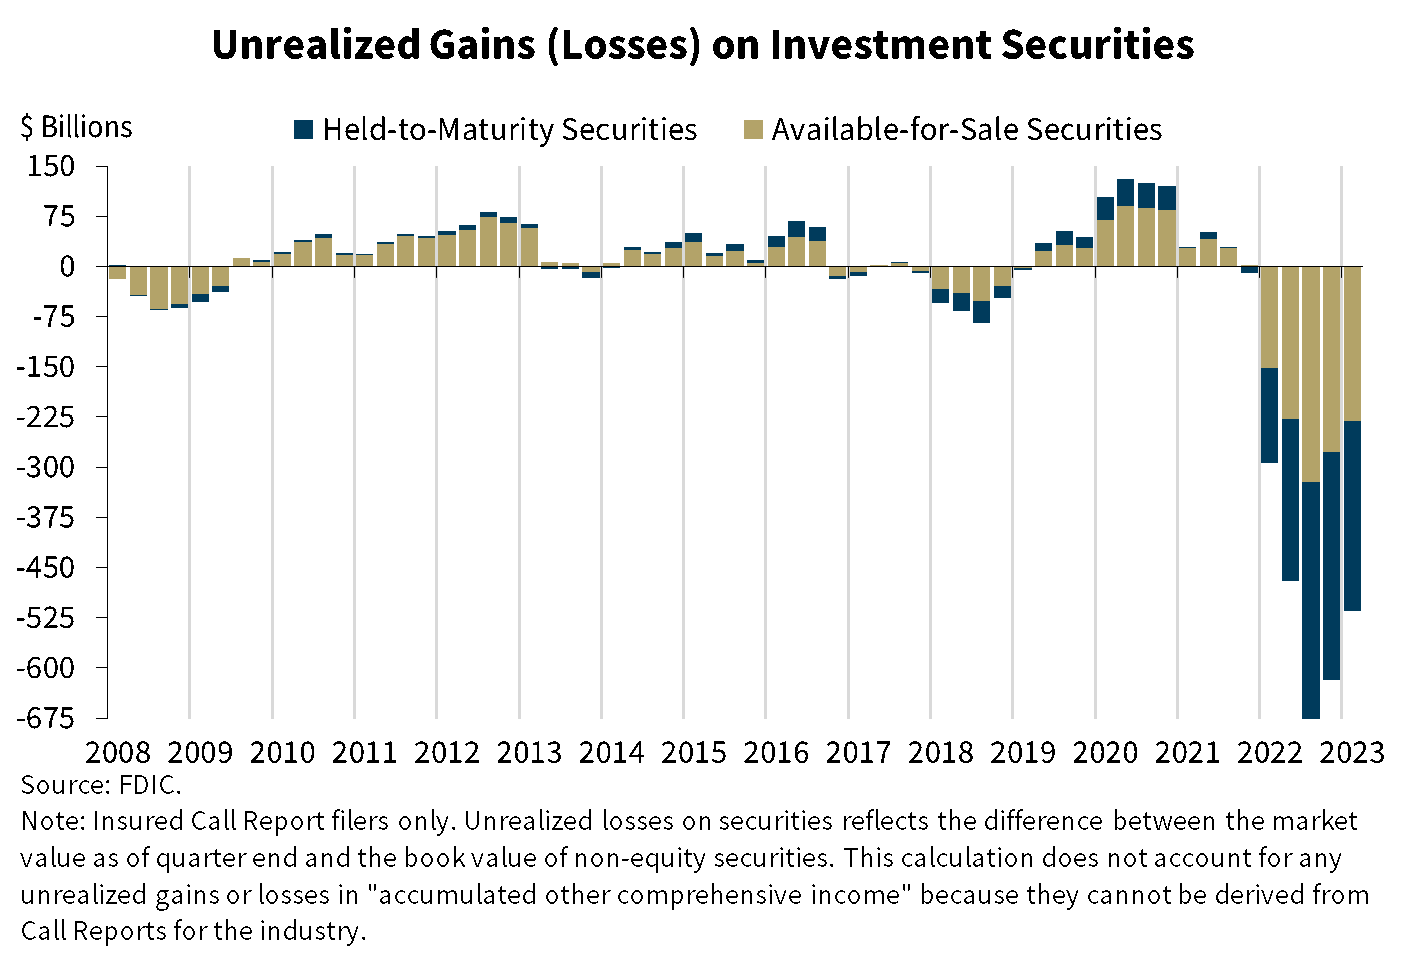
This chart shows the elevated level of unrealized losses on investment securities due to the increases in market interest rates since the beginning of 2022. Unrealized losses on available-for-sale and held-to-maturity securities totaled $515.5 billion in the first quarter, down 16.5 percent from the prior quarter, primarily due to declines in medium- and long-term interest rates. The FDIC is closely monitoring liquidity and access to funding across the banking industry.
Chart 7:
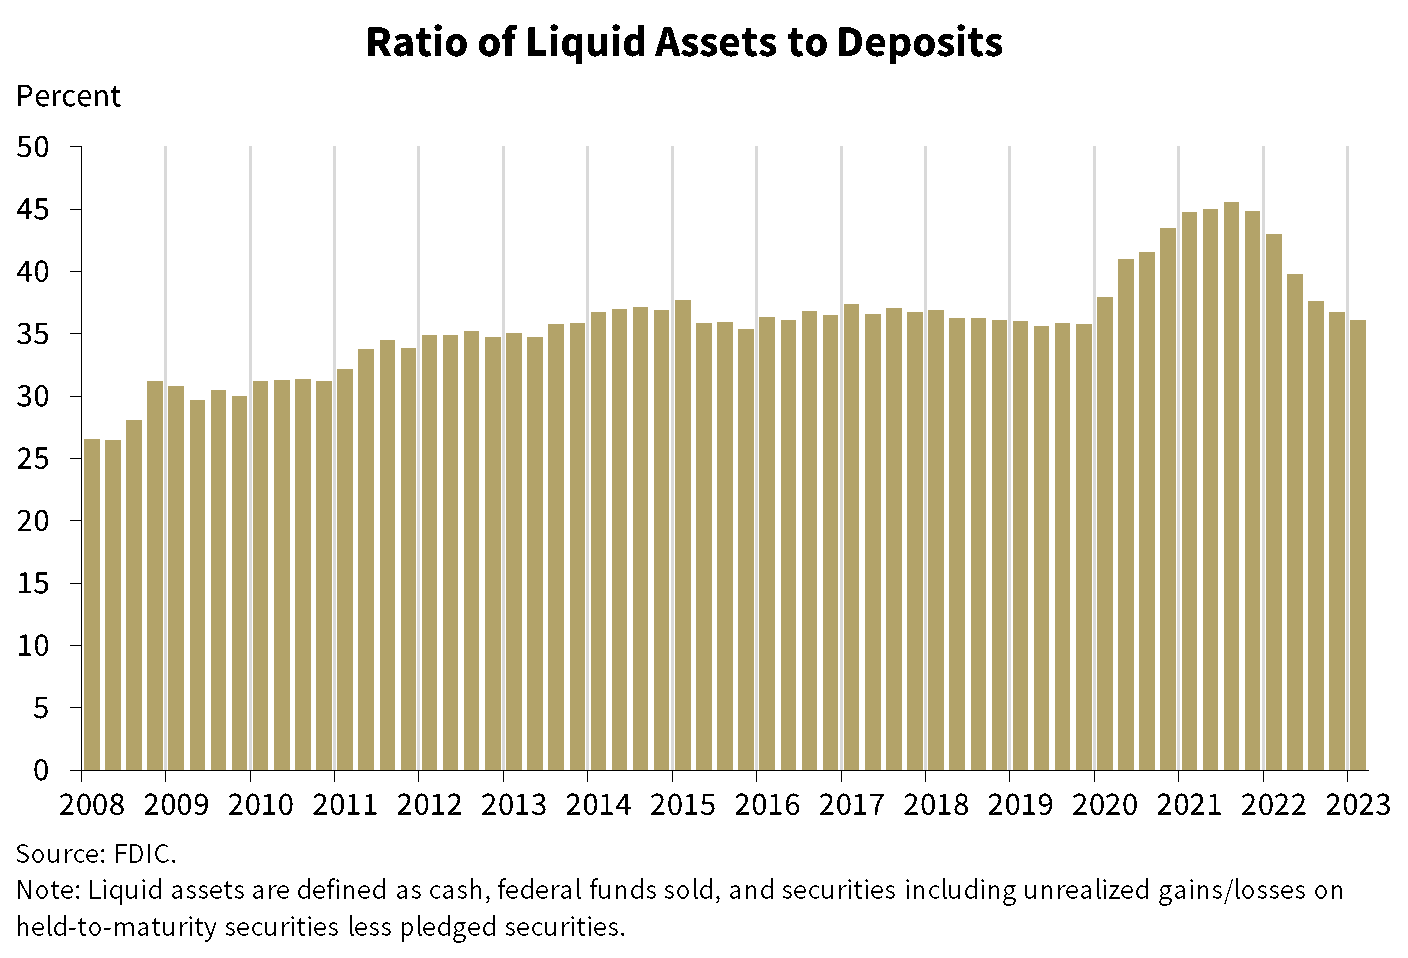
This chart shows liquid assets as ratio of total deposits, which is a measure of a bank’s ability to meet an outflow of deposits. This ratio increased significantly during the pandemic as bank deposits and liquid assets swelled, but has since declined for six straight quarters. The first quarter liquid-assets-to-deposits ratio declined slightly to 36.1 percent, which marked a return to the pre-pandemic average. While cash and balances due from depository institutions increased 10.2 percent and total deposits declined 2.5 percent from the previous quarter, these factors were offset by a decline in securities of 4.6 percent and an increase in pledged securities of 22.4 percent.
Chart 8:
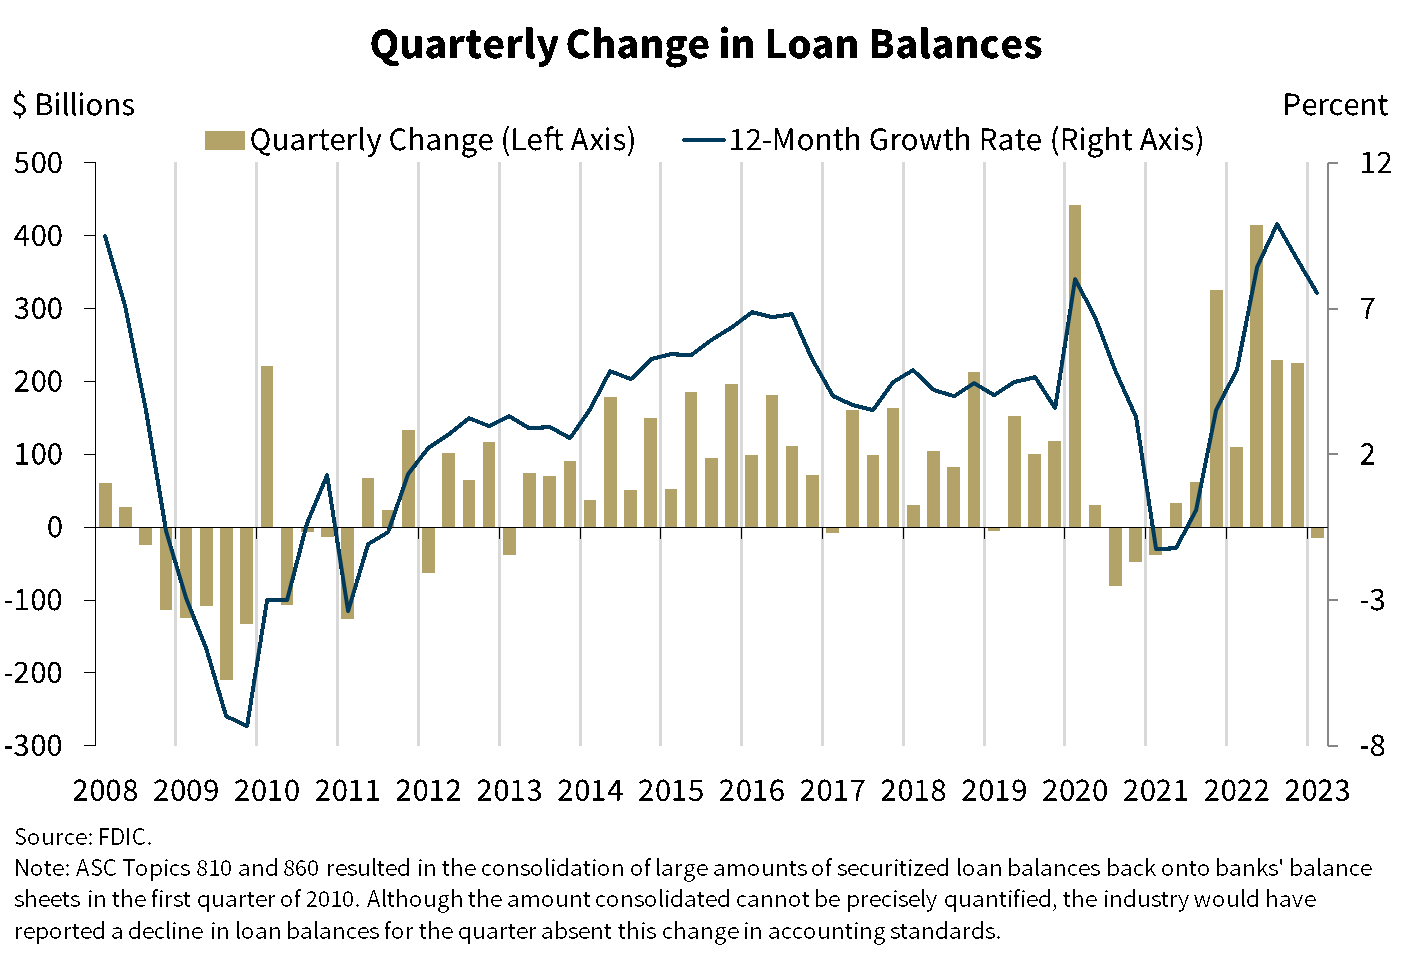
This chart shows that total loan balances declined modestly from the previous quarter. Loans transferred to the FDIC as receiver as a result of bank failures in the first quarter, combined with a seasonal decline in credit card balances, were the major contributors to the decrease in the balance of total loans. Excluding the transfer of loans to the FDIC as receiver, quarterly loan growth would have been 0.4 percent, a substantial reduction in growth from the previous six quarters but still positive. The growth was led by modest increases in one-to-four family mortgages and loans to nondepository institutions, while other major loan portfolios remained relatively flat, with the exception of the previously mentioned seasonal decline in credit card loans.
The banking industry reported annual loan growth of 7.5 percent from the previous year, well above the pre-pandemic average. The growth was led by higher one-to-four family residential mortgages, consumer loans, and commercial and industrial loans.
Compared to the industry, community banks reported stronger loan growth, increasing 1.8 percent quarter over quarter and 15.0 percent year over year. Nonfarm, nonresidential commercial real estate loan portfolios and one-to-four family residential mortgages drove annual loan growth for community banks.
Loan growth has been robust during the last year, driven by pent-up demand from both consumers and businesses as well as higher inflation. Recent surveys, however, indicate that demand is waning and underwriting standards are tightening, which may hinder loan growth rates in coming quarters.
Chart 9:
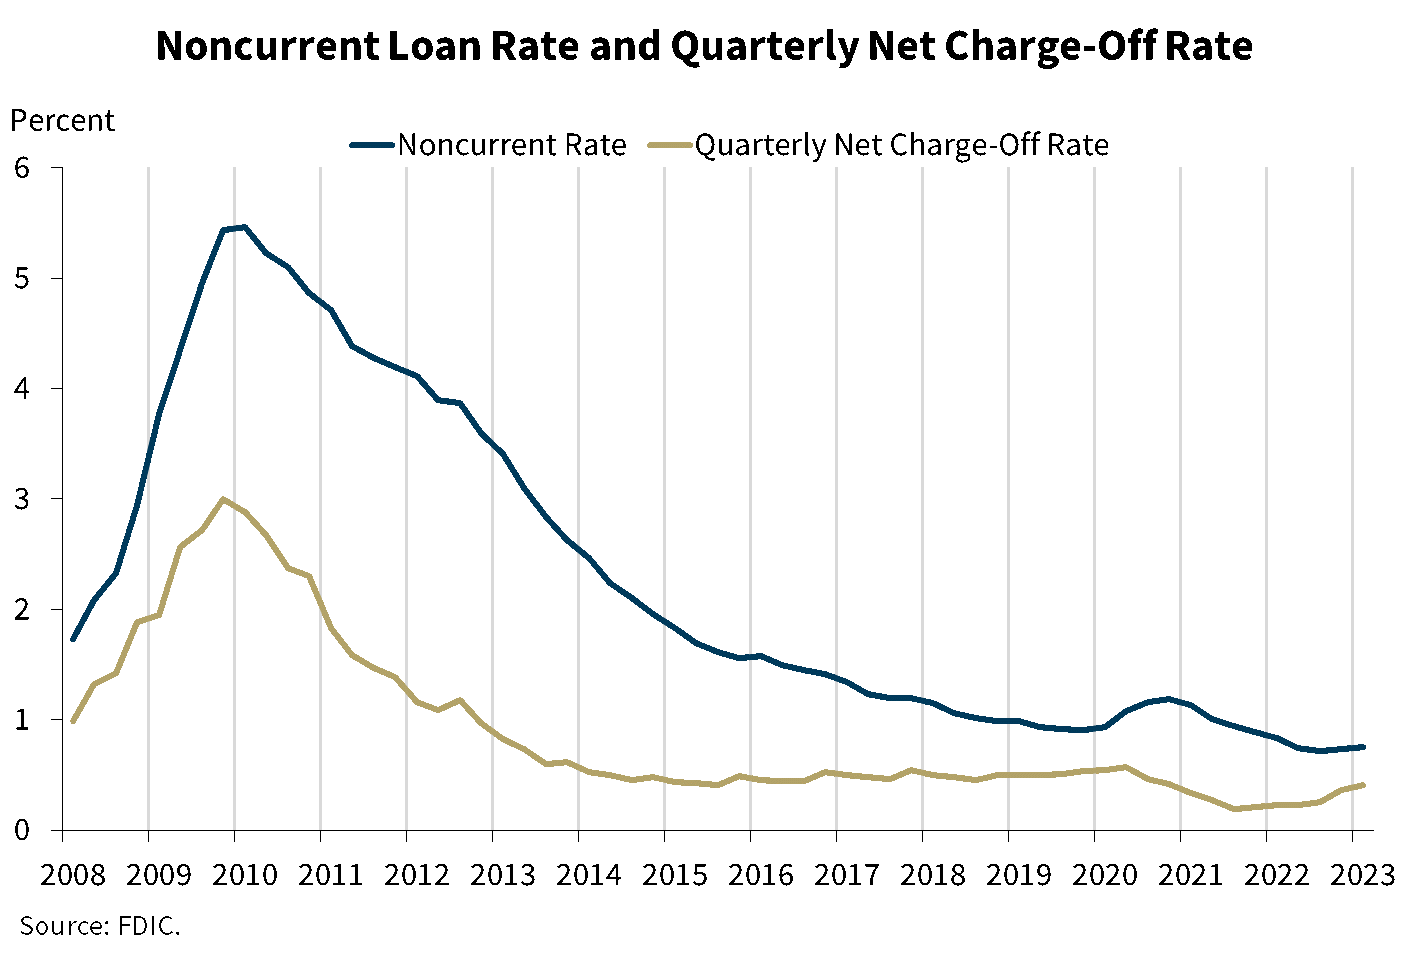
Our next chart shows that asset quality ratios for the industry remain favorable. The noncurrent and net charge-off rates increased modestly in the first quarter but remained below pre-pandemic averages. The noncurrent rate increased two basis points from the fourth quarter to 0.75 percent, driven by increases in nonfarm, nonresidential commercial real estate loan balances. Seasonal increases in credit card net charge-offs drove a five basis point increase in the industry’s net charge-off rate from one quarter ago to 0.41 percent.
The early delinquency rate (or loans past due 30-89 days) declined slightly from the prior quarter, driven by a seasonal improvement in past-due auto loans and lower delinquencies on one-to-four family residential loans.
Community banks reported stable credit quality metrics that, like those for the industry, remain better than pre-pandemic averages. The community bank noncurrent rate increased one basis point from the previous quarter to 0.45 percent, and the net charge-off rate declined two basis points from a quarter ago to 0.09 percent. The early delinquency rate for community banks increased slightly from the prior quarter.
Chart 10:
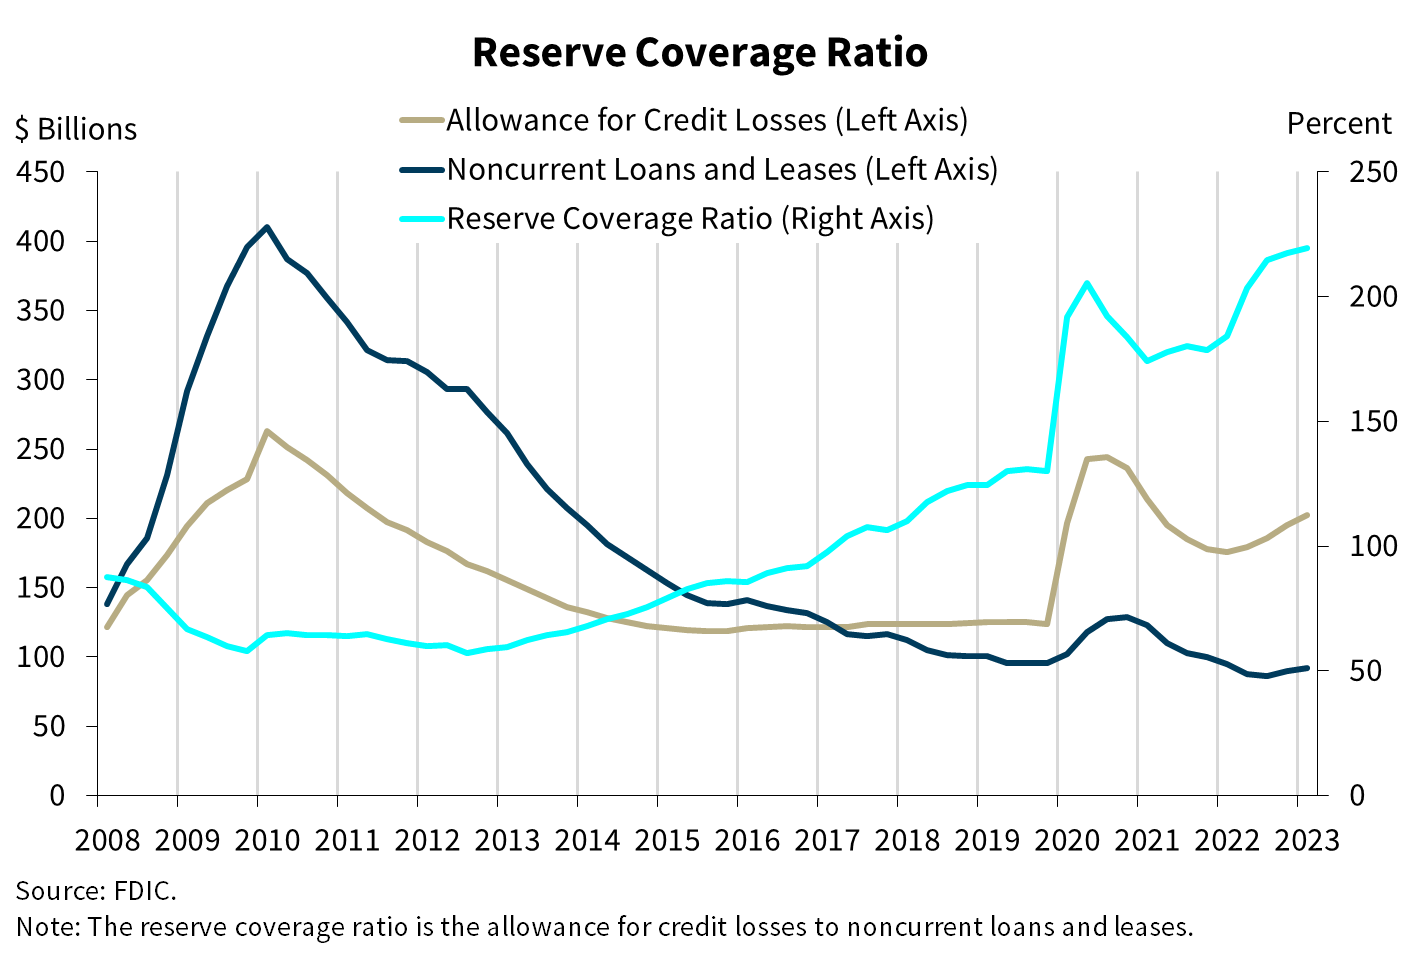
Our next chart shows that the allowance for credit losses grew at a faster pace than noncurrent loan balances, resulting in an increase in the reserve coverage ratio. The ratio of the allowance for credit losses to noncurrent loans increased from 184.3 percent one year ago to 219.5 percent, the highest level on QBP record.
Chart 11:
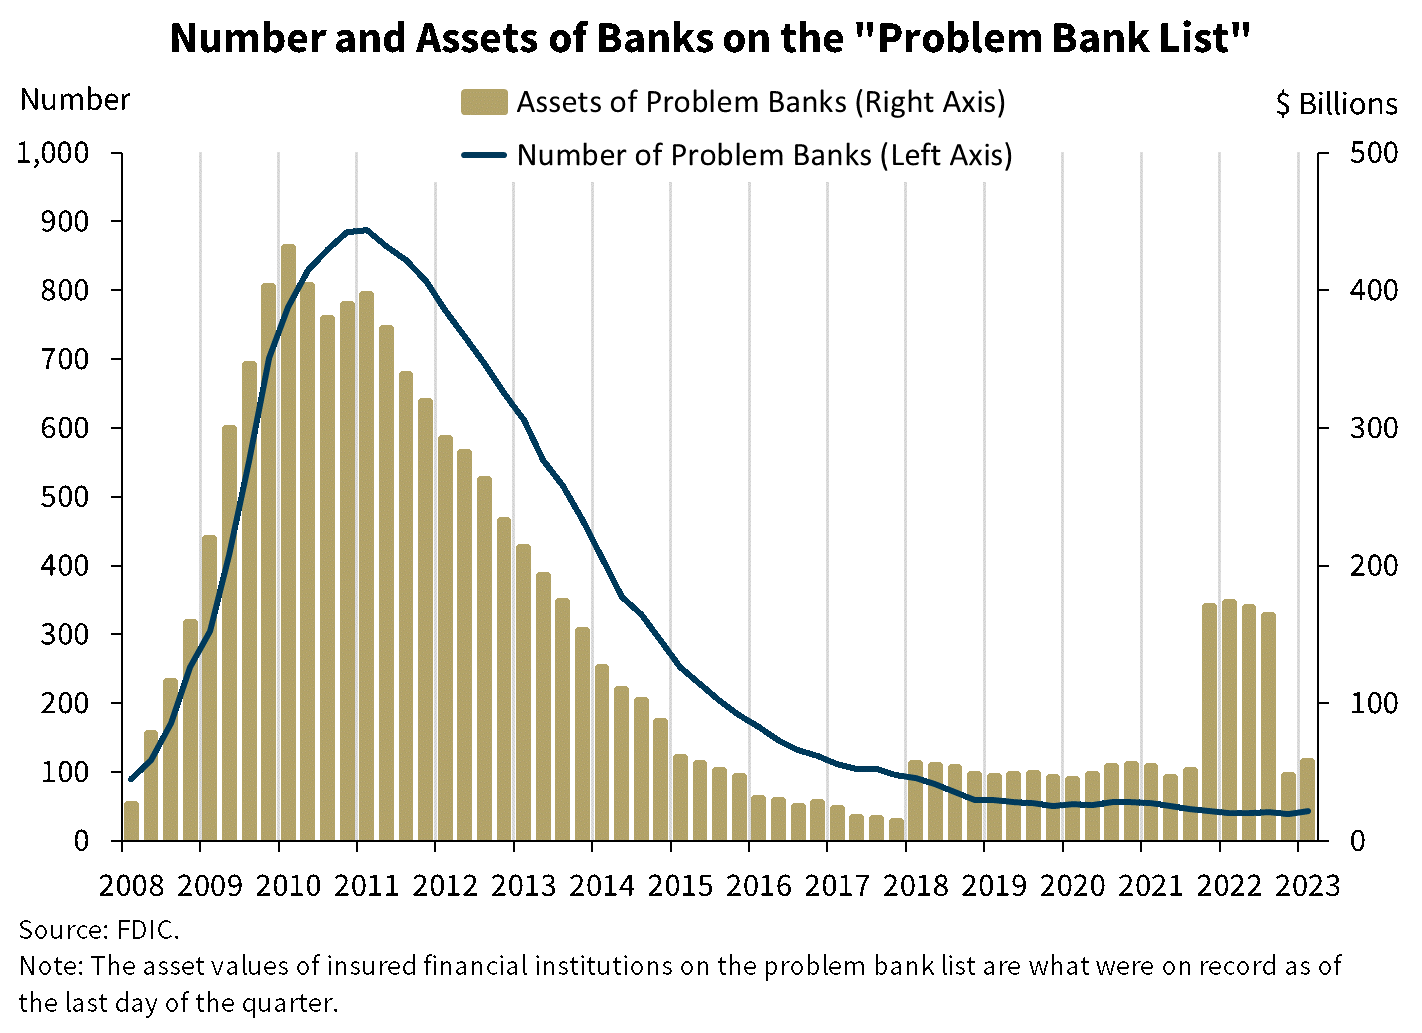
This next chart shows the number and total assets of banks on the “Problem Bank List.” Banks on this list have a CAMELS composite rating of “4” or “5” due to financial, operational, or managerial weaknesses, or a combination of such issues. The number of banks on the list increased by four from the previous quarter—reflecting movement from banks coming on and off the list—to 43 banks, and total assets held by problem banks were $58.0 billion, up $10.5 billion. Two banks failed in the first quarter.
Chart 12:
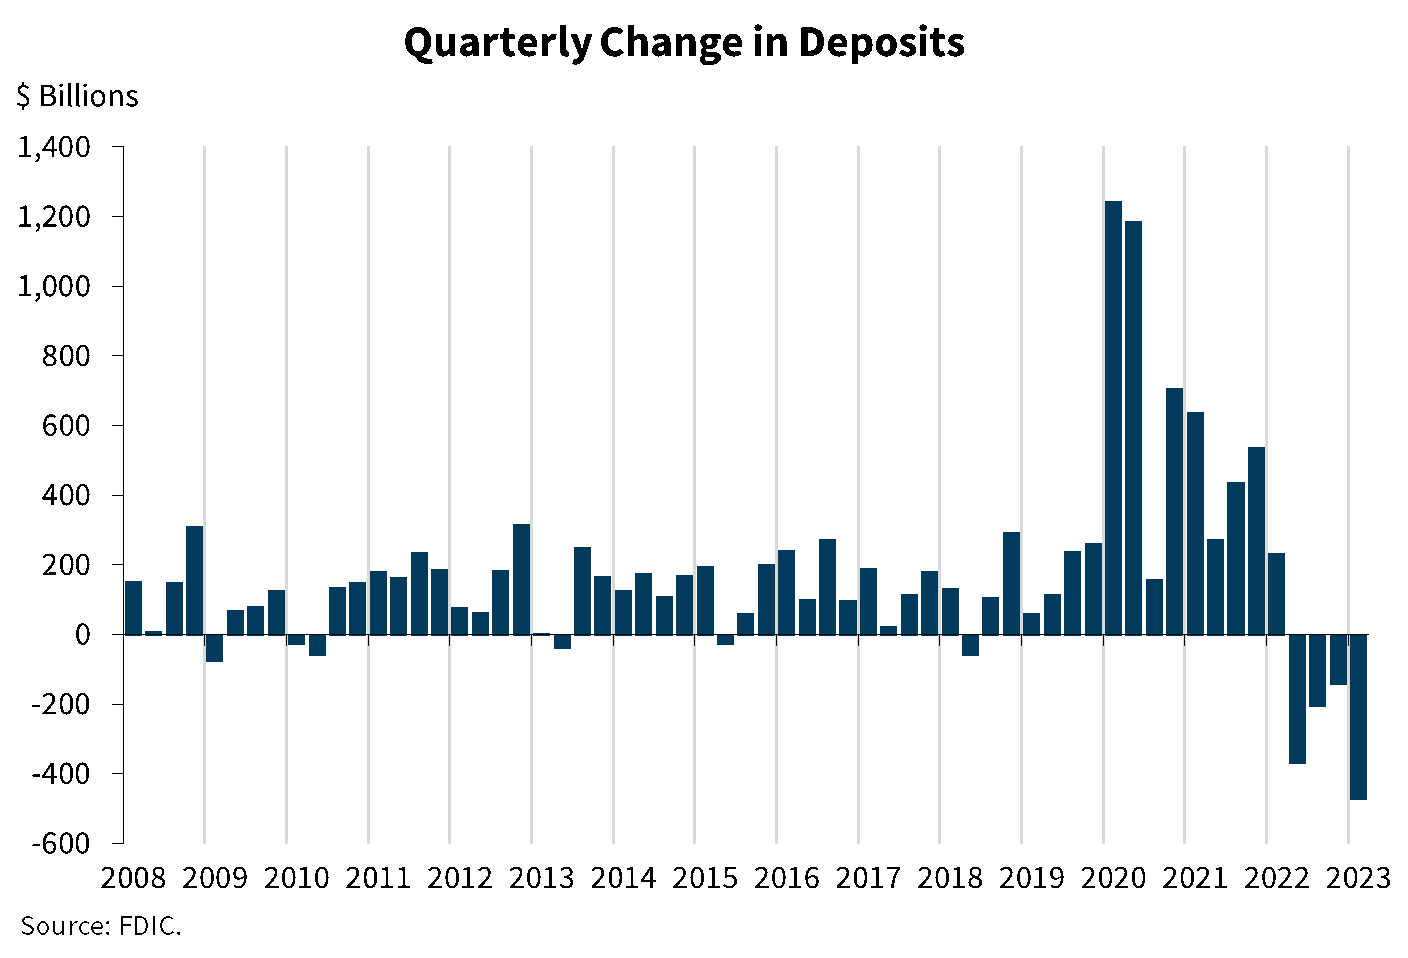
This chart shows that deposits declined for a fourth consecutive quarter. Total deposits were $18.7 trillion, down 2.5 percent from the level reported in the fourth quarter, the largest reduction reported in the QBP since data collection began in 1984. A reduction in uninsured deposits was the driver of the quarterly decline since insured deposits increased. Uninsured deposits declined by 8.2 percent. By contrast, insured deposits increased by 2.5 percent during the first quarter.
Chart 13:
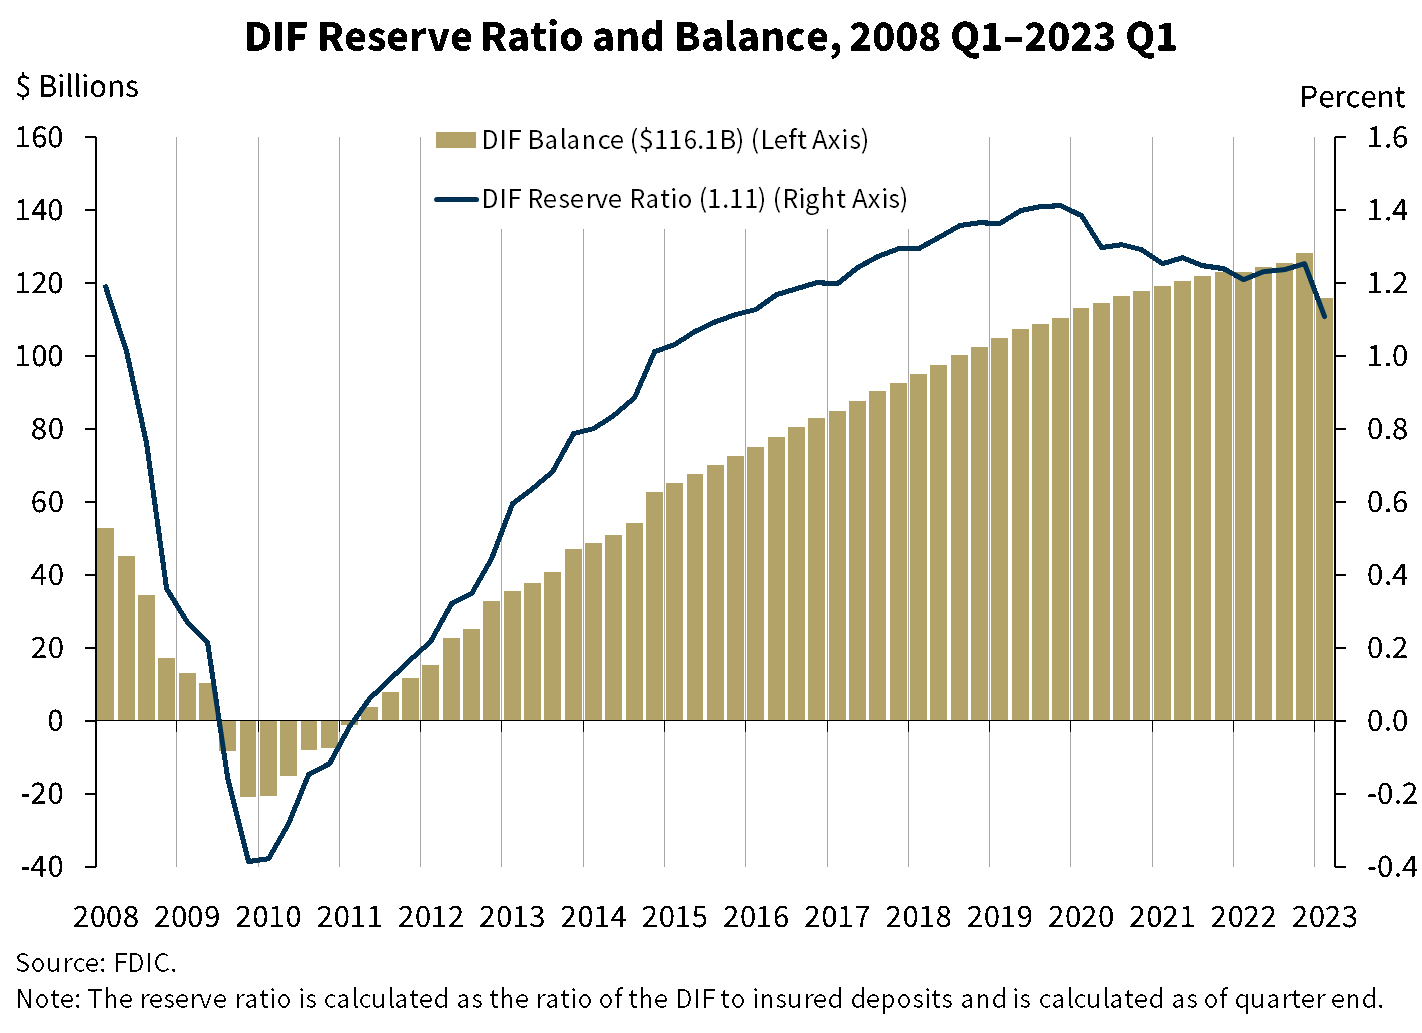
This chart shows that the DIF balance was $116.1 billion on March 31, down approximately $12.1 billion from the fourth quarter. The vast majority of the decline in the DIF was driven by the failure of two banks and amounts set aside for the anticipated failure of First Republic Bank, which subsequently failed after the end of the first quarter.
The decline in the DIF balance does not include the cost of protecting uninsured deposits pursuant to the systemic risk determination made for the two bank failures that occurred in March. The FDIC is required by statute to recover those losses through a special assessment, offsetting the losses associated with protecting uninsured depositors and eliminating any effect on the DIF balance and reserve ratio. The decline in the DIF balance was partially offset by assessment income, which increased by about $1 billion from the previous quarter, largely because of the 2 basis point increase to the deposit insurance assessment rate schedules that became effective on January 1, 2023.
Insured deposits increased by 2.5 percent during the first quarter, bringing year-over-year insured deposit growth to 3.1 percent. Together, the decrease in the DIF balance and the increase in insured deposits caused the reserve ratio to fall to 1.11 percent as of March 31.
The FDIC adopted a DIF Restoration Plan on September 15, 2020, that would return the reserve ratio to 1.35 percent, the statutory minimum, by September 2028 as required by law. In spite of recent stress in the banking industry, the reserve ratio currently remains on track to reach 1.35 percent by the statutory deadline. The FDIC will continue to monitor factors affecting the reserve ratio, including but not limited to, insured deposit growth, and potential losses due to bank failures and related reserves as required under the current Restoration Plan.
In conclusion, the banking industry has proven to be resilient. In the first quarter, net income was flat but still high by historical measures, asset quality metrics remained favorable, and the industry remains well capitalized. However, the industry’s quarterly results do not yet fully reflect the stress that began in early March.
The banking industry also faces significant downside risks from the effects of inflation, rising market interest rates, slower economic growth, and geopolitical uncertainty. These risks have the potential to weaken credit quality and profitability and could result in further tightening of underwriting, slower loan growth, and higher provision expenses.
Given these risks, the FDIC will be focused on monitoring the condition of the banking industry, including the impacts of the recent bank failures on liquidity, and taking appropriate supervisory actions.
Thank you.
I am happy to take your questions.
| 1 | In this statement, the “pre-pandemic average” refers to the period of first quarter 2015 through fourth quarter 2019. |