
Quarterly Banking Profile - Fourth Quarter 2022
Good morning, and welcome to our release of full-year and fourth quarter 2022 performance results for FDIC–insured institutions.
The banking industry reported continued positive results amid persistent economic uncertainty. Net interest income grew, loan growth continued, and asset quality measures remained favorable despite modest deterioration.
The banking industry reported full–year 2022 net income lower than full–year 2021 net income, but still above the pre–pandemic average. The year–over–year decline was primarily due to higher provision expenses—the amount set aside by institutions to protect against future credit losses.
Looking at quarterly results, fourth quarter net income decreased from the prior quarter as lower noninterest income and increased provisions offset gains in net interest income. Still, like the full–year net income levels, fourth–quarter industry net income was higher than the pre–pandemic average.
Community banks' annual net income in 2022 declined 0.3 percent from 2021. Net Income increased quarter–over–quarter as higher net interest income and securities gains offset higher noninterest expense and provision expense.
Rising short–term interest rates and continued loan growth supported a quarter–over–quarter increase in the net interest margin for the industry as a whole and community banks. The change in deposit rates paid by banks continued to lag the change in rates charged on loans.
The Deposit Insurance Fund (DIF) balance was $128.2 billion on December 31, up $2.8 billion from the end of the third quarter. The reserve ratio increased by one basis point to 1.27 percent, as insured deposits increased 1.4 percent.
The banking industry continues to face significant downside risks from the effects of inflation, rising market interest rates, and continued geopolitical uncertainty. Credit quality and profitability may weaken due to these risks and may result in tighter loan underwriting, slower loan growth, higher provision expenses, and liquidity constraints.
Additional short–term interest rate increases combined with longer asset maturities may also affect bank balance sheets in coming quarters. Unrealized losses on available–for–sale and held–to–maturity securities remained elevated at $620 billion. Higher market interest rates may also erode real estate and other asset values as well as weaken borrowers' loan repayment ability. These will be matters of ongoing supervisory attention by the FDIC.
Chart 1:
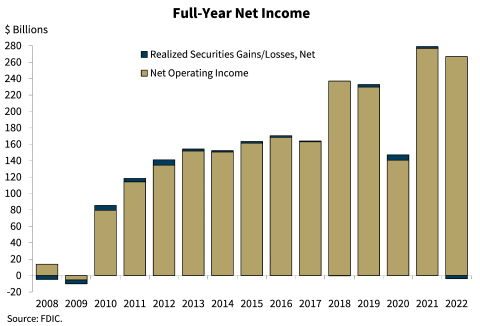
Our first chart shows that full–year 2022 net income was $263 billion. This was a decline of $16.1 billion, or 5.8 percent, from the historically high levels reported in 2021, but was still greater than earnings prior to the pandemic. The decline was primarily attributable to an increase in provision expense of $82.6 billion in 2022 relative to 2021. Provision expenses increase the amount set aside by institutions to protect against future credit losses and reflect continued loan growth and economic uncertainty that may affect future credit quality. The return–on–assets ratio (ROA) for the industry declined from 1.23 percent in 2021 to 1.12 percent in 2022.
Community banks reported annual net income of $30.4 billion in 2022, down 0.3 percent from 2021. A substantial increase in net interest income was offset by decreased noninterest income and increased noninterest and provision expenses.
Chart 2:
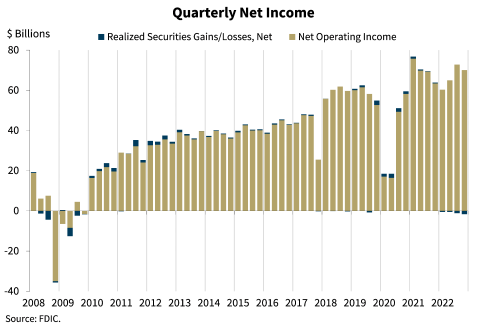
As shown in this chart, the banking industry reported net income of $68.4 billion in the fourth quarter, down $3.3 billion (or 4.6 percent) from the prior quarter.
Strong growth in interest income pushed net interest income up 6.7 percent. Nevertheless, the growth in net interest income was more than offset by a decrease in noninterest income and an increase in provision expense.
Community banks reported a modest increase in net income from last quarter.
Chart 3:
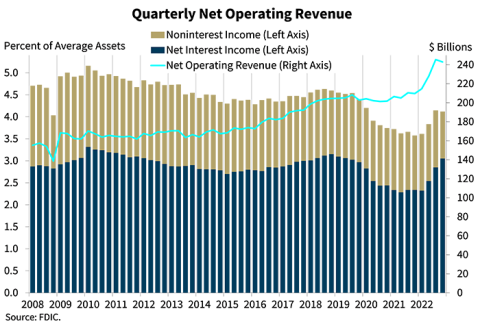
Our next chart shows that quarterly net operating revenue decreased (down 1.0 percent) from third quarter 2022 to $242.9 billion. But net interest income as a percentage of average assets increased from the third quarter and now exceeds the pre–pandemic average.
Noninterest income declined when compared to the third quarter, caused in part by lower trading revenue.
Chart 4:
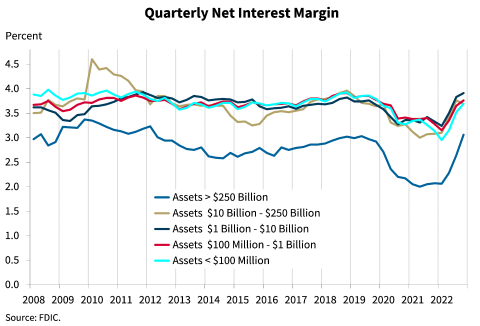
The next chart shows the net interest margin for the five asset size groups on which the QBP reports. The net interest margin for the banking industry as a whole widened for the third consecutive quarter, increasing 23 basis points from last quarter to 3.37 percent, and is now above the pre–pandemic average of 3.25 percent. Despite the improvement, the net interest margin improved at a slower pace than the prior quarter as deposit costs increased.
The net interest margin for community banks also expanded, but by a smaller amount than the industry. The net interest margin at community banks widened seven basis points from the third quarter to 3.71 percent.
Chart 5:
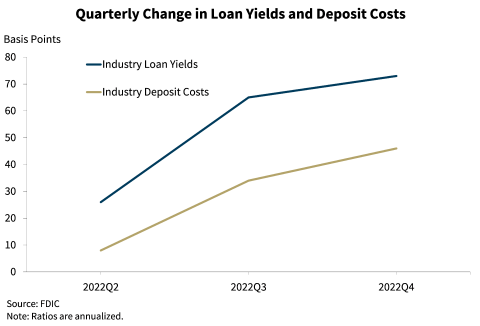
The next chart shows the quarter–over–quarter changes in the industry's yield on loans and cost of deposits, which help to explain the industry's increasing net interest margin over the past three quarters. Both loan yields, the interest banks charge on loans, and deposit costs, the interest banks pay on deposits, began to increase in the second quarter of 2022 when market interest rates began to increase rapidly. Loan yields increased significantly more than deposit costs in each of the last three quarters.
In the fourth quarter, the banking industry reported that yields on loans increased by 73 basis points while the cost of deposits increased by 46 basis points. Competitive pressures to raise interest rates on deposits may bring about some greater balance in future quarters. Historical experience suggests that the gap between changes in loan yields and deposit costs tends to increase early in rate–rising cycles but then decreases when market rates stabilize or decline.
Chart 6:
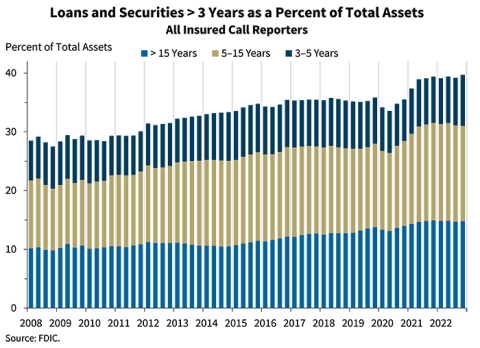
The next chart shows that the banking industry's holdings of longer–term loans and securities increased to 39.7 percent in the fourth quarter. Although this higher level of longer–term loans and securities helped preserve net interest margins during a period of lower interest rates, this strategy has contributed to the elevated level of unrealized losses on investment securities as a result of higher interest rates.
Compared with the industry, community banks continued to report a higher proportion of assets with maturities longer than three years at 54.7 percent of total assets.
Chart 7:
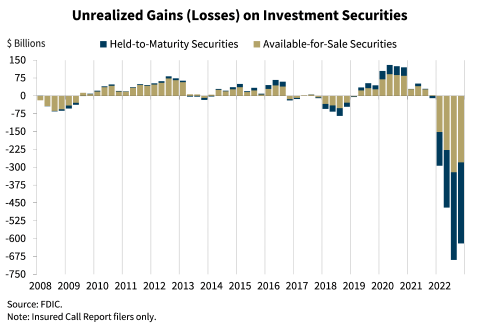
This chart shows the elevated level of unrealized losses on investment securities due to high market interest rates. Unrealized losses on available–for–sale and held–to–maturity securities totaled $620 billion in the fourth quarter, down $69.5 billion from the prior quarter, due in part to lower mortgage rates. The combination of a high level of longer–term asset maturities and a moderate decline in total deposits underscores the risk that these unrealized losses could become actual losses should banks need to sell securities to meet liquidity needs.
Chart 8:
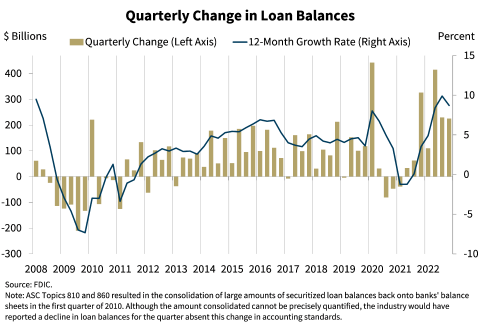
This chart shows that total loan balances grew for a seventh consecutive quarter. Loan growth for the industry continued to exceed the average pre–pandemic pace in the fourth quarter.
The banking industry reported annual growth of 8.7 percent from the previous year, well above the pre–pandemic average. The growth was led by higher commercial and industrial (C&I) loans, one–to–four family residential mortgages, and consumer loans.
Compared to the industry, community banks reported stronger loan growth, increasing 14.4 percent year over year. Nonfarm, nonresidential commercial real estate loan portfolios and one–to–four family residential mortgages drove annual loan growth for community banks.
Paycheck Protection Program (PPP) loan payoffs and forgiveness continued to affect loan growth rates. Excluding the effects of PPP loan payoffs, the year–over–year loan growth rate would have been 9.6 percent for the industry and 16.2 percent for community banks.
Loan growth has been robust during the last year, driven by pent–up demand from both consumers and businesses as well as higher inflation. With such robust loan growth, underwriting standards will remain an area of supervisory attention, given the persistent economic uncertainty.
Chart 9:
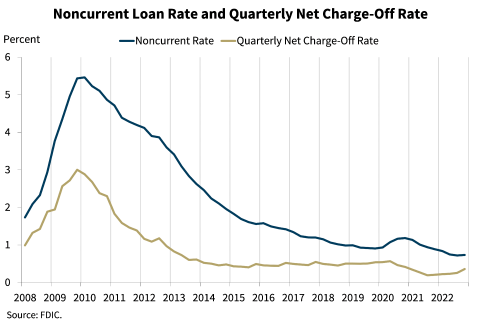
Our next chart shows that asset quality ratios for the industry remain favorable. The noncurrent and net charge–off rates increased modestly but remained below pre–pandemic averages. The noncurrent rate increased one basis point from third quarter to 0.73 percent, driven by increases in noncurrent credit card loan balances. Increases in consumer loan net charge–offs, specifically credit card and auto net charge–offs, drove a 10–basis point increase in the industry's net charge–off rate from one quarter ago to 0.36 percent.
Early delinquencies (loans past due 30–89 days) increased slightly from the prior quarter, driven by past–due one–to–four family residential, auto, and credit card loans.
Despite the increases in noncurrent and delinquent loans, credit quality metrics remain better than pre–pandemic averages. Nonetheless, the trends could be an indicator of future asset quality problems and will be an area of continued supervisory monitoring.
Community banks reported stable credit quality metrics. The community bank noncurrent rate declined two basis points from the previous quarter to 0.44 percent—the lowest level on QBP record. The community bank net charge–off rate increased four basis points from a quarter ago to 0.11 percent. Like the industry, early delinquencies for community banks increased from the prior quarter, driven by an increase in past–due one–to–four family residential, nonfarm, nonresidential CRE, and consumer loan balances. Also like the industry, community bank credit quality metrics remain better than pre–pandemic averages.
Chart 10:
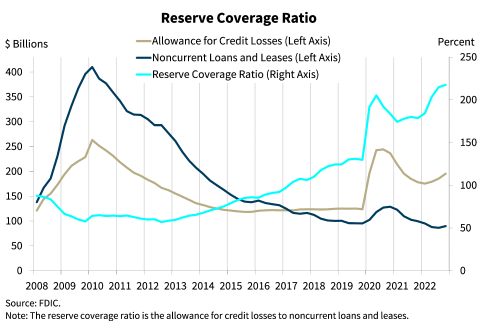
Our next chart shows that the allowance for credit losses grew more than noncurrent loan balances, resulting in an increase in the reserve coverage ratio. The ratio of credit loss reserves to noncurrent loans increased from 178.7 percent one year ago to 217.6 percent, the highest level on QBP record.
Chart 11:
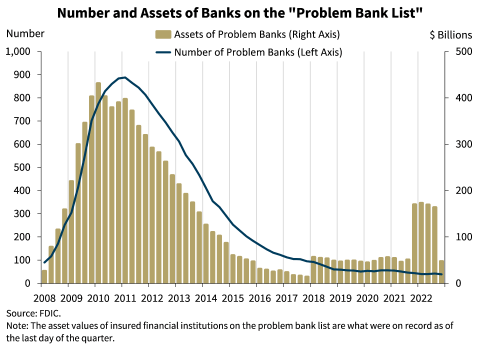
This next chart shows the number and total assets of banks on the "Problem Bank List." The number of banks on the list decreased by three from the previous quarter to 39 banks and total assets held by problem banks declined $116.3 billion to $47.5 billion in the fourth quarter. The number of problem banks is at the lowest level since QBP data collection began in 1984. No failures occurred in the fourth quarter. There has now not been a bank failure in 28 months, three short of the record of 31 months set in 2007.
Chart 12:
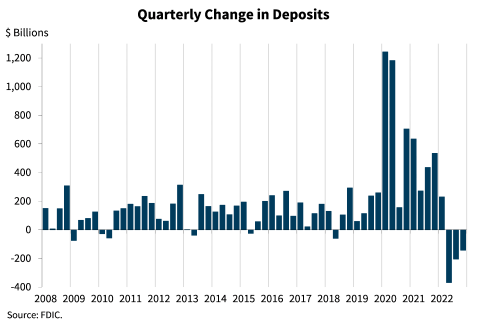
This chart shows that deposits declined for a third consecutive quarter. Total deposits were $19.2 trillion, down 0.7 percent from the level reported in the third quarter. While this reduction slightly offsets the unprecedented growth in deposits reported during the pandemic, total deposits are still well above pre–pandemic average levels. A reduction in uninsured deposits was the driver of the quarterly decline since insured deposits increased.
Chart 13:
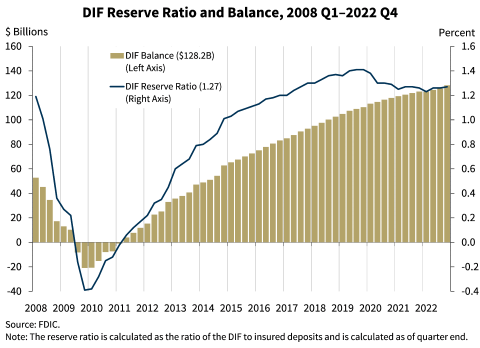
This chart shows that the DIF balance was $128.2 billion on December 31, up approximately $2.8 billion from the third quarter. Assessment revenue was the primary driver of the increase in the fund. Interest on investments and a net decrease in unrealized losses on available–for–sale securities in the DIF portfolio also contributed to the growth this quarter. Insured deposits increased by 1.4 percent during the fourth quarter. Year–over–year insured deposit growth was 3.3 percent. The reserve ratio—the fund balance relative to insured deposits—increased by one basis point in the fourth quarter to 1.27 percent as of December 31. The reserve ratio was also one basis point higher than a year ago.
The FDIC adopted a DIF Restoration Plan on September 15, 2020, intended to return the reserve ratio to 1.35 percent, the statutory minimum, by September 2028 as required by law. In October 2022, the FDIC Board finalized a rule to increase initial base deposit insurance assessment rate schedules by two basis points beginning in the first quarter of 2023. These actions were undertaken to improve the likelihood that the reserve ratio reaches the statutory minimum of 1.35 percent before the statutory deadline of September 2028 while reducing the potential for a pro–cyclical increase in assessment rates should the banking industry enter a period of stress in the interim.
In conclusion, overall, key banking industry metrics remain favorable at this time. Loan growth continued, net interest income grew, and asset quality measures remained favorable. Further, the industry remains well–capitalized and highly liquid.
However, the banking industry continues to face downside risks from the effects of inflation, rising market interest rates, and continued geopolitical uncertainty; these could hurt bank profitability, weaken credit quality and capital, and limit loan and deposit growth. These risks will be matters of continued supervisory attention by the FDIC over the coming year.
Thank you.
I am happy to take your questions.