
Quarterly Banking Profile - Second Quarter 2022
Good morning, and welcome to our release of second quarter 2022 performance results for FDIC-insured institutions.
The banking industry reported generally positive results this quarter, amid continued economic uncertainty. Loan growth strengthened, net interest income grew, and most asset quality measures improved. Further, the industry remains well-capitalized and highly liquid.
At the same time, the banking industry reported a moderate decline in quarterly net income from one year ago, primarily because of an increase in provision expense at the largest institutions.
The increase in provision expense—the amount set aside by institutions to protect against future credit losses—reflects the banking industry’s recognition of risks related to persistent economic uncertainties, and slowing economic growth, as well as the increase in loan balances.
Net income also declined year-over-year at community banks. Unlike results for the industry as a whole, an increase in compensation costs led the decline in net income at community banks.
Rising market interest rates and strong loan growth supported an increase of 26 basis points in the banking industry’s net interest margin (NIM) from the prior quarter to 2.80 percent. Most banks reported higher net interest income compared with a year ago. However, rising interest rates, longer asset maturities, and high levels of securities on bank balance sheets may present challenges for the banking industry in coming quarters.
The Deposit Insurance Fund (DIF) balance was $124.5 billion on June 30, up $1.4 billion from the end of the first quarter. The reserve ratio rose three basis points to 1.26 percent, as insured deposits fell 0.7 percent.
Despite several favorable performance metrics in the second quarter, the banking industry continues to face significant downside risks. These risks include the effects of high inflation, rapidly rising market interest rates, and continued geopolitical uncertainty. Taken together, these risks may reduce profitability, weaken credit quality and capital, and limit loan growth in coming quarters. Furthermore, higher market interest rates have led to continued growth in unrealized losses in the banking industry’s securities portfolios. Higher interest rates may also erode real estate and other asset values as well as hamper borrowers’ loan repayment ability. These will be matters of ongoing supervisory attention by the FDIC.
Chart 1:
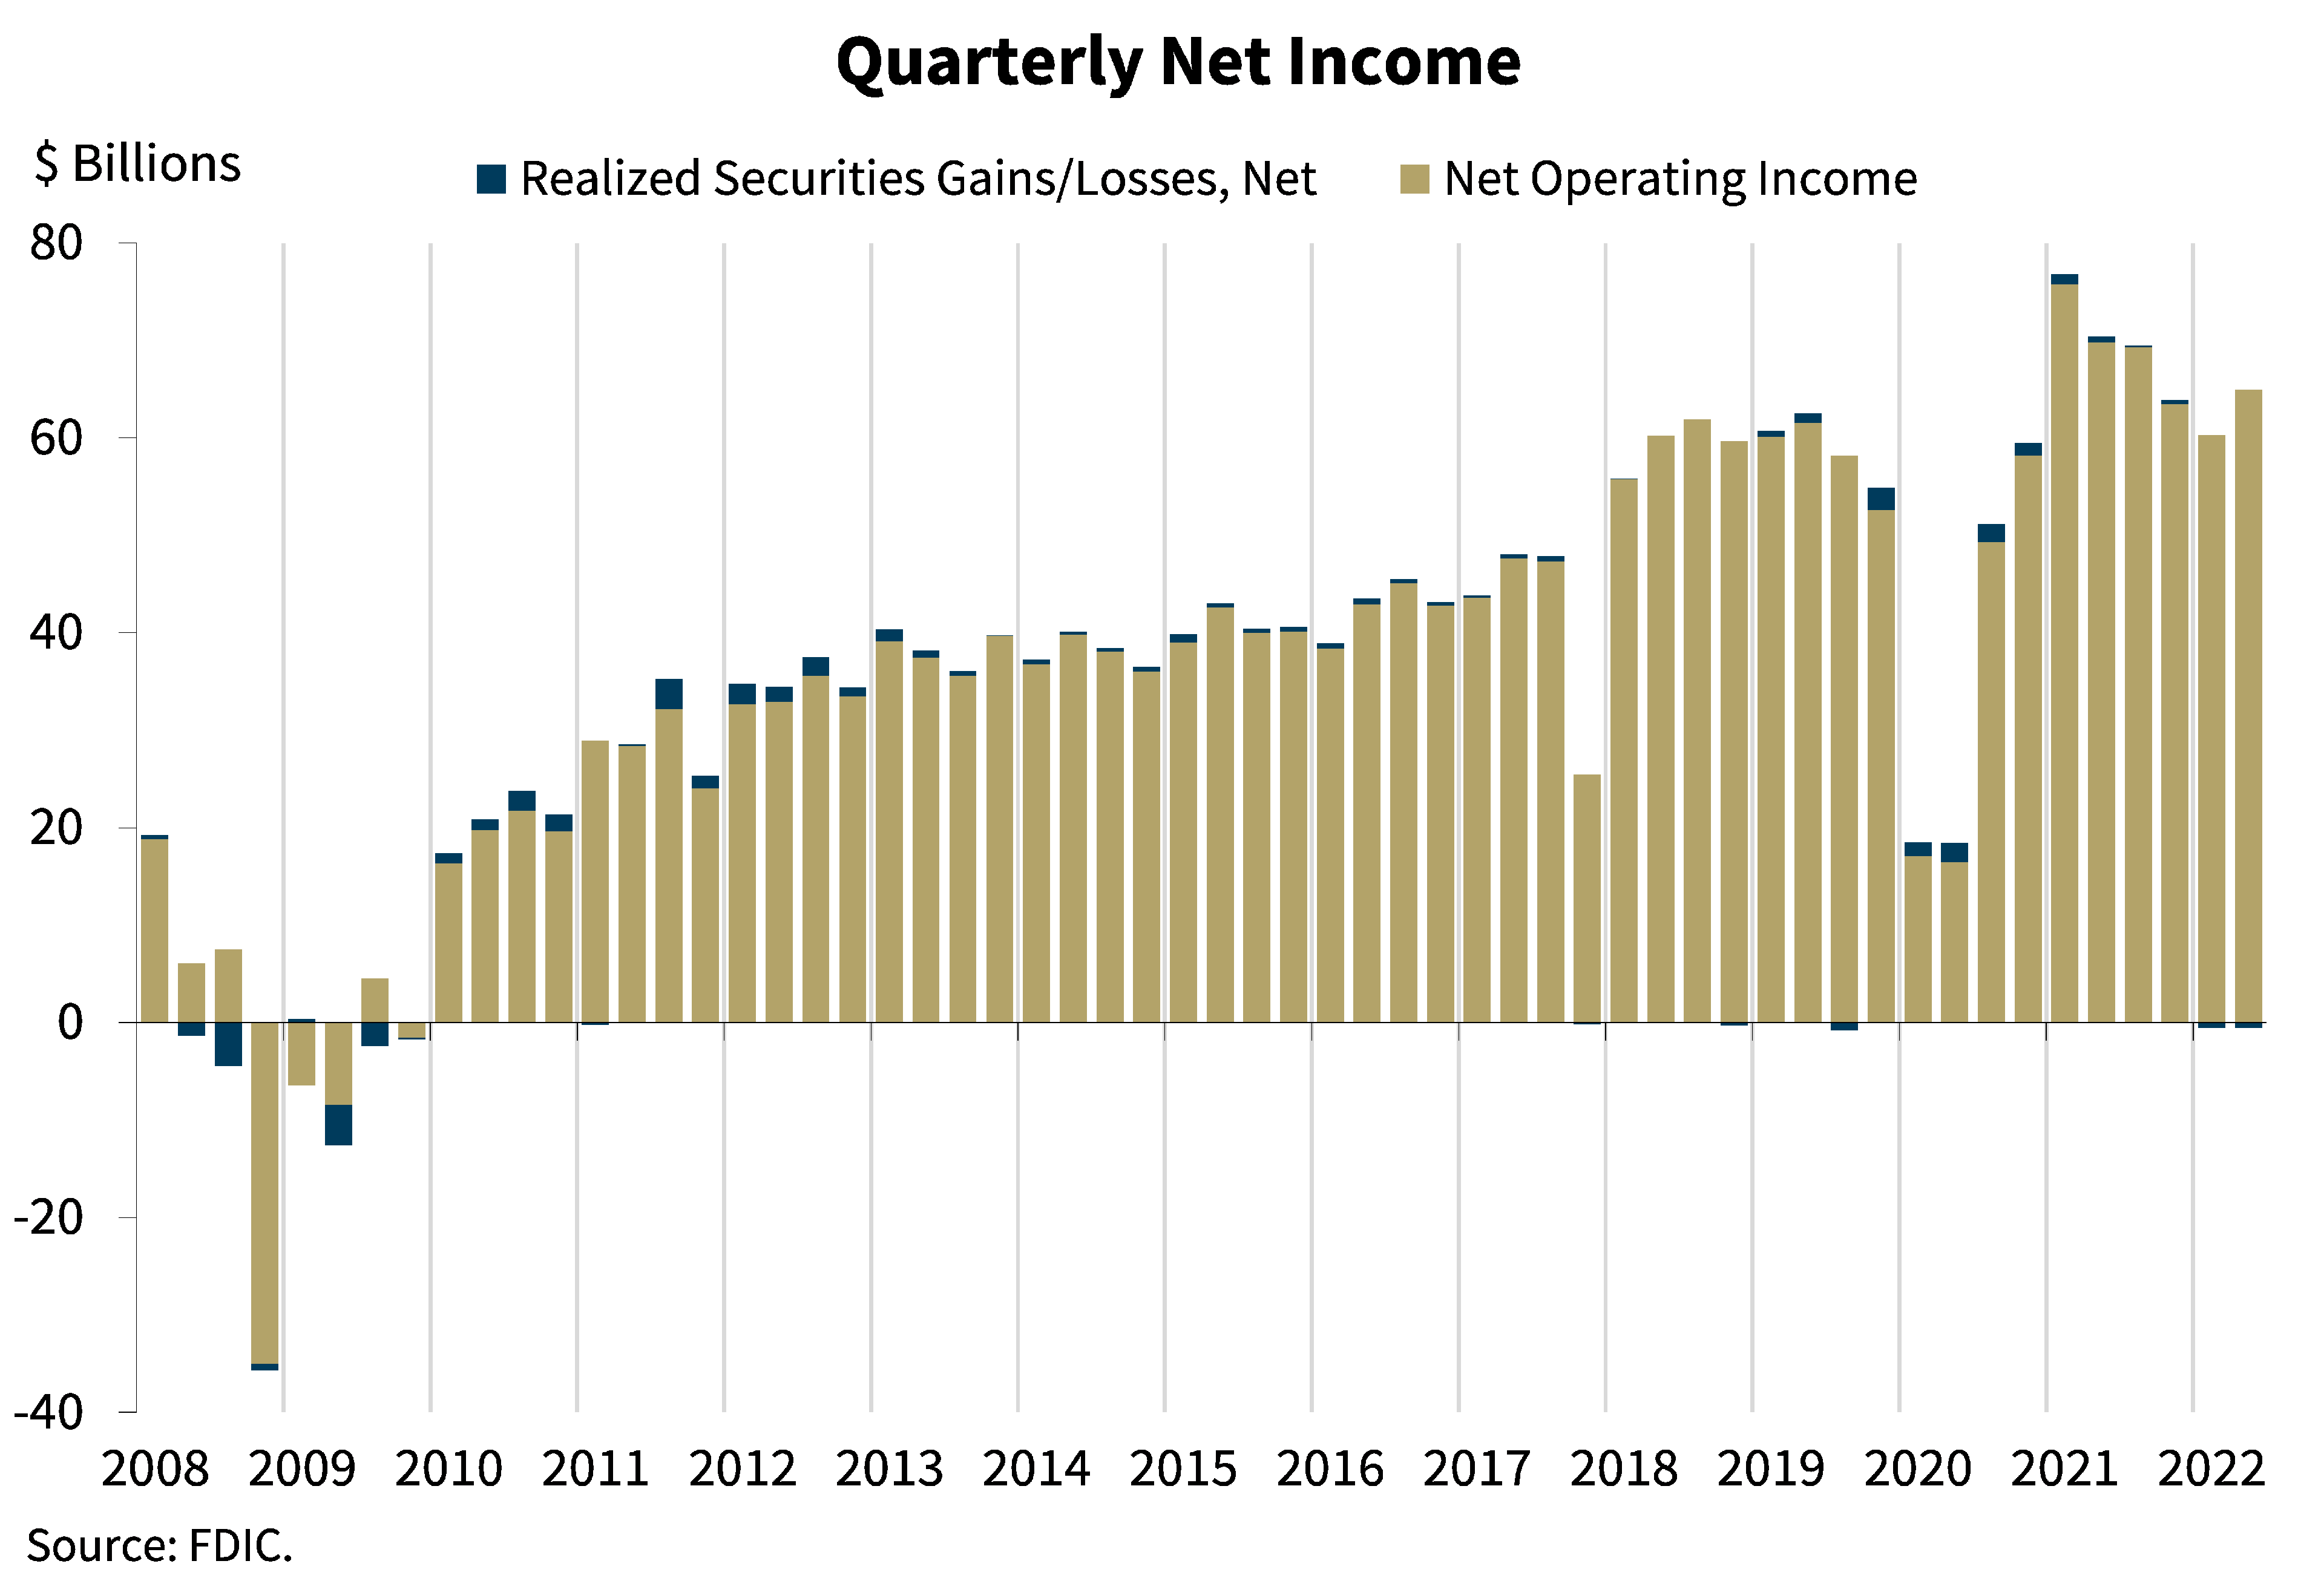
As shown in this chart, the banking industry reported net income of $64.4 billion in the second quarter, down $6.0 billion (or 8.5 percent) from the second quarter last year.
The banking industry, however, reported an increase in quarterly net income quarter over quarter. Strong growth in net interest income exceeded the growth in provision expense from the first quarter and drove a 7.8 percent increase in net income for the banking industry in the second quarter.
More than half of all banks reported lower quarterly net income relative to a year ago. However, strong net interest income growth supported an increase of 9.5 percent in net income for the banking industry from the first quarter 2022.
Provision expense was positive for a second consecutive quarter for the banking industry and totaled $11.1 billion in the second quarter. The quarterly increase in provision expense of $5.9 billion reflects the industry’s expectations of increased credit losses resulting from an increase in loan balances, slowing economic growth, and persistent economic uncertainties. The largest banks continued to drive the increase in provision expense from the year-ago quarter.
Compared with the industry, community banks reported a more moderate decline in net income from the year-ago quarter. Net income for community banks declined $523.0 million (or 6.5 percent), from second quarter 2021.
Unlike results for the industry, the decline in net income for community banks was driven by several factors, including higher noninterest expense, lower noninterest income, reduced revenue from the sale of securities, and, to a lesser degree, higher provisions for credit losses.
Chart 2:

Our next chart shows that quarterly net operating revenue increased 6.2 percent from first quarter 2022 to $228.0 billion. Net interest income as a percentage of average assets increased 22 basis points from the first quarter to 2.54 percent, but remains below the pre-pandemic level.
Noninterest income as a percentage of average assets was flat from first quarter, as the growth in noninterest income was on par with average asset growth.
Chart 3:
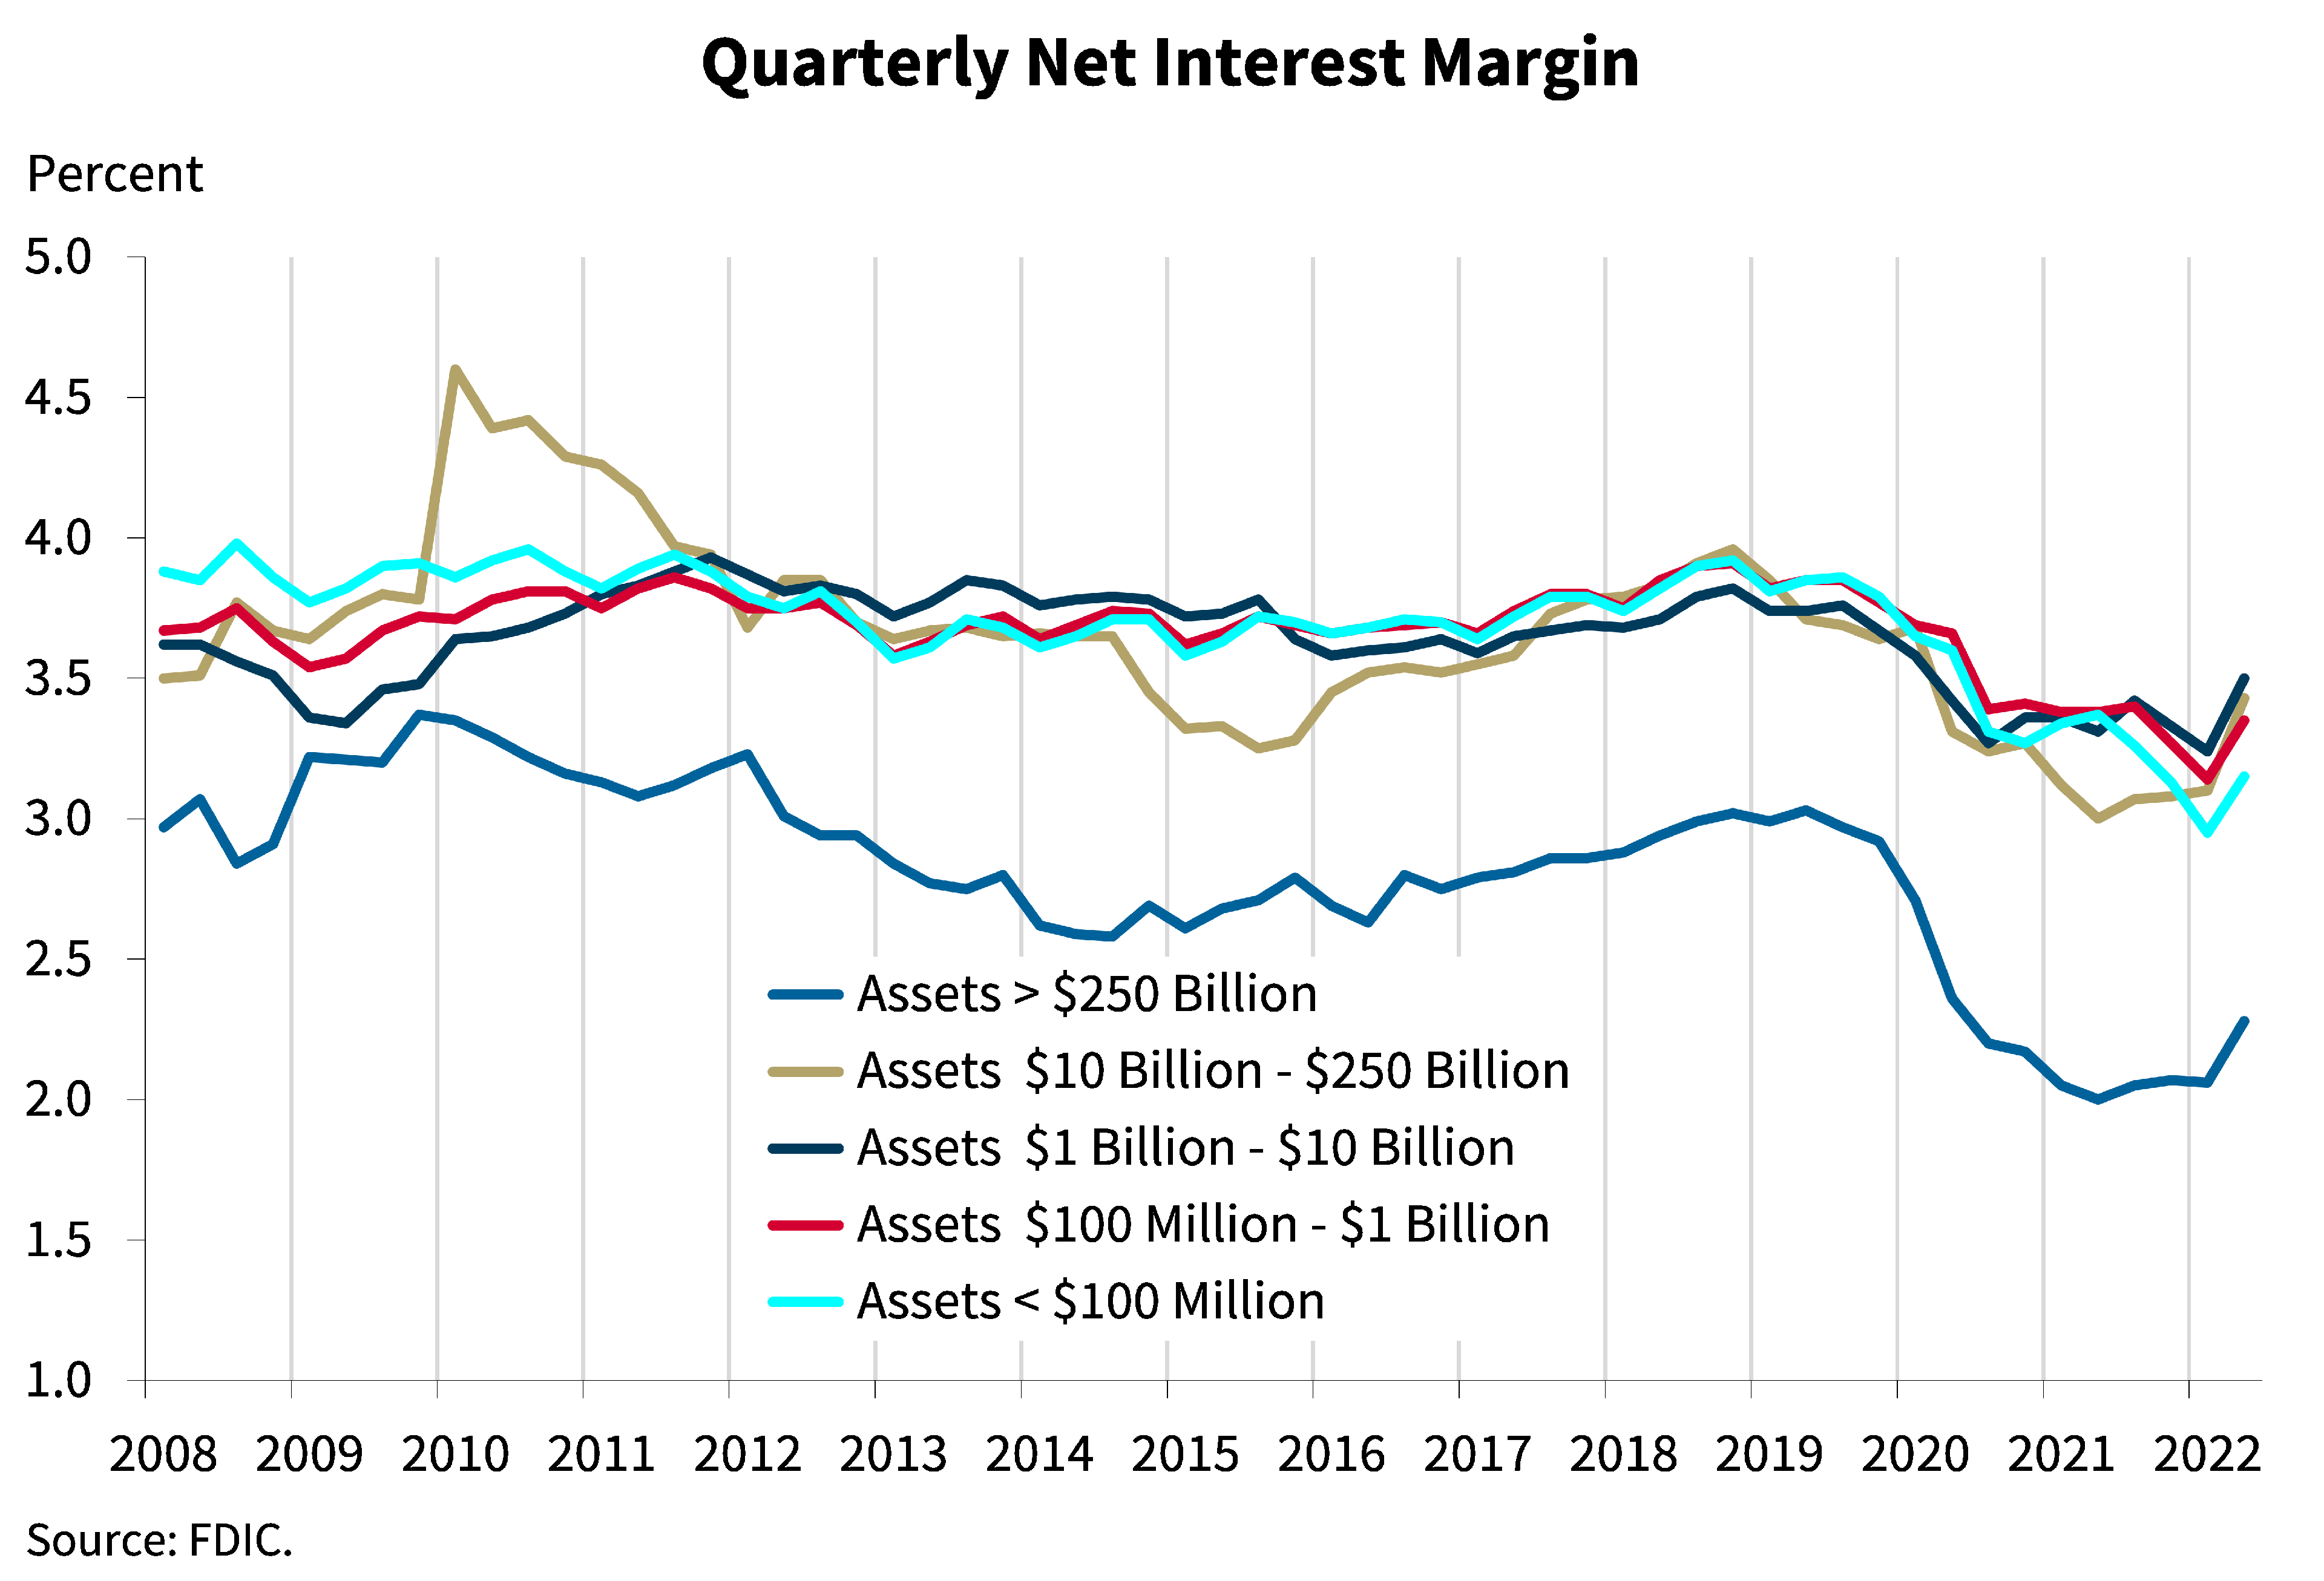
The next chart shows the net interest margin for the five asset size groups on which the QBP reports. The net interest margin for the banking industry as a whole widened in the second quarter, increasing 29 basis points from the year-ago quarter to 2.80 percent. Despite this improvement, the net interest margin remains well below the pre-pandemic average of 3.25 percent. All QBP asset size groups reported quarterly NIM growth. The NIM for banks in the $10 billion to $250 billion asset size group increased most among size groups due to a higher proportion and increased balance of higher-yielding credit card loans.
The net interest margin for community banks also expanded, but by a smaller amount when compared with the industry. The net interest margin at community banks widened 8 basis points from the year-ago quarter to 3.33 percent.
Chart 4:
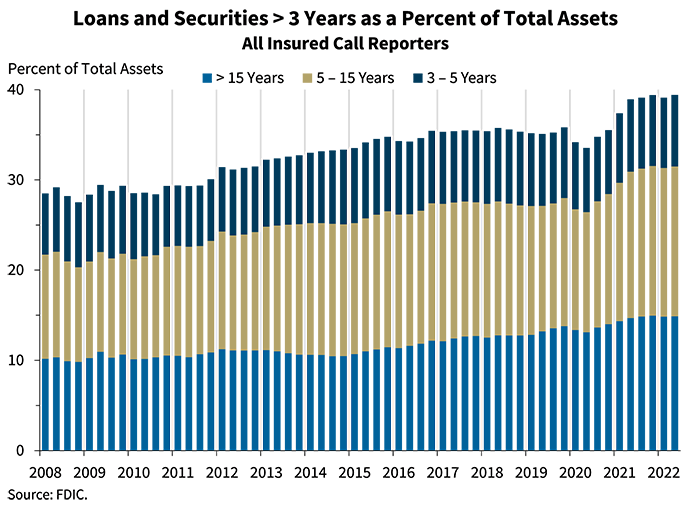
The next chart shows that the banking industry’s holdings of longer-term loans and securities remained elevated at 39.4 percent in the second quarter. Although this higher level of longer-term loans and securities helped preserve net interest margins during a period of lower interest rates, this strategy has resulted in an increase in the level of unrealized losses on investment securities as a result of increased interest rate risk.
Compared with the industry, community banks continued to report a higher proportion of assets with maturities longer than three years, which represent 53.6 percent of total assets.
Chart 5:
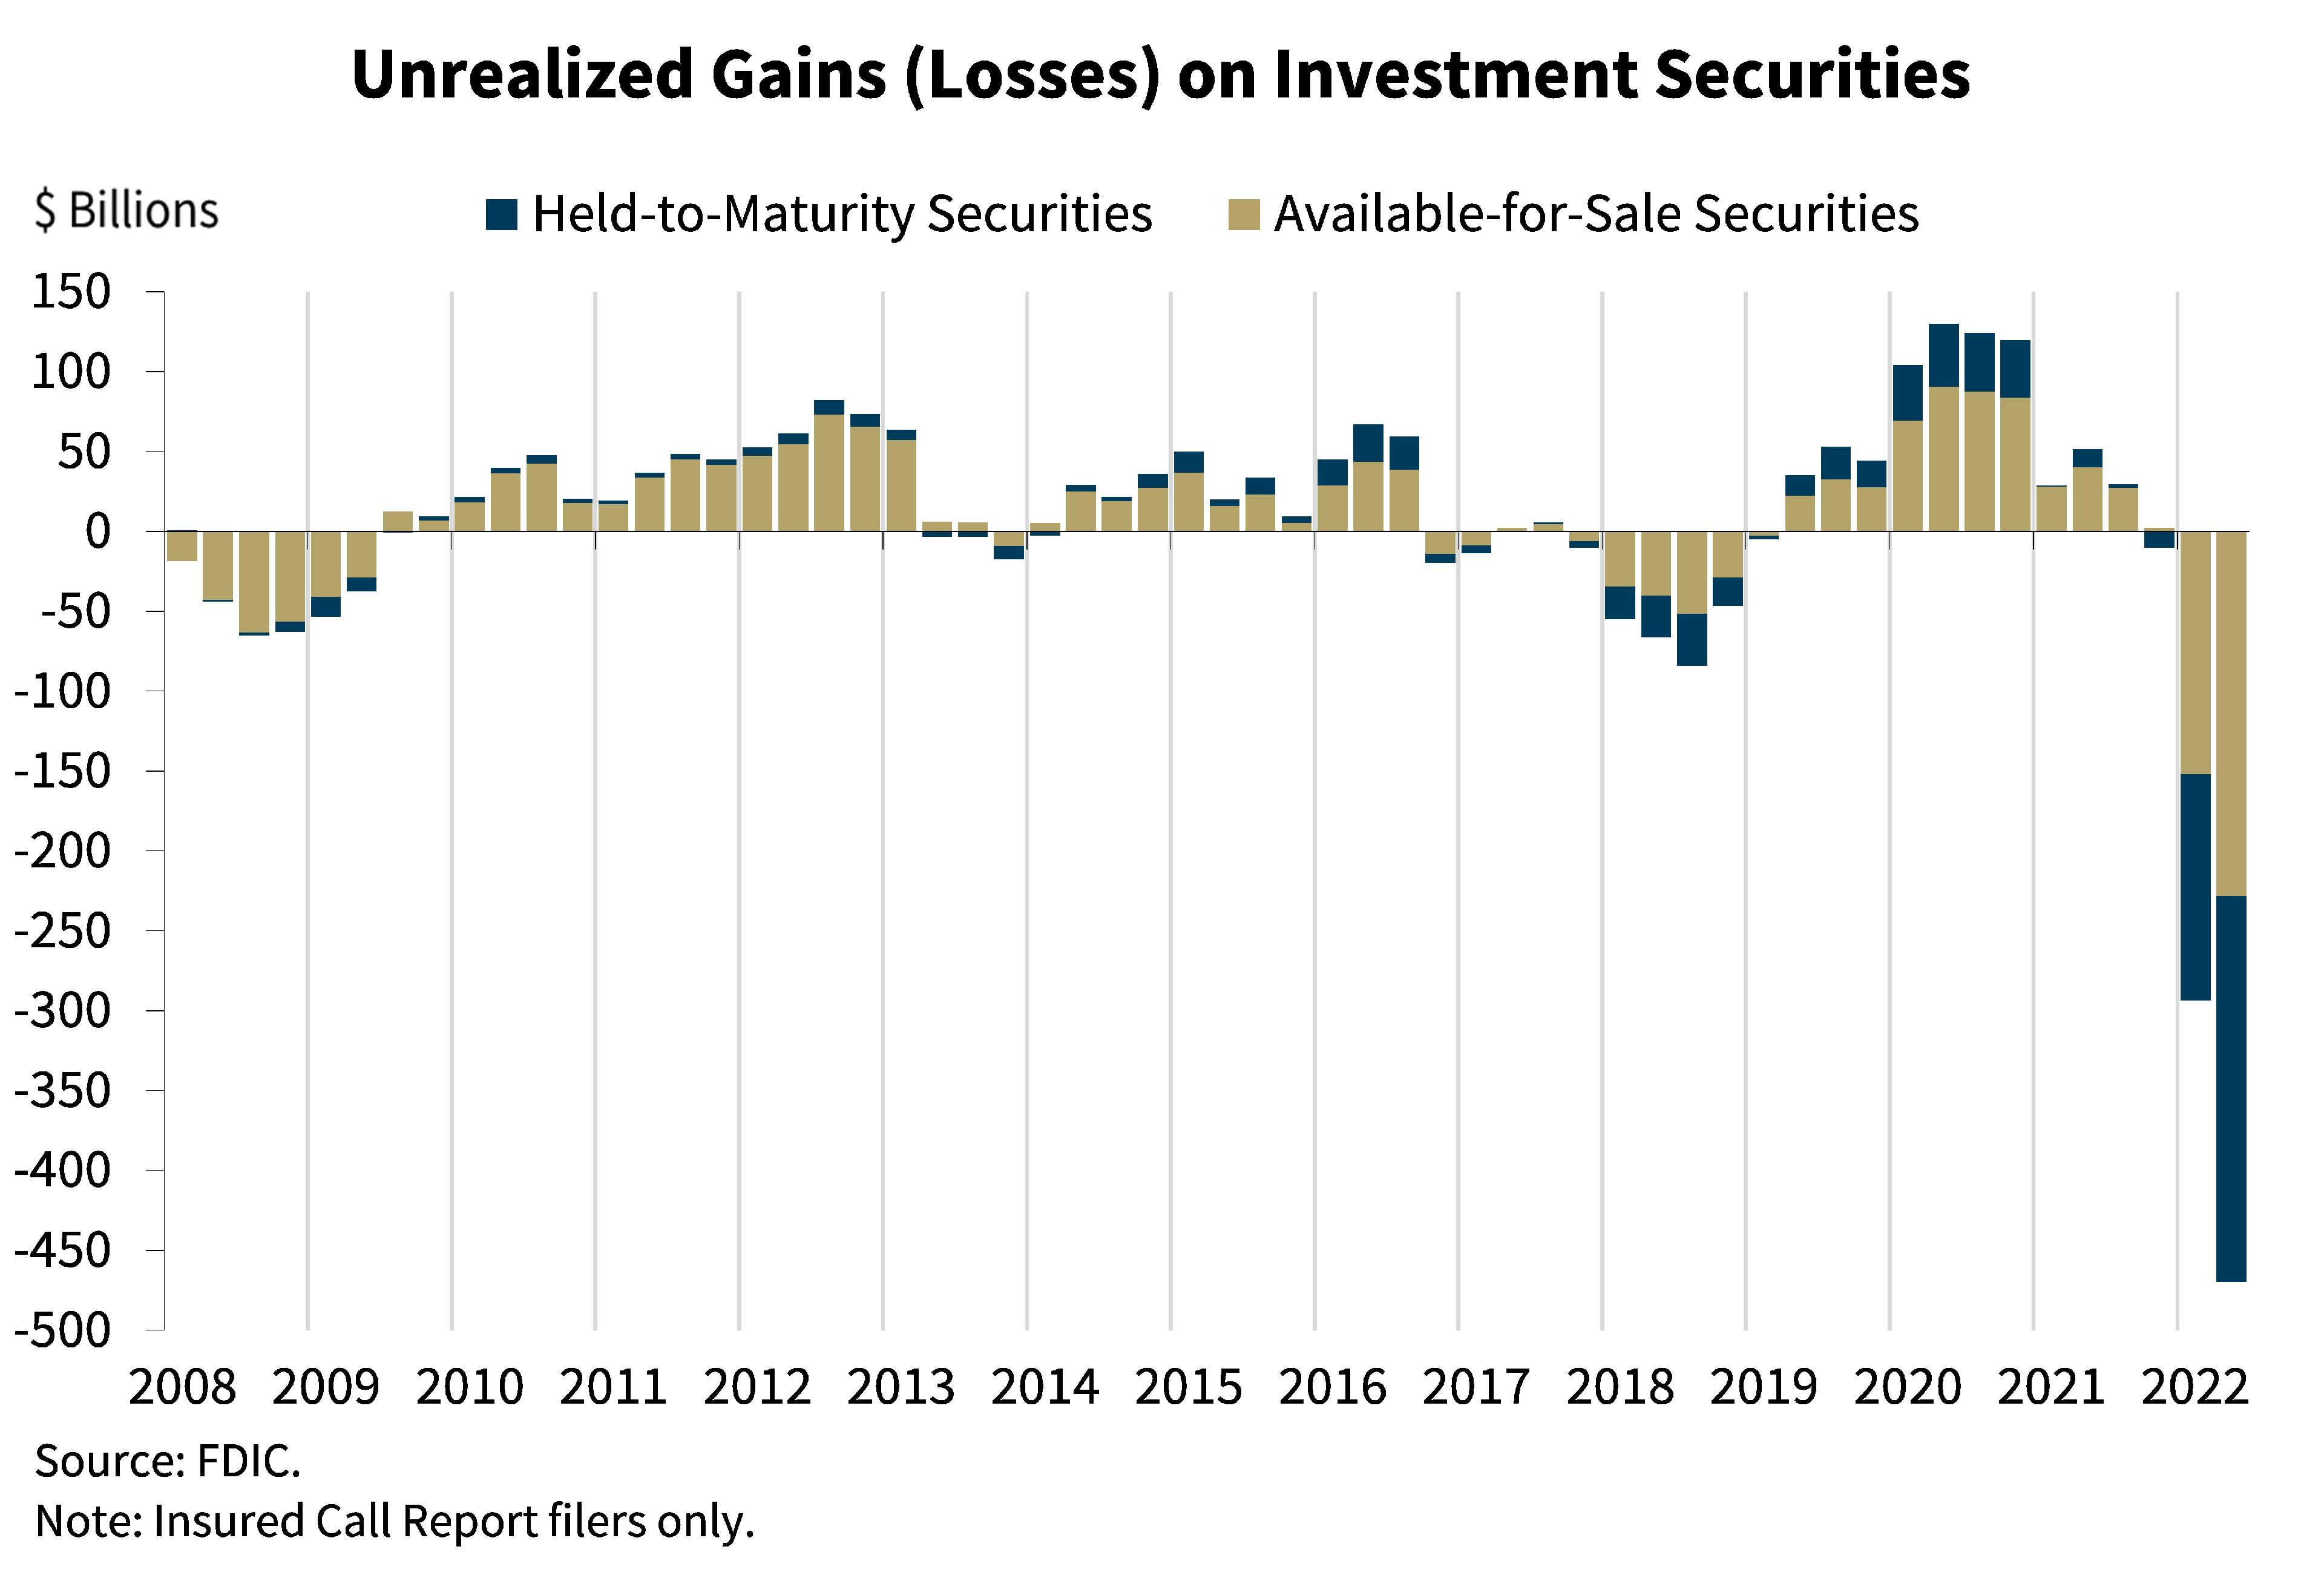
This chart shows the continued growth in unrealized losses on investment securities this quarter due to increases in market interest rates. Although growth in unrealized losses slowed somewhat in the second quarter, elevated asset maturities combined with a moderate decline in deposits underscores the risk of actual losses should banks need to sell investments to meet liquidity needs.
Chart 6:
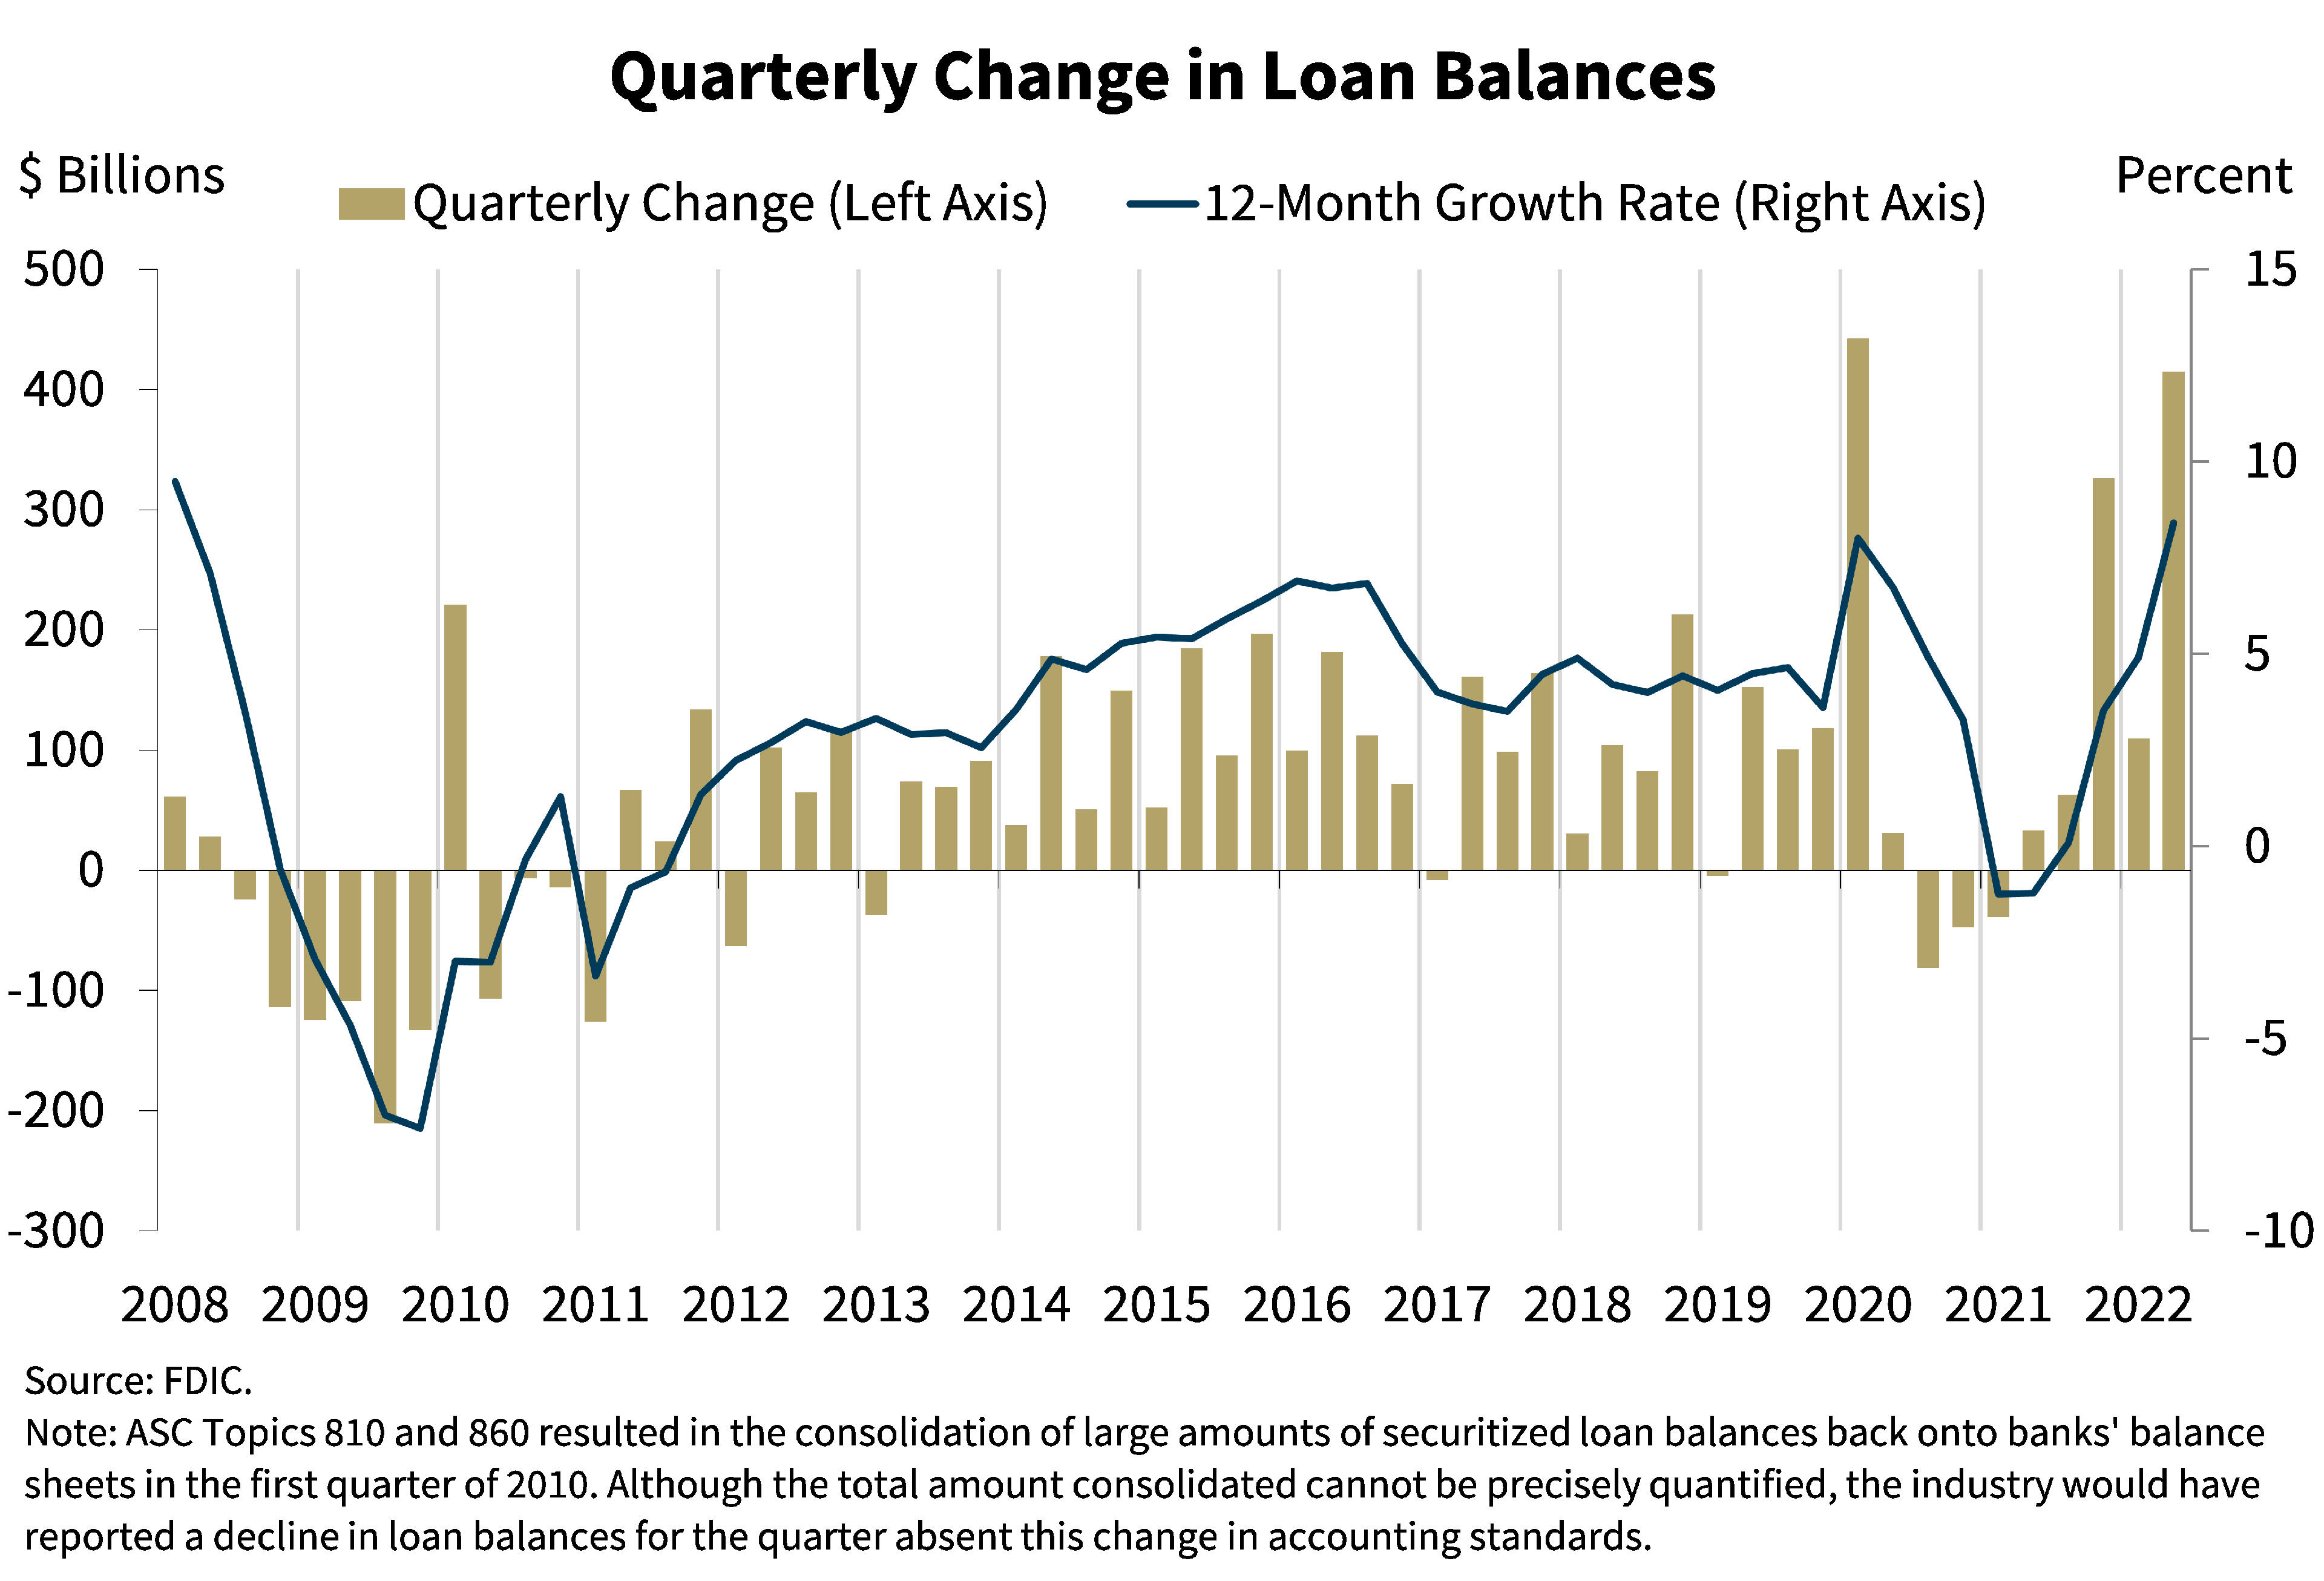
This chart shows that total loan balances grew for a fifth consecutive quarter, despite the continued payoff and forgiveness of Paycheck Protection Program (PPP) loans. Loan growth for the industry exceeded the pre-pandemic average pace even without adjusting for the reduction in PPP loan balances.
The banking industry reported growth in several loan portfolios from the year-ago quarter, led by consumer loans, primarily credit card loans. Loan balances grew 8.4 percent from the previous year for the banking industry, the highest annual growth rate reported since first quarter 2008.
Community banks reported a 4.9 percent increase in loan balances from the previous quarter and a 7.7 percent increase in loan balances from the prior year. Commercial real estate loan portfolios continued to drive annual loan growth for community banks.
PPP loan payoffs and forgiveness continued to limit loan growth rates. Excluding the effects of PPP loan payoffs, the annual loan growth rate would have been 11.5 percent for the industry and 14.0 percent for community banks.
Chart 7:
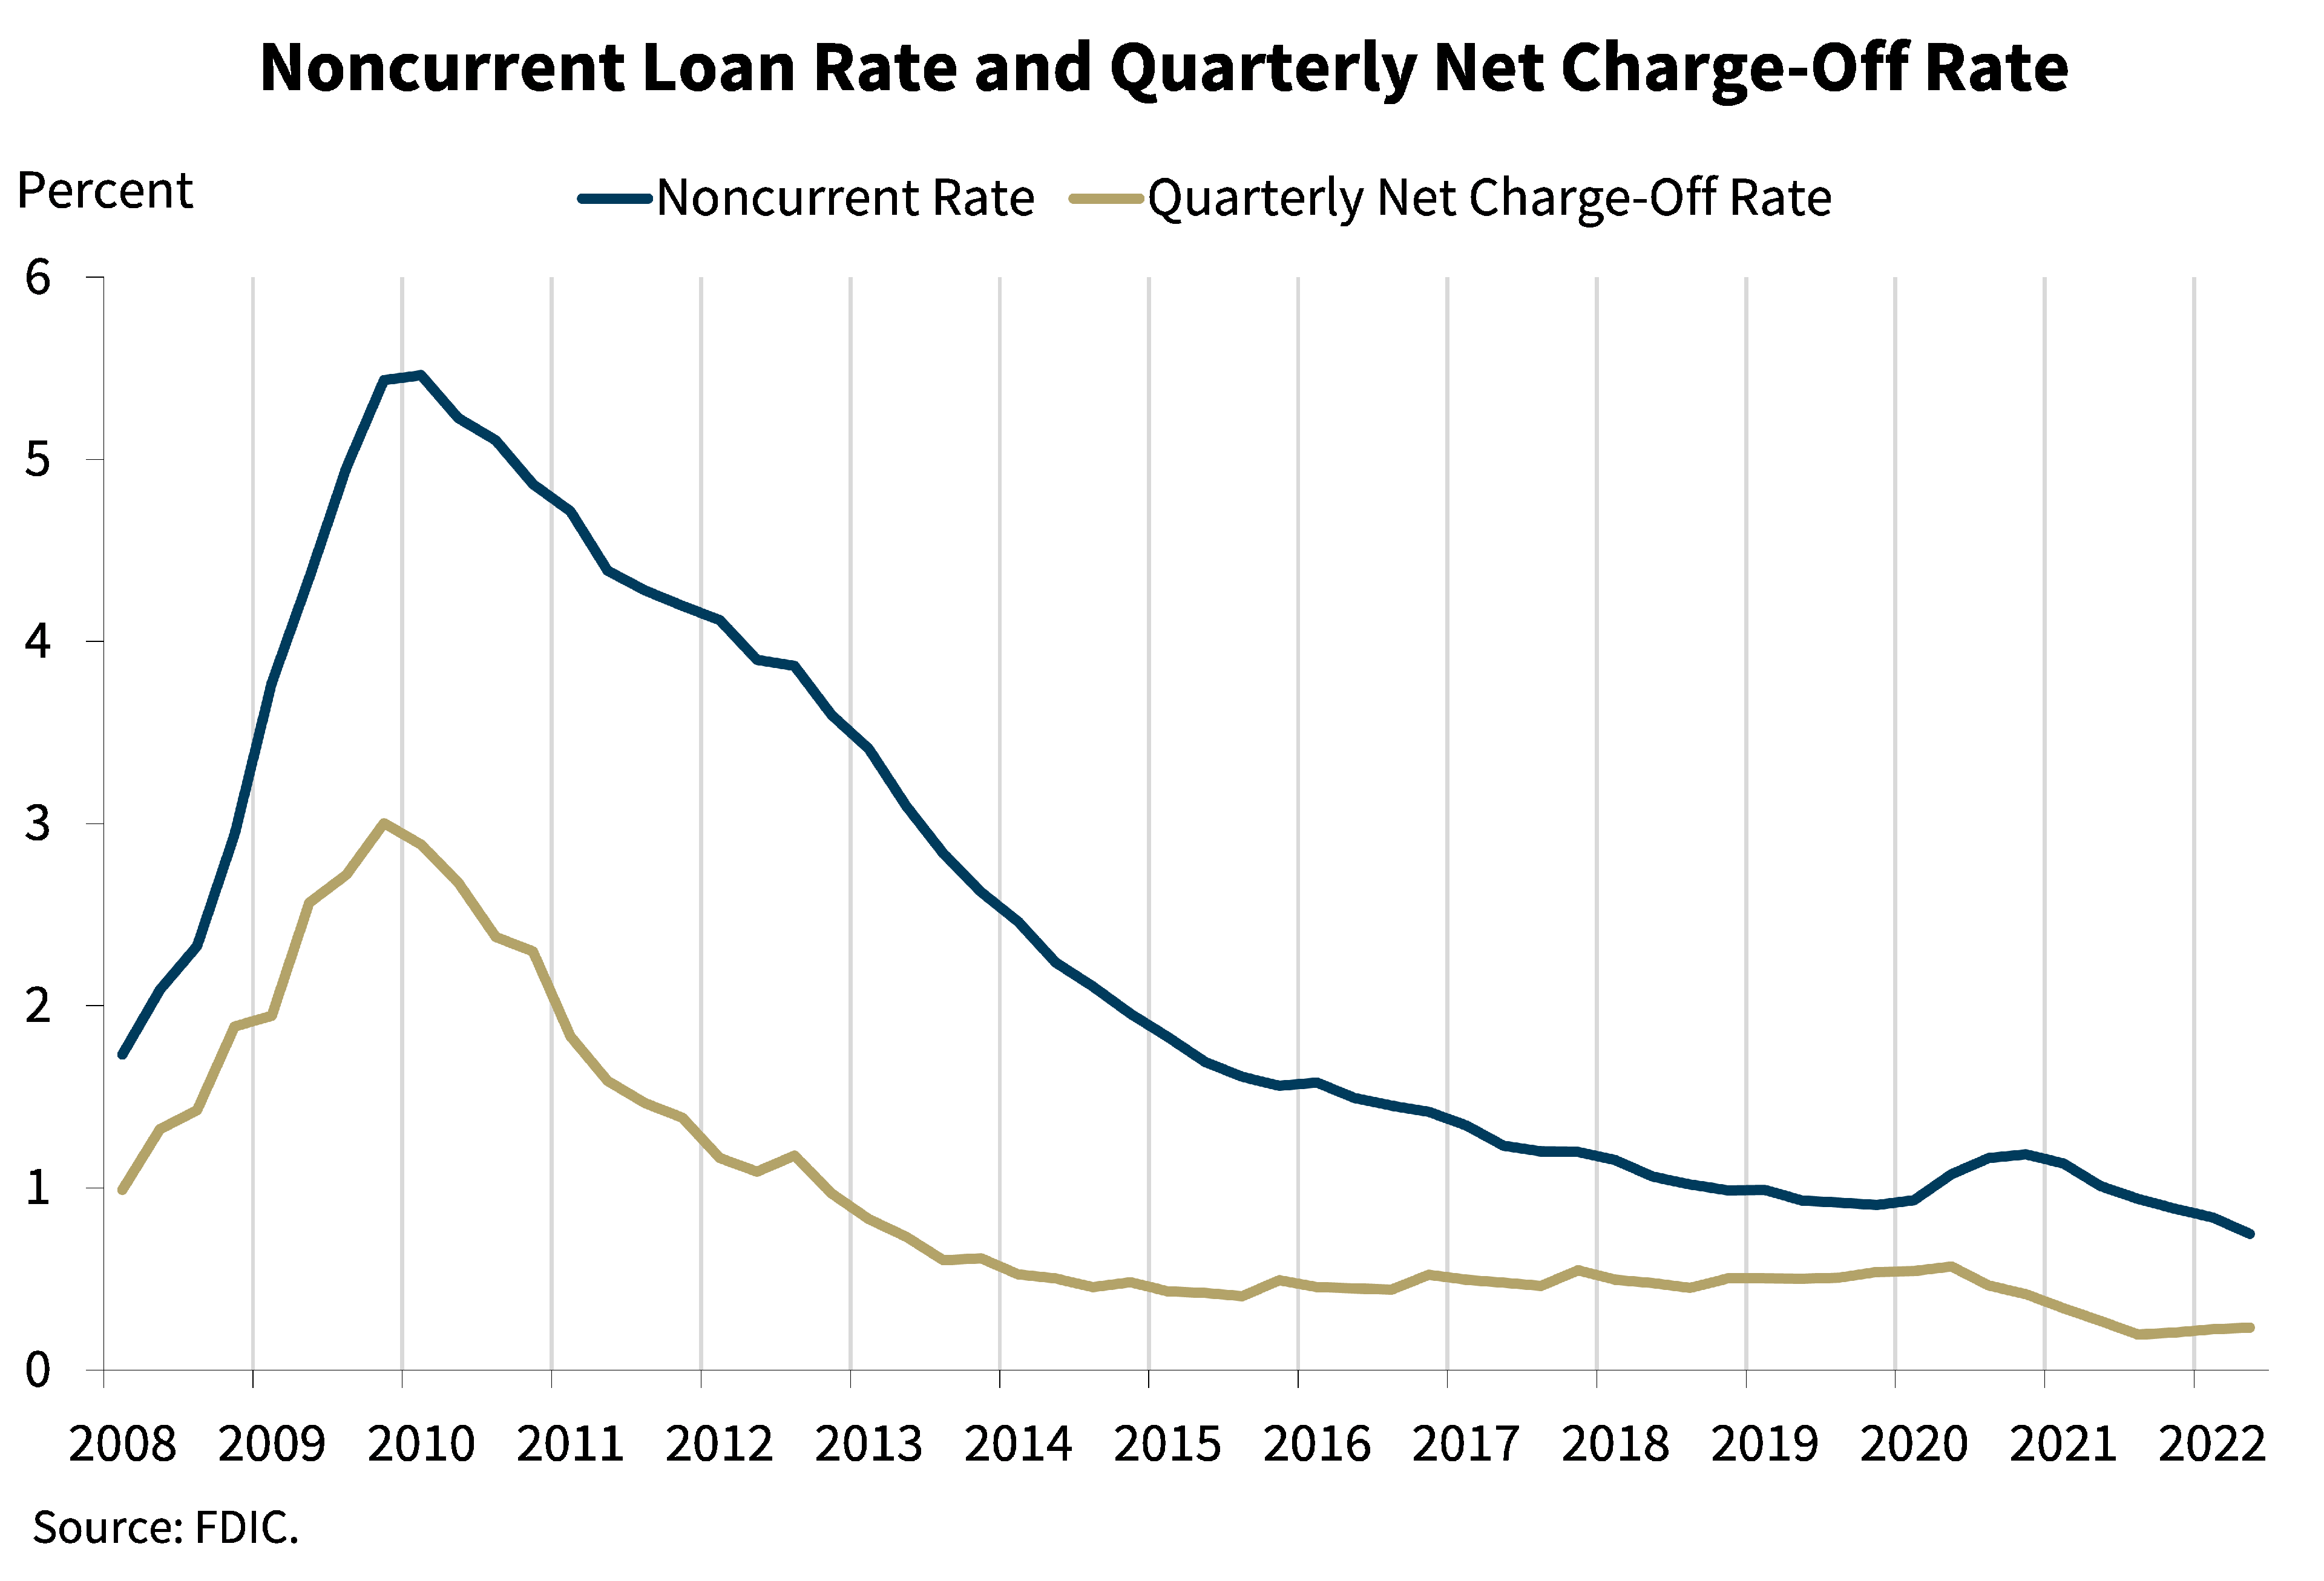
Our next chart shows that asset quality ratios for the industry remain favorable. The noncurrent and net charge-off rates are only slightly above historical lows. The noncurrent rate declined 9 basis points from first quarter to 0.75 percent, driven by reductions in noncurrent 1 to 4 family residential real estate loan balances. Continued reductions in credit card and commercial and industrial loan net charge-offs supported a 4-basis point reduction in the industry’s net charge-off from one year ago to 0.23 percent.
Despite the improvement in more severe delinquencies, early delinquencies (loans past due 30-89 days) increased from the year-ago quarter, driven by past due consumer loans. This increase drove a 6 basis point increase in the past due rate to 0.48 percent from the year-ago quarter. These early delinquencies could be an indicator of future asset quality risk and will be an area of supervisory monitoring.
Community banks reported stable or improving credit quality metrics. The community bank noncurrent rate declined 4 basis points from the previous quarter to 0.51 percent—the lowest level on QBP record. The community bank net charge-off rate was unchanged from a year ago at 0.05 percent. Early delinquencies for community banks also increased from the year-ago quarter, driven by an increase in past due consumer loan balances. However, growth in past due loans at community banks was offset by an increase in loan balances, so the past due rate remained stable at 0.31 percent.
Chart 8:
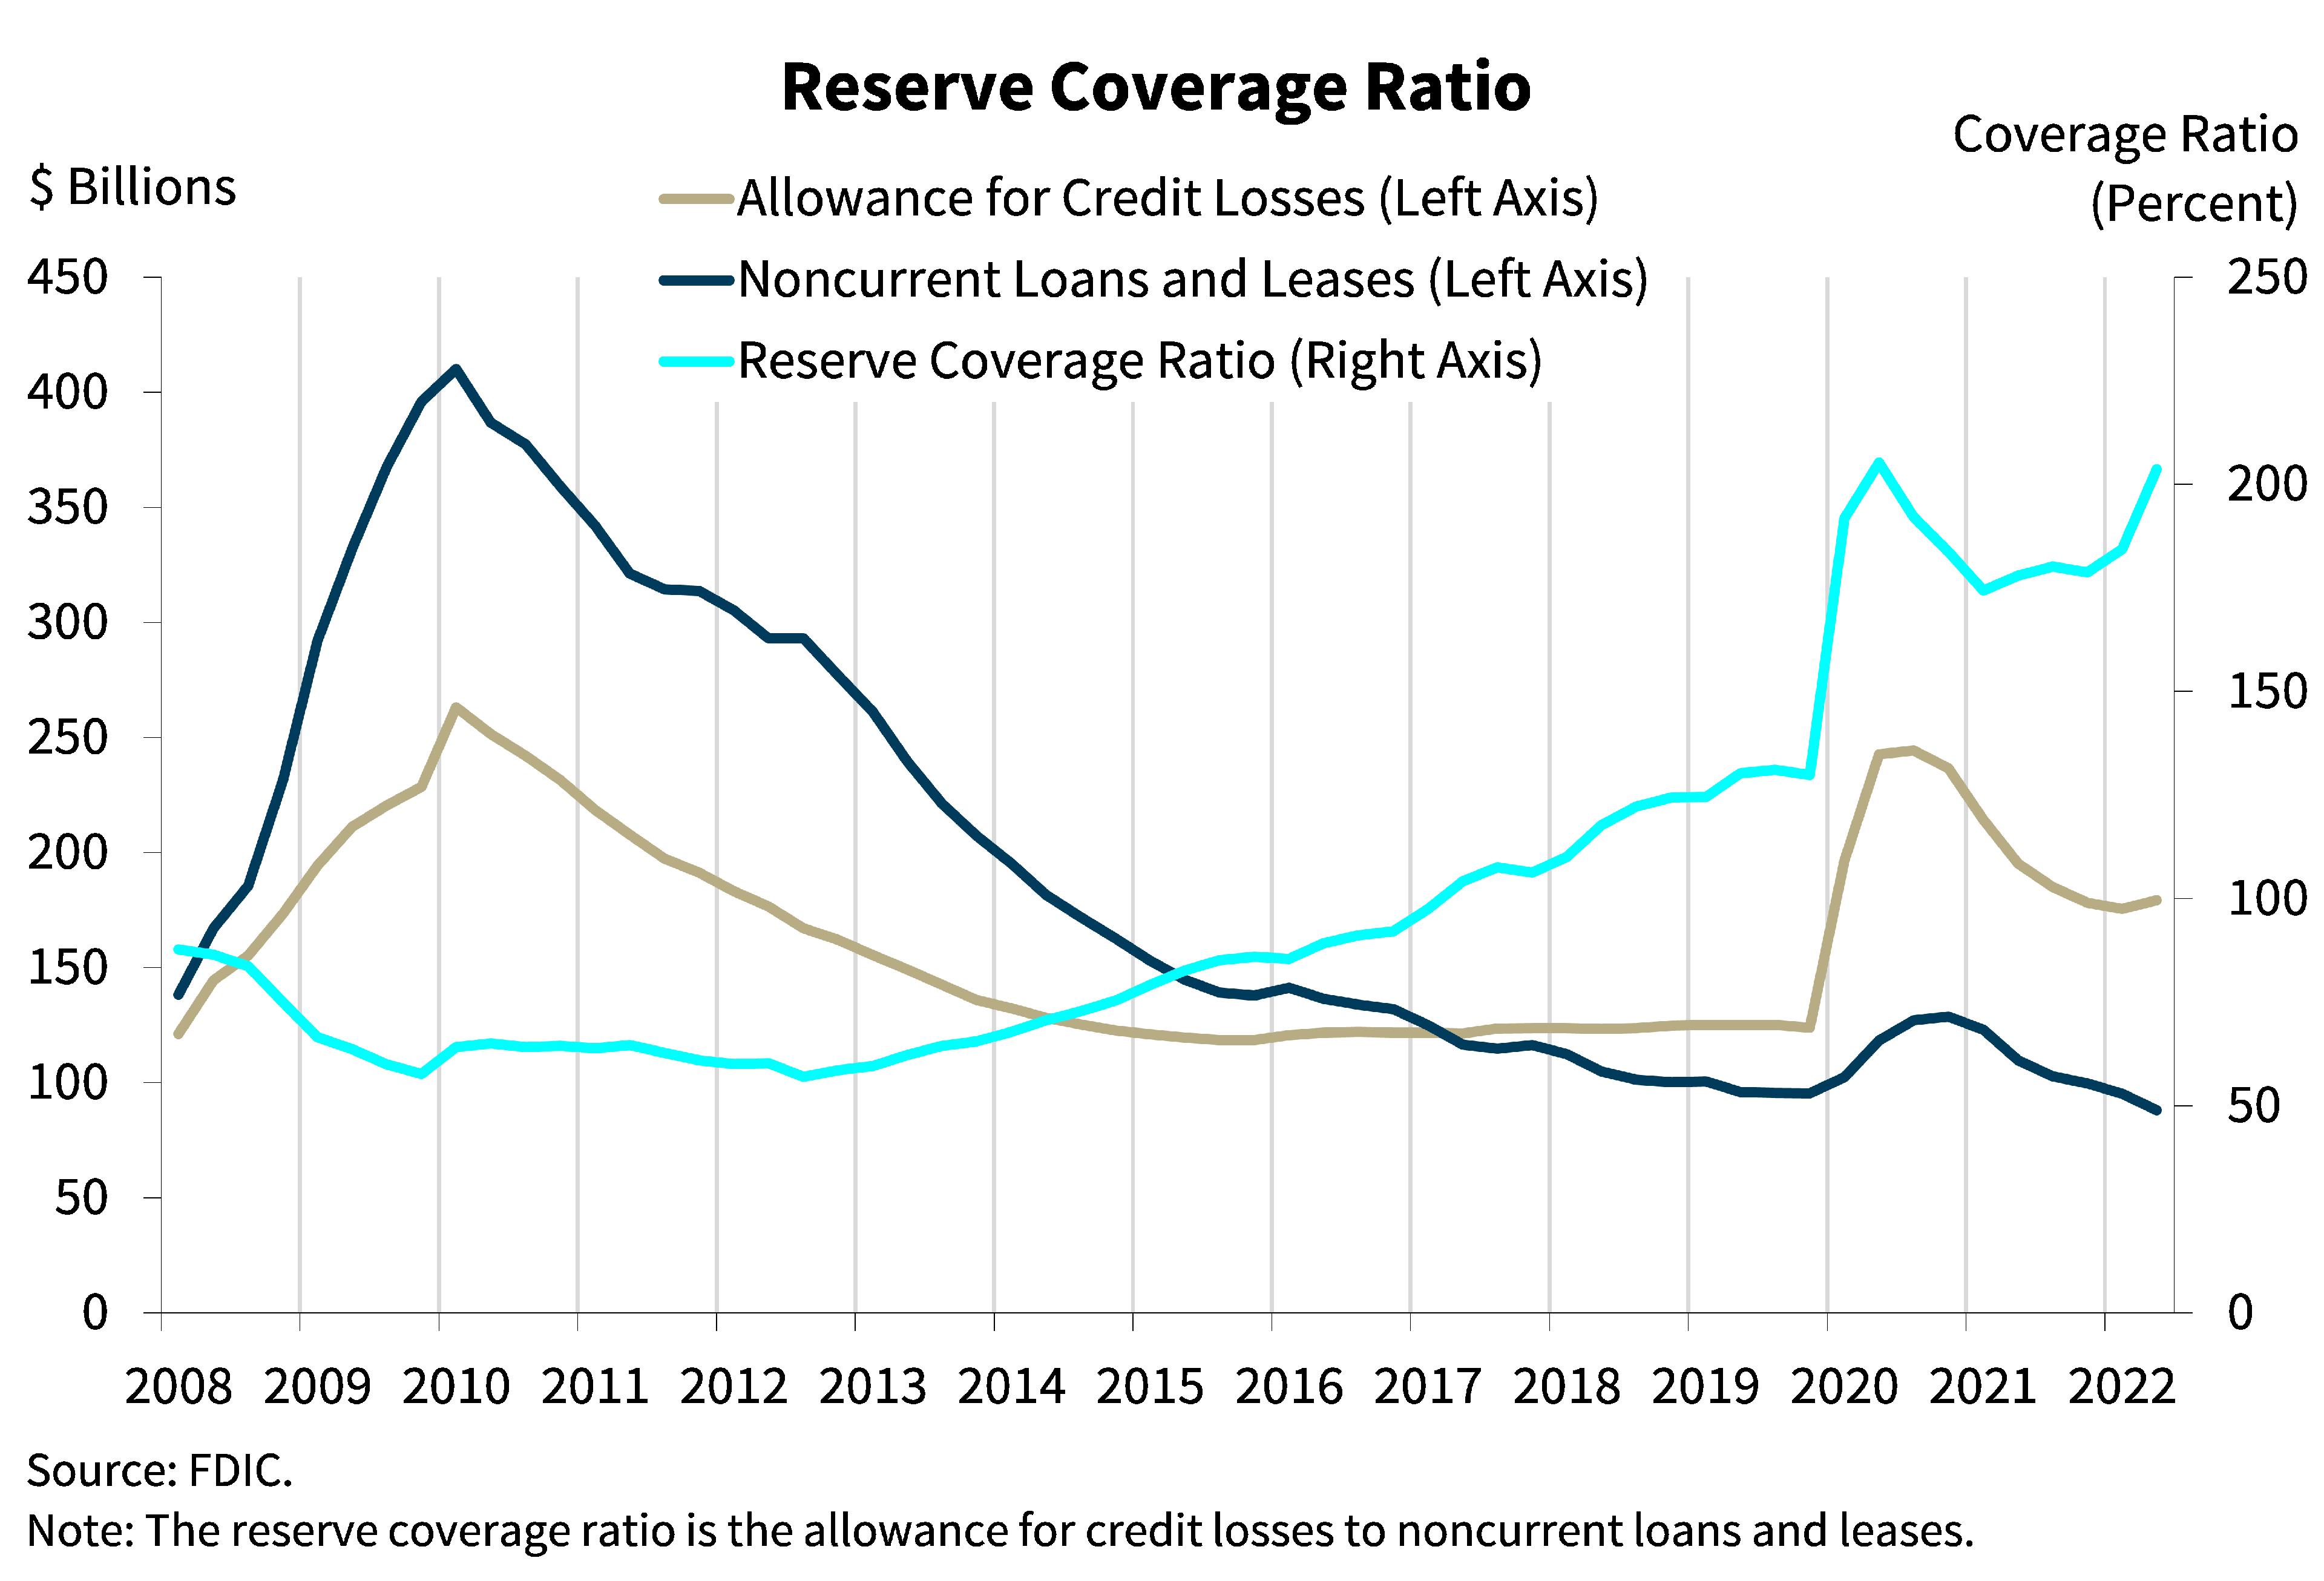
Our next chart shows that noncurrent loans fell by a greater amount than the allowance for credit losses year-over-year, resulting in an improvement in the average reserve coverage ratio. The ratio of credit loss reserves to noncurrent loans increased from 177.9 percent one year ago to 203.6 percent this quarter.
Chart 9:
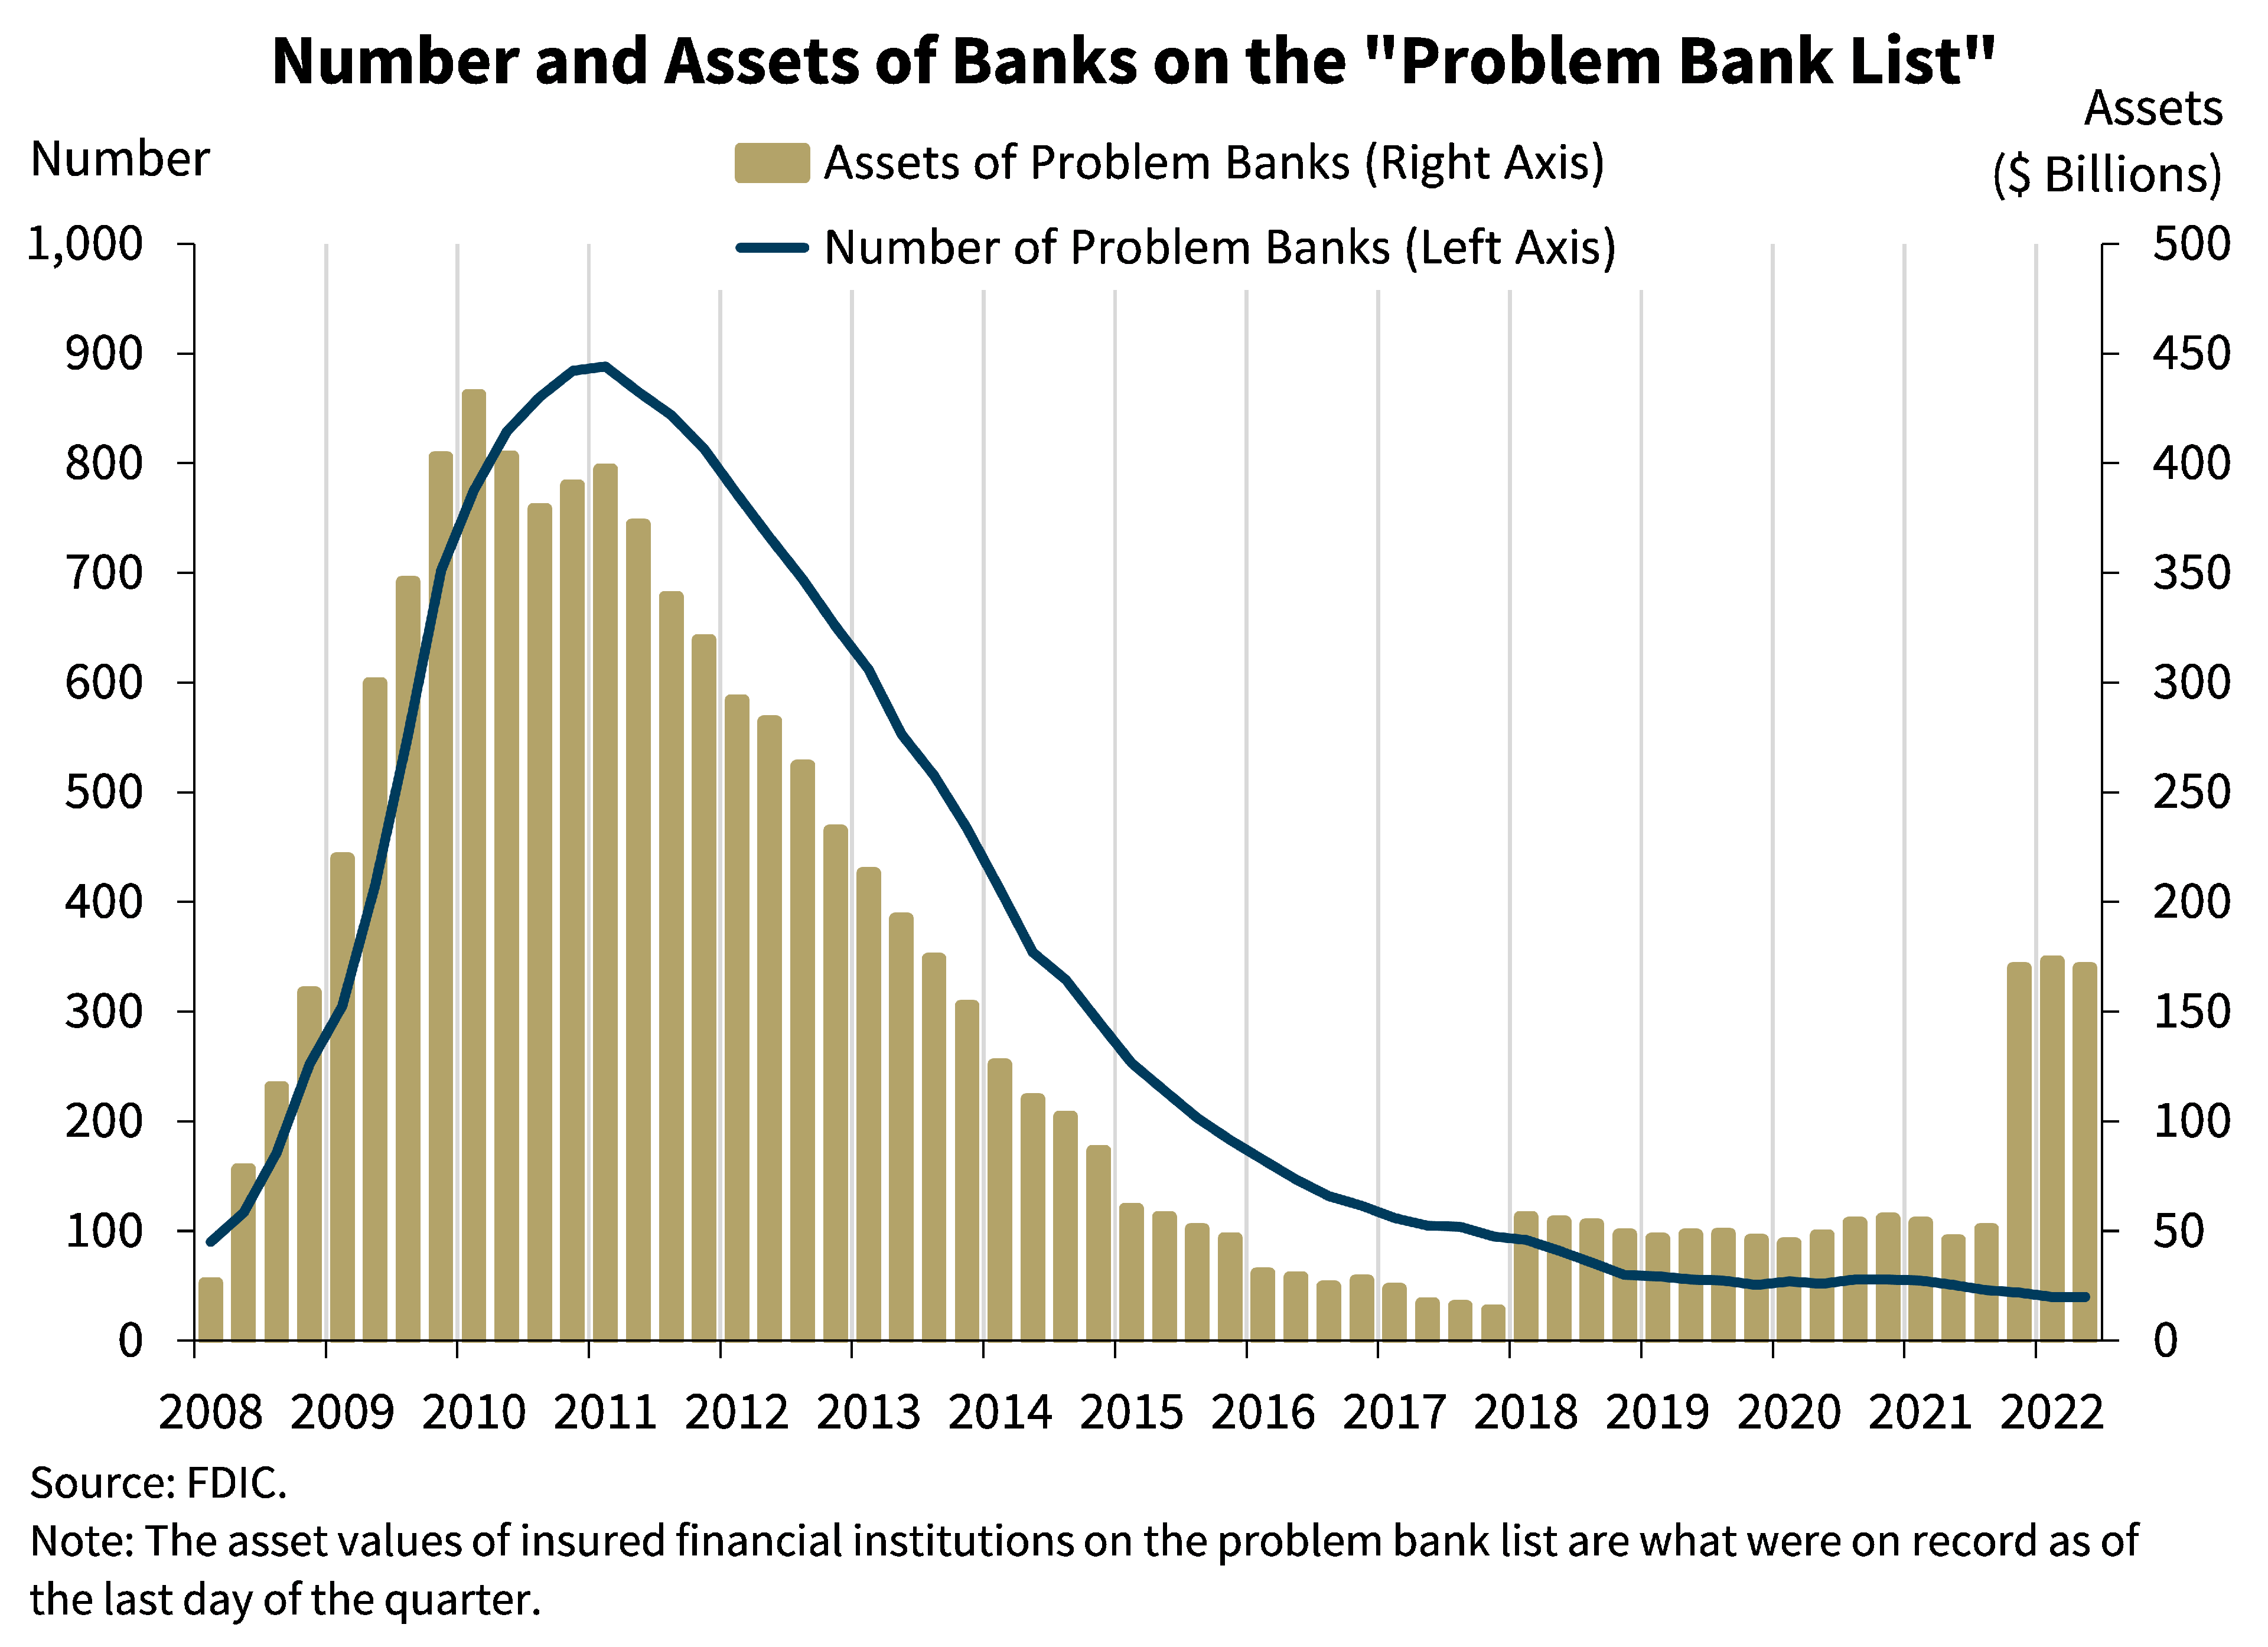
This chart shows the number and total assets of banks on the “Problem Bank List.” The number of banks on the list is unchanged from the previous quarter at 40 banks. Total assets held by problem banks declined a slight $2.7 billion to $170.4 billion in the second quarter. The number of problem banks continues to be at its lowest level since QBP data collection began in 1984. No banks failed in the second quarter.
Chart 10:
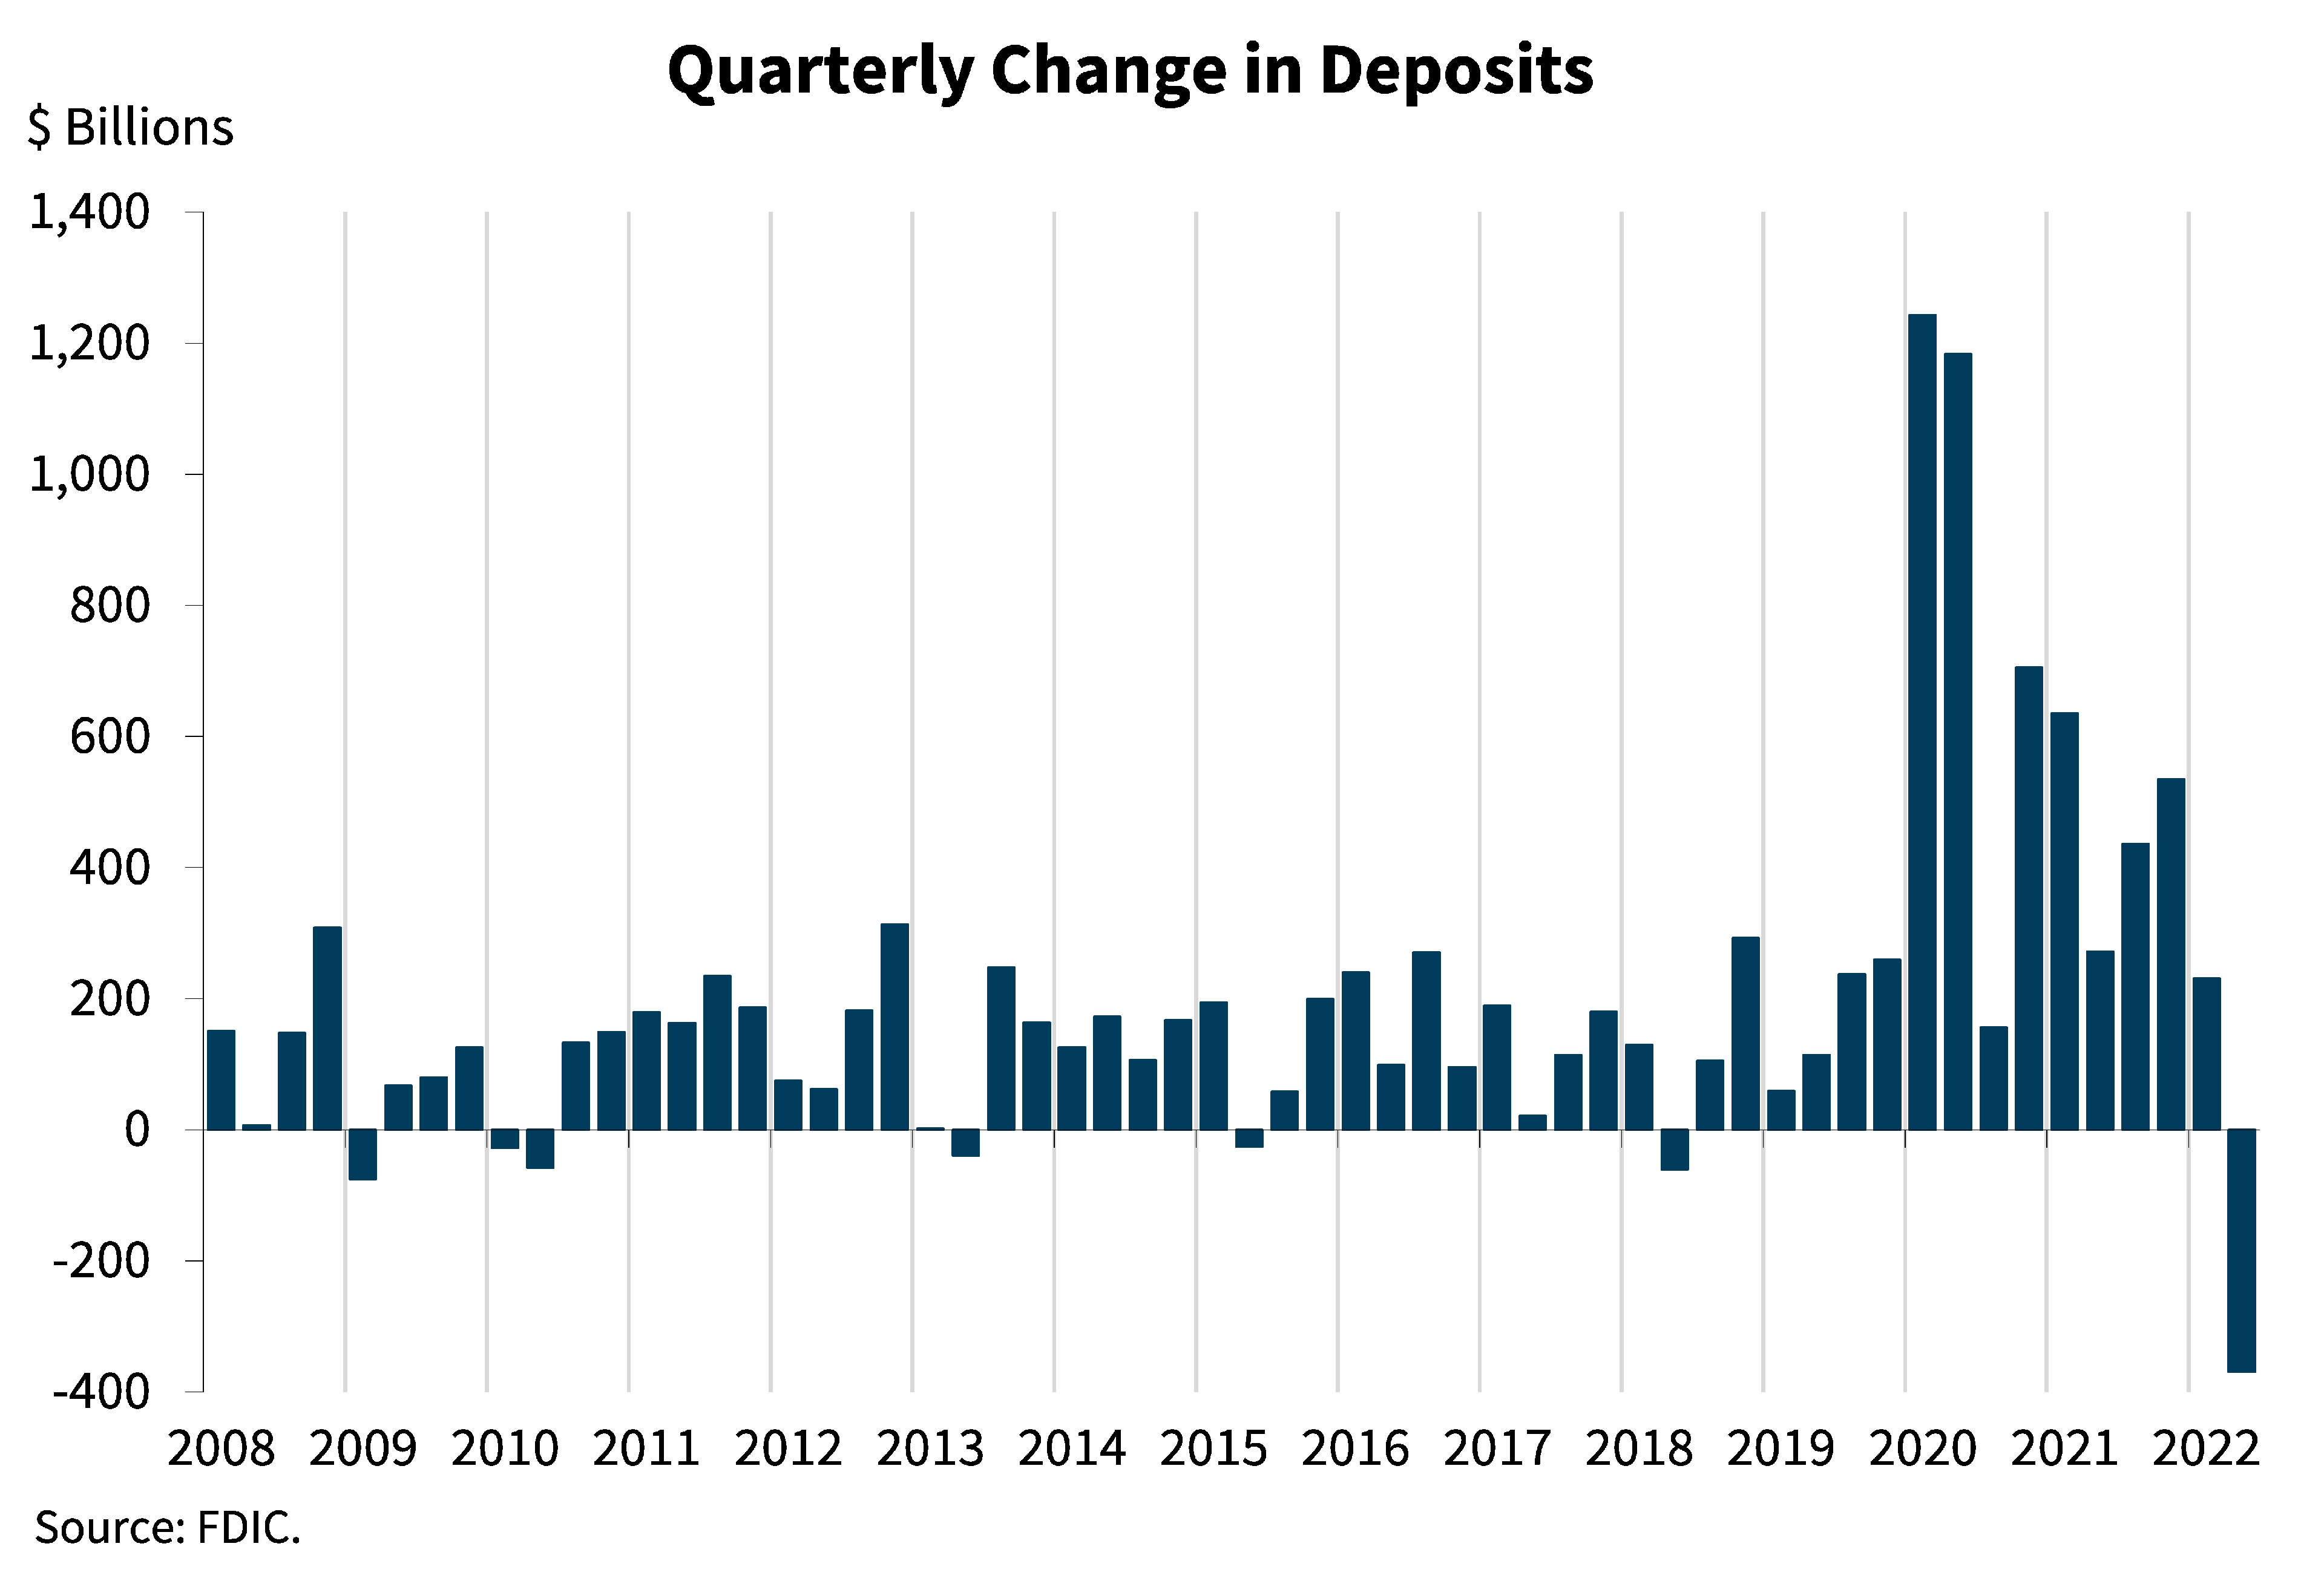
This chart shows that deposits declined for the first time since 2018. A reduction in uninsured deposits was the primary driver of the quarterly decline, although there was also a small reduction in insured deposits. The banking industry also reported an increase in wholesale funding, primarily Federal Home Loan Bank borrowings, for the second consecutive quarter, as deposit growth declined.
Deposits totaled $19.6 trillion, down 1.9 percent from the level reported last quarter. While this reduction slightly offsets the unprecedented growth in deposits reported during the pandemic, total deposits are still well above pre-pandemic levels. As of the second quarter, deposit levels remain elevated at 82.4 percent of total assets, higher than the pre-pandemic average of 76.7 percent.
Chart 11:
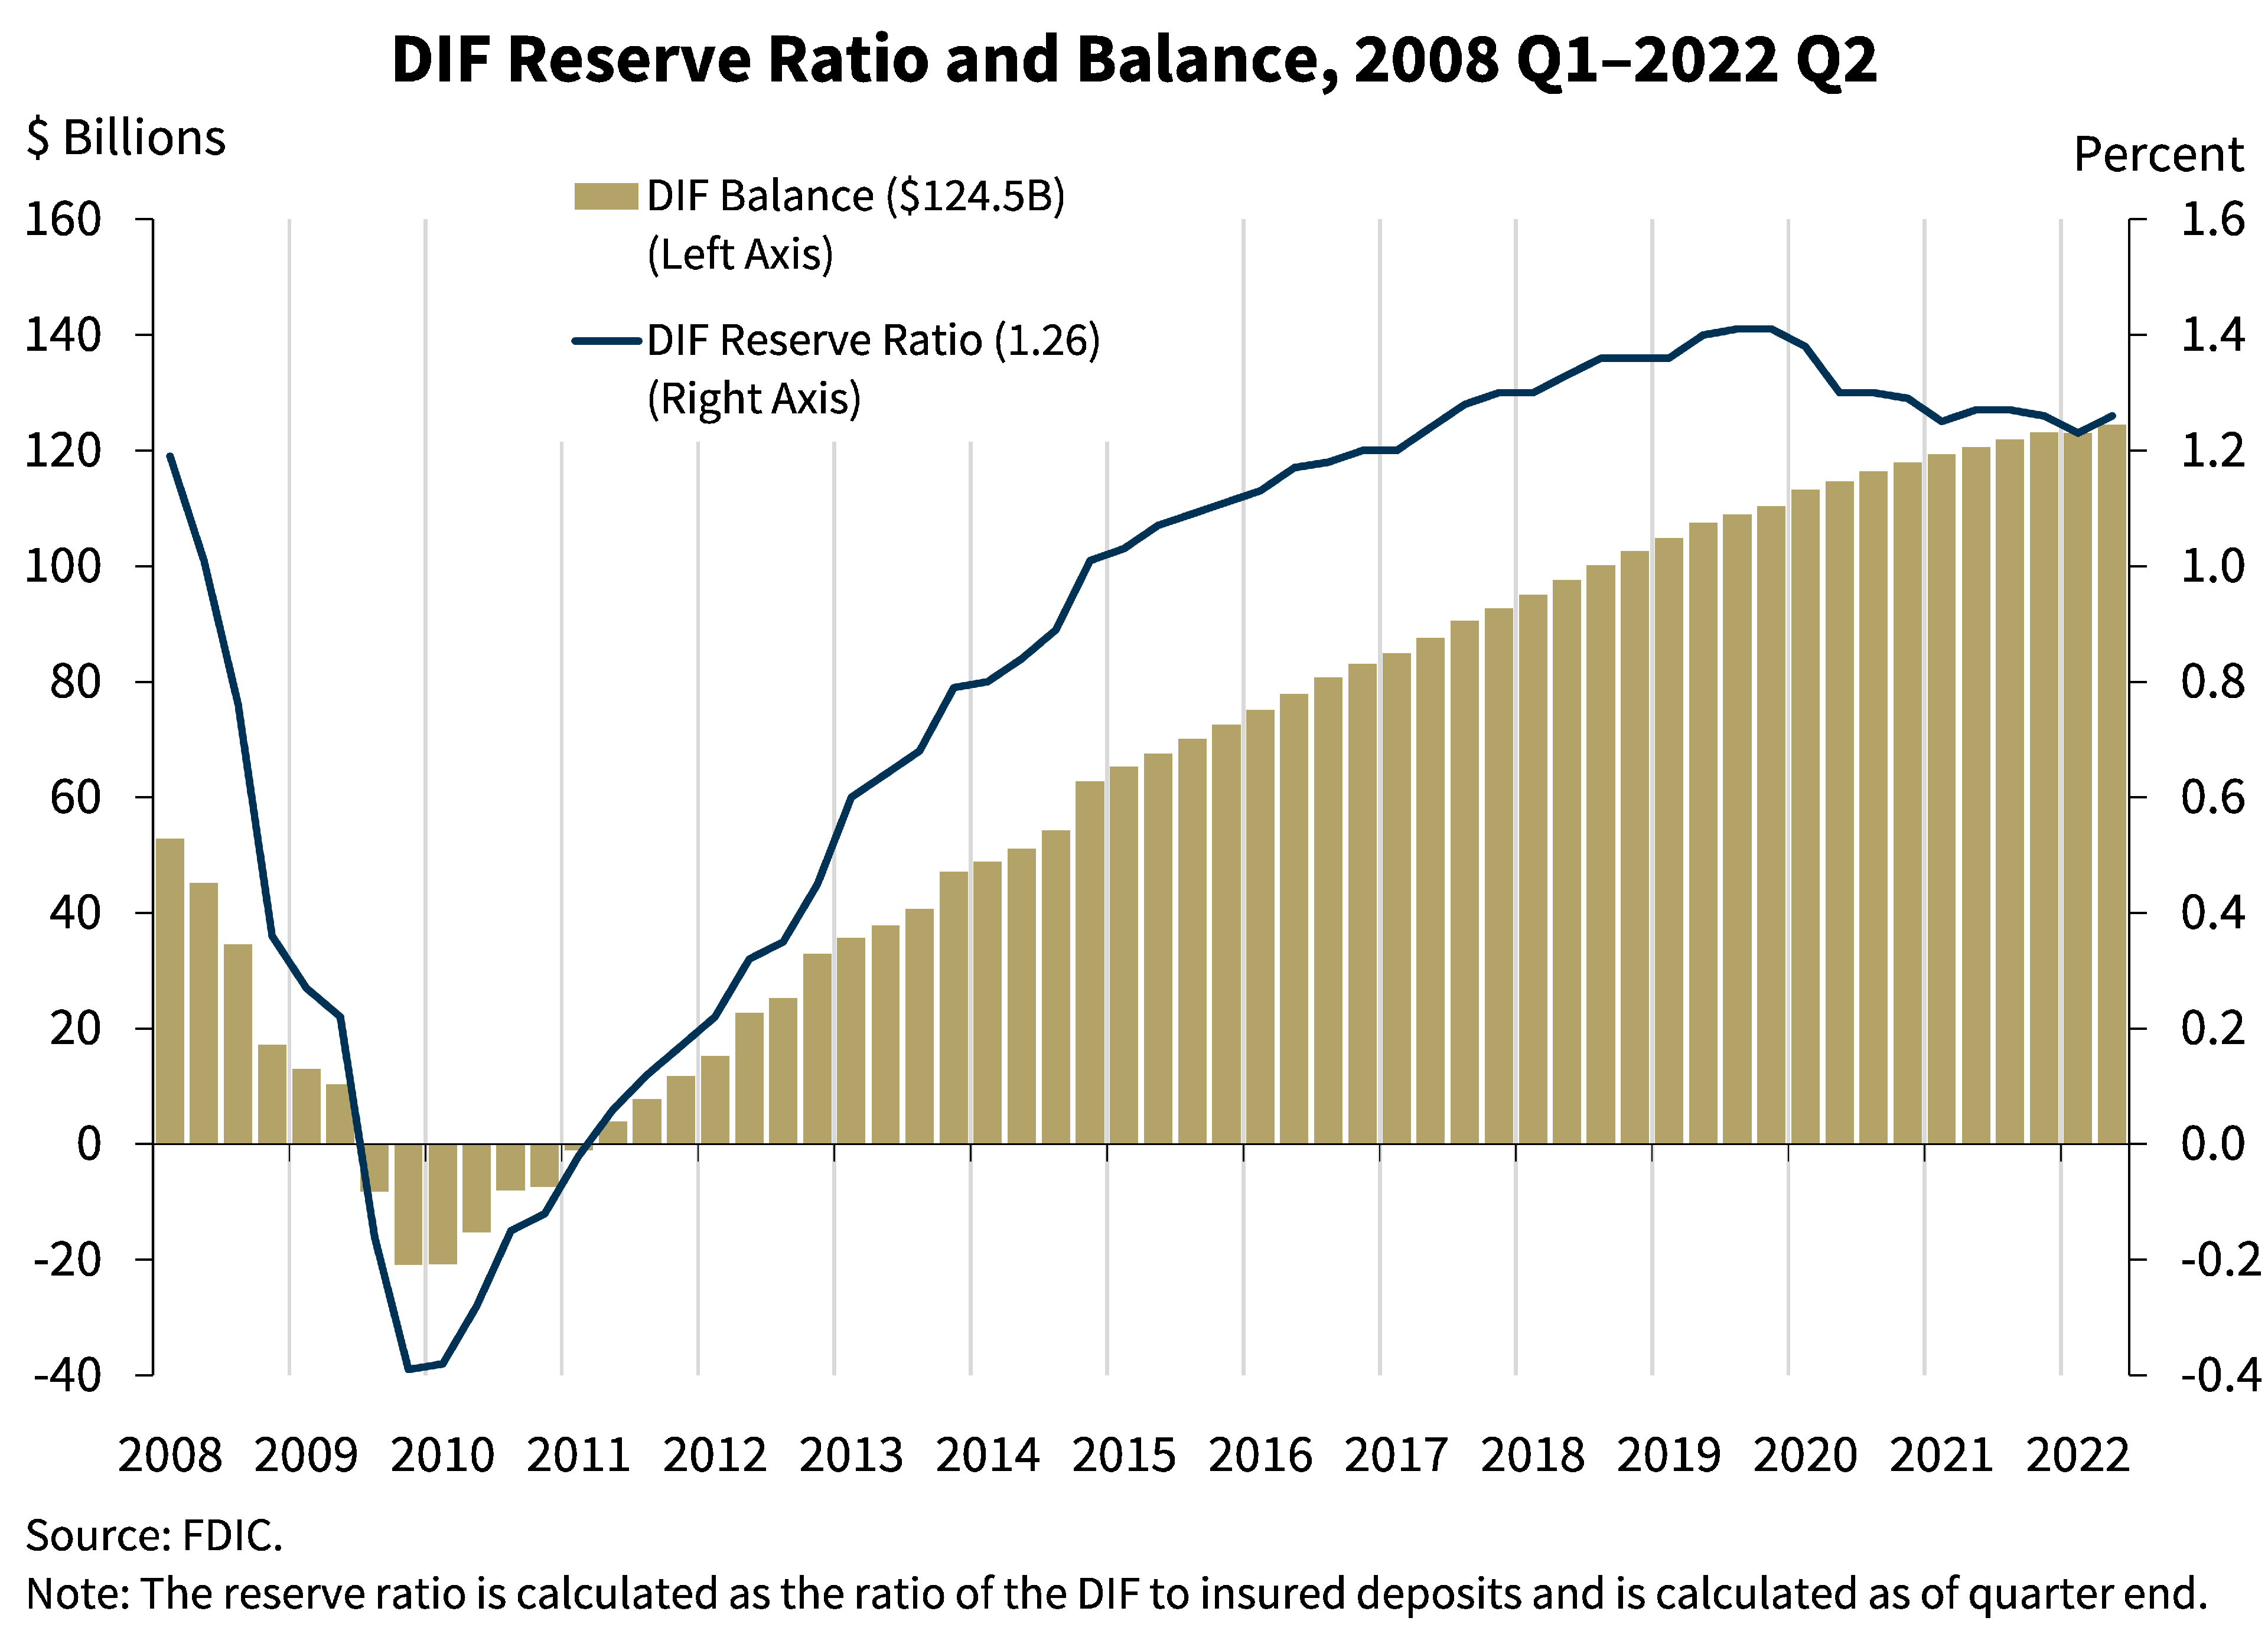
This chart shows that the DIF balance was $124.5 billion on June 30, up approximately $1.4 billion in the second quarter. Assessment revenue was the primary driver of the increase in the fund, offset partially by unrealized losses on available-for-sale securities in the DIF portfolio, driven by the rising rate environment. Insured deposits decreased by 0.7 percent during the second quarter. Typically, insured deposit growth in second quarter is flat to marginally negative. This year’s second quarter decline is largely consistent with that historical trend, although slightly more negative than the historical quarterly average. Year-over-year insured deposit growth remained strong at 4.3 percent. These factors caused the reserve ratio—the fund balance relative to insured deposits—to increase by 3 basis points to 1.26 percent as of June 30. This is 1 basis point lower than a year ago, when the reserve ratio was 1.27 percent.
The FDIC adopted a DIF Restoration Plan on September 15, 2020, that would return the reserve ratio to 1.35 percent, the statutory minimum, by September 2028 as required by law. During its most recent progress report to the Board, the FDIC projected that the reserve ratio is at risk of not reaching 1.35 percent by the statutory deadline. In June, the FDIC amended the Restoration Plan and approved a notice of proposed rulemaking to increase initial base deposit insurance assessment rates by 2 basis points, beginning in the first quarterly assessment period of 2023. As mentioned in the Notice of Proposed Rulemaking related to the Amended Restoration Plan, this would result in an estimated annual reduction in average industry income of less than 2 percent.
These actions were undertaken to improve the likelihood that the reserve ratio reaches the statutory minimum of 1.35 percent before the statutory deadline while reducing the potential for a pro-cyclical increase in assessment rates should the banking industry enter a period of stress in the interim. The FDIC continues to incorporate recent data into its projections of the reserve ratio. The intent of the proposed change in assessment rates is also to further support growth toward the FDIC’s long-term goal of a 2 percent reserve ratio, an important complementary objective. The comment period on the proposed rulemaking to increase assessment rates closed on August 20. We will carefully consider all comments received.
In conclusion, overall, key banking industry metrics remain favorable at this time. Loan growth strengthened, net interest income grew, and most asset quality measures improved, despite a rise in early delinquencies. Further, the industry remains well-capitalized and highly liquid.
However, the banking industry continues to face downside risks resulting from prevailing economic uncertainties, inflationary pressures, a rising interest rate environment, and geopolitical concerns. These factors could hamper bank profitability, weaken credit quality and capital, and limit loan growth. These risks will be matters of continued supervisory attention by the FDIC over the coming year.
Thank you.
I am happy to take your questions.