
Quarterly Banking Profile - First Quarter 2022
Good morning, and welcome to our release of first quarter 2022 performance results for FDIC-insured institutions.
In the first quarter, the banking industry reported a decline in quarterly net income from both the previous quarter and the year-ago quarter primarily due to an increase in provision expense, driven by the largest institutions. Provisions are set aside by institutions to protect against future loan losses. The increase in provision expense reflects, in part, a slow return to pre-pandemic levels, reflecting an increase in loan balances and evolving economic uncertainties. Though the increase in provision expense has reduced income, it has also increased protection against future losses.
Net income also declined from year-ago levels at community banks because of reduced revenue from loan sales and higher business expenses.
Overall, the banking industry continued to report broad-based increases in total loan balances, generally favorable credit quality metrics, and strong capital levels. These factors support the banking industry’s ability to meet the country’s banking needs while navigating the challenges presented by inflationary pressures, rising interest rates, and the end of pandemic support programs for borrowers.
The net interest margin stayed relatively stable and low, declining just one basis point from the prior quarter to 2.54 percent. Most banks continued to report increases in net interest income as result of loan growth, with more than half of insured banks reporting higher net interest income compared with a year ago.
The Deposit Insurance Fund balance was $123.0 billion on March 31, relatively flat from the end of the fourth quarter. The reserve ratio fell 4 basis points to 1.23 percent, as insured deposits grew 2.5 percent.
The banking industry continues to face several challenges, including lingering uncertainties related to the trajectory of the pandemic and any effects it may have on the longer-term health of the economy and banking industry. In addition, inflationary pressures, rising interest rates, and geopolitical uncertainty could hamper bank profitability, weaken credit quality, and reduce loan growth. Specifically, rising interest rates, which have already contributed to high levels of unrealized losses in the banking industry’s securities portfolios, could also lower real estate and other asset values and limit loan repayment ability. These will be matters of ongoing supervisory attention by the FDIC over the coming year.
Chart 1:
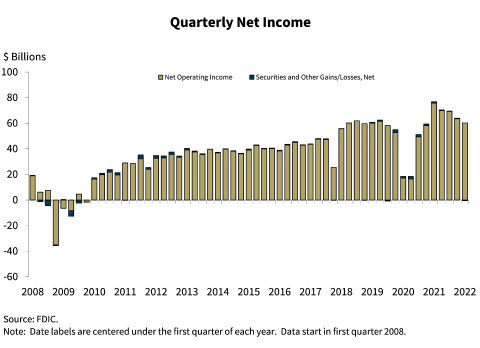
As shown in this chart, the banking industry reported net income of $59.7 billion this quarter, down $17.0 billion from first quarter last year. Most banks reported lower net income this quarter relative to a year ago. The industry reported an aggregate return on assets ratio of 1.00 percent, down from 1.38 percent in first quarter 2021.
For the first time in a year, provision expense for the banking industry was positive and totaled $5.2 billion in first quarter. While provision expense increased in aggregate for the banking industry, it remains lower than pre-pandemic levels. The increase in provision expense was driven by banks with more than $10 billion in total assets.
Compared with the industry, community banks reported a lower rate of decline in net income. Community banks’ net income was down $1.1 billion or 14.0 percent from the same quarter a year ago. A reduction in income from loan sales and increased business expenses drove this decline.
Chart 2:
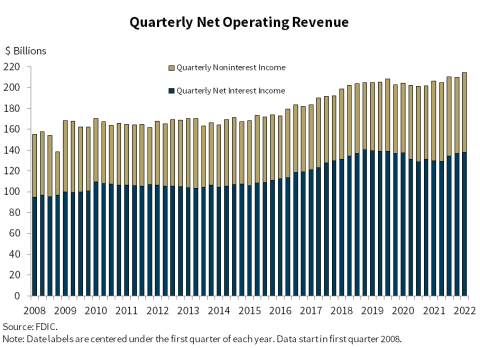
Our next chart shows that quarterly net operating revenue increased 3.9 percent from first quarter 2021 to $214.7 billion.
Net interest income continued to trend upward for the fourth consecutive quarter. More than half of all banks reported higher net interest income compared with a year ago.
Noninterest income declined slightly, by $170.2 million, from a year ago primarily due to a decline in income from loan sales.
Chart 3:
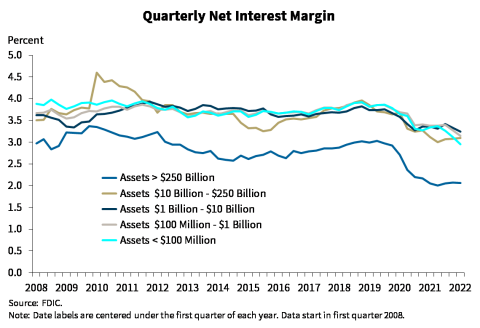
The next chart shows net interest margin for the five asset size groups on which the QBP reports. Net interest margin for the industry as a whole stayed relatively stable, declining 1 basis point from the prior quarter and 2 basis points from the year-ago quarter to 2.54 percent. Net interest margin was also relatively stable from fourth quarter for the largest banks, increased slightly for banks with assets between $10 billion and $250 billion, and decreased for the three smallest size groups. Net interest margins for banks in the three smallest asset size groups declined as income earned through forgiveness of Paycheck Protection Program loans has declined in recent quarters.
The net interest margin for community banks narrowed 15 basis points from the year-ago quarter to 3.11 percent.
Chart 4:
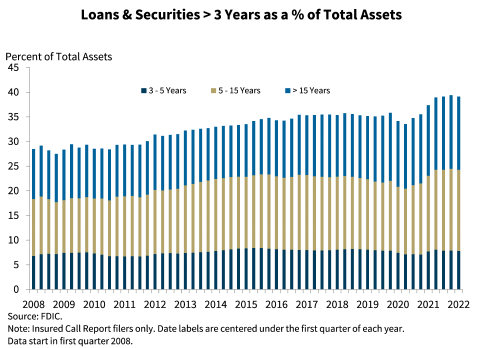
The next chart shows that banks’ holdings of longer-term loans and securities remained elevated at 39.1 percent of total assets. Although this higher level of longer-term loans and securities helped offset low net interest margins, it also makes banks more vulnerable to rising interest rates.
Community banks also maintained a consistent, but higher, proportion of assets with maturities greater than three years to total assets at just over 52 percent.
Chart 5:
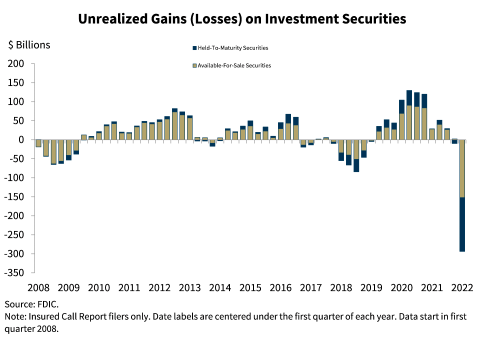
This chart shows the unprecedented growth in unrealized losses on investment securities this quarter. The large amount of unrealized losses is a result of the combined effect of the increase in investment securities holdings that offset lower loan growth levels in recent years and an increase in market interest rates. Although the banking industry currently reports high liquid asset levels, the elevated levels of unrealized losses increase the risk of actual losses should banks sell investments at a loss to meet liquidity needs in the future.
Chart 6:
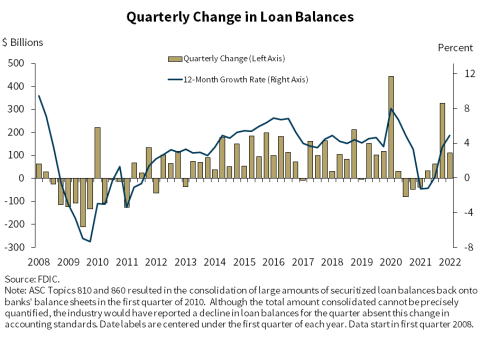
This chart shows that total loan balances continued to grow for a fourth consecutive quarter despite continued payoff and forgiveness of Paycheck Protection Program loans. Total loan balances grew $109.9 billion, or 1.0 percent, between fourth quarter 2021 and first quarter 2022. The banking industry reported growth in several portfolios this quarter, including commercial and industrial loans, nonfarm nonresidential commercial real estate loans, and “all other consumer loans,” which includes auto loans and unsecured personal loans.
Community banks reported a 1.3 percent increase in loan balances from the previous quarter and a 2.1 percent increase from the prior year driven by growth in commercial real estate loans.
Excluding PPP loans, total loan growth rates for both the industry and community banks would have exceeded pre-pandemic average growth rates. The annual loan growth rate would have been 9.2 percent for the industry and 10.2 percent for community banks.
Chart 7:
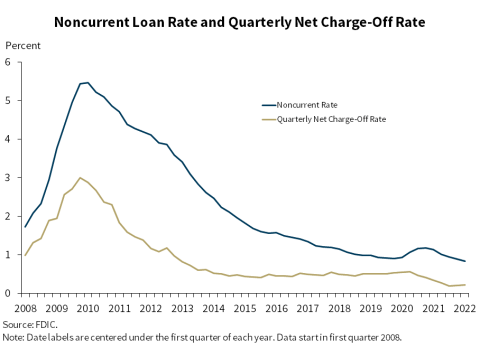
Our next chart shows that asset quality ratios for the industry remain favorable. The noncurrent and net charge-off rates are only slightly above historical lows. The noncurrent rate declined 5 basis points from fourth quarter driven by reductions in noncurrent 1 to 4 family residential real estate and nonfarm nonresidential commercial real estate loan balances. Annual reductions in credit card and commercial and industrial loan net charge-offs helped reduce the industry’s net charge-off rate by 12 basis points from one year ago to 0.22 percent.
Community banks also reported improvements in credit quality metrics with record lows in both the noncurrent rate and net charge-off rate. The community bank noncurrent rate declined 4 basis points from the previous quarter to 0.54 percent. The community bank net charge-off rate fell 2 basis points to 0.03 percent from the year-ago quarter.
Chart 8:
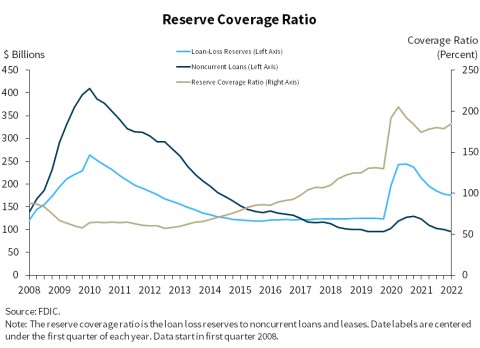
Our next chart shows that the decline in noncurrent loans exceeded the decline in loan loss reserves in the first quarter. As a result, the ratio of the allowance for loan and lease losses to noncurrent loans increased from 178.7 percent to 184.3 percent in first quarter.
Chart 9:
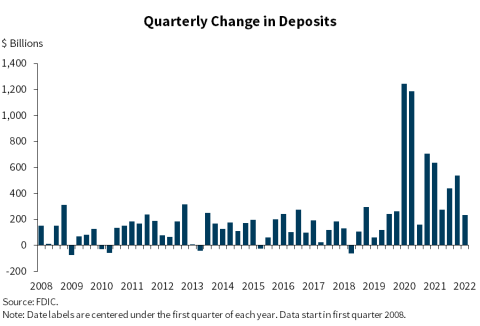
This chart shows that deposits continued to increase in first quarter 2022, driven by growth in insured deposits. Uninsured deposits actually declined modestly. Deposits totaled $230.7 billion, up 1.2 percent from the level reported last quarter. Deposits remain elevated compared with historical levels; however, growth rates remain well below the unprecedented levels reported in 2020 and first quarter 2021.
Chart 10:
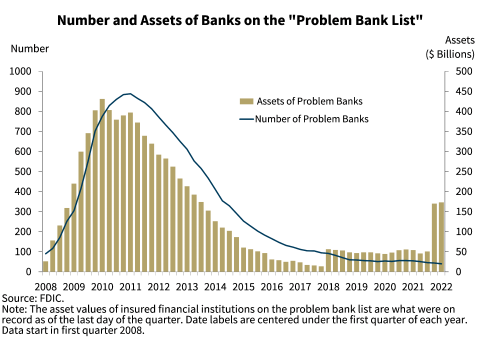
This chart shows the number and total assets of banks on the Problem Bank list. The number of banks on the list declined by 4 to 40 banks, and total assets held by problem banks increased by $3.0 billion to $173.1 billion in first quarter. The number of problem banks is at the lowest level since QBP data collection began in 1984. No failures occurred in the first quarter.
Chart 11:
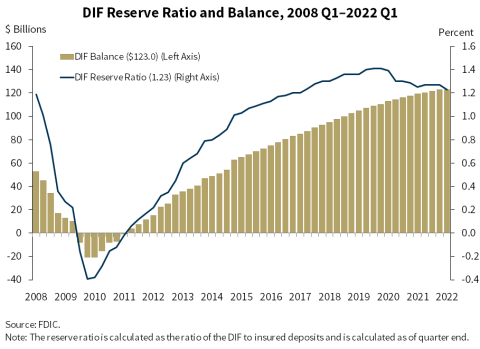
This chart shows that the DIF balance was $123.0 billion on March 31, down approximately $100 million from the end of the fourth quarter. This was the first decline in the DIF balance in more than a decade. Unrealized losses on available-for-sale securities in the DIF portfolio, driven by the rising rate environment, largely offset insurance assessment income. Insured deposits increased 2.5 percent in the first quarter to $10 trillion. These factors caused the reserve ratio—the fund balance relative to insured deposits—to fall 4 basis points to 1.23 percent as of March 31. Even without the unrealized losses, the reserve ratio would have experienced a decline of 2 basis points due to strong insured deposit growth. Prior to the surge of deposits related to the pandemic, the reserve ratio had not declined in any quarter since 2009.
Chart 12:
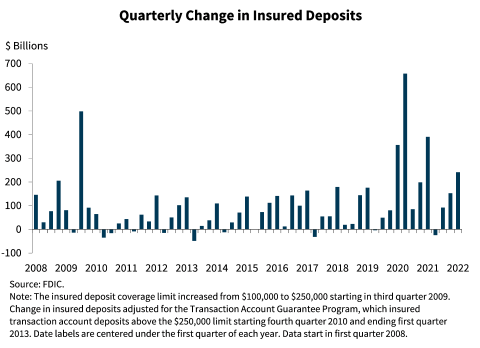
The FDIC adopted a restoration plan on September 15, 2020, that would return the reserve ratio to 1.35 percent, the statutory minimum, by September 2028 as required by law. A key assumption surrounding the restoration plan was that insured deposit growth would normalize and the surge of insured deposits associated with the pandemic would recede over time. However, more than one year after the most recent round of pandemic-related fiscal stimulus, the industry has continued to report strong insured deposit growth, as shown in this chart. In fact, excluding quarters affected by the increase in insured deposit limits in 2009 and the early pandemic, insured deposits increased in the first quarter by the largest amount in at least 30 years. The FDIC is closely monitoring the factors that affect the reserve ratio and will provide its next progress report to the Board in June. Given continued significant growth in insured deposits, the Board will likely consider options to amend the restoration plan, including increases to assessment rates, to meet the statutory requirement by September 2028.
Overall, the banking industry remains strong at this time. The net income decline reflects higher provision expenses relative to the level reported last year in anticipation of potential future risks. But capital and liquidity remained strong. In addition, loan growth and credit quality metrics remain generally favorable.
At the same time, the banking industry faces significant uncertainty going forward resulting from lingering sensitivities related to the pandemic, inflationary pressures, a rising interest rate environment, and geopolitical developments. These factors could impact bank profitability, credit quality, and loan growth and will be matters of ongoing supervisory attention by the FDIC over the coming year.
Thank you.
I am happy to take your questions.