
Quarterly Banking Profile - Fourth Quarter 2021
Good morning, and welcome to our release of full-year and fourth quarter 2021 performance results for FDIC-insured institutions.
The banking industry reported an increase in full year 2021 income primarily due to negative provision expense in all four quarters of the year. Fourth quarter income improved from a year ago due to higher net interest income and continued negative provisions. The net interest margin for the industry remained stable from the prior quarter but declined 12 basis points from the year-ago quarter. Furthermore, the banking industry reported broad-based increases in total loan balances, improved credit quality, and strong capital levels.
Community banks’ annual and quarterly net income grew from the year-ago levels. Community banks also reported increased net interest income, higher loan growth, and improved asset quality compared to the same quarter one year ago.
With strong capital and liquidity levels to support lending and protect against potential losses, the banking industry continued to support the country’s credit needs while navigating the challenges presented by the pandemic.
The Deposit Insurance Fund (DIF) balance was $123.1 billion on December 31, up $1.2 billion from the end of the third quarter. However, the reserve ratio was unchanged at 1.27 percent as growth in insured deposits remained strong this quarter.
Despite the positive trends, several challenges persist for the banking industry. The trajectory of the pandemic and its longer-term economic and banking industry effects remain uncertain. In addition, rising interest rates and geopolitical uncertainty could negatively affect bank profitability, credit quality, and loan growth going forward. In particular, rising interest rates could adversely impact real estate and other asset values and borrowers’ repayment abilities. These will be matters of ongoing supervisory attention by the FDIC over the coming year.
Chart 1:
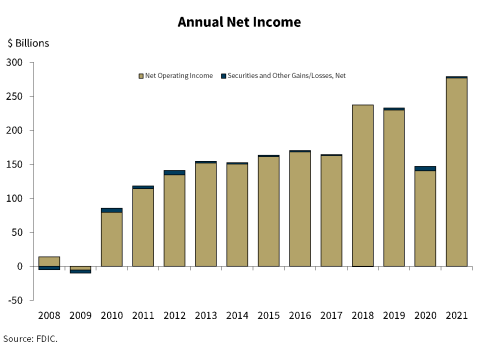
Our first chart shows that full-year 2021 net income rose $132.0 billion, or 89.7 percent, to $279.1 billion from 2020. The improvement was primarily attributable to a negative provision expense in 2021 of $31.0 billion, compared to a positive provision expense of $132.3 billion in 2020. A negative provision reduces the allowance held by banks for estimated credit losses. The negative provision expense reflects continued economic growth and further improvements in credit quality. While provisions typically reduce income, negative provisions add to income. The average return-on-assets ratio (ROA) increased from 0.72 percent in 2020 to 1.23 percent in 2021.
Community banks reported annual net income of $32.7 billion in 2021, up 29.3 percent from 2020. The improvement was attributable to higher net interest income, which increased by $6.8 billion, and lower provisions, which were down $6.0 billion.
Chart 2:
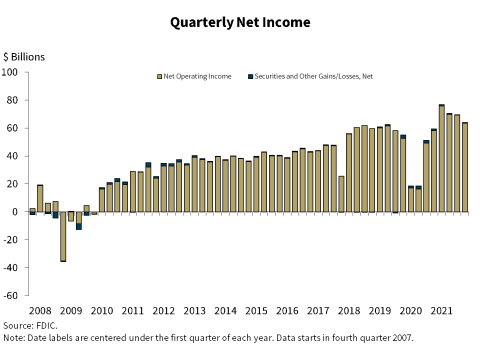
As seen in this chart, the banking industry reported net income of $63.9 billion this quarter, up $4.4 billion from fourth quarter last year. A majority of banks reported higher net income this quarter relative to a year ago. The industry aggregate return on assets ratio was 1.09 percent, on par with the rate of 1.10 percent reported in fourth quarter 2020.
The primary driver of higher net income this quarter was an increase in net interest income. Interest expense declined $3.8 billion and interest income increased $2.0 billion from one year ago, particularly from growth in securities portfolios. Provision expense for the banking industry totaled negative $742.4 million in fourth quarter. This was $4.0 billion less than one year ago and also boosted net income.
Community banks reported net income of $7.8 billion, up 7.1 percent from the same quarter a year ago. Higher net interest income and lower provision expense also drove the improvement in net income for community banks.
Chart 3:
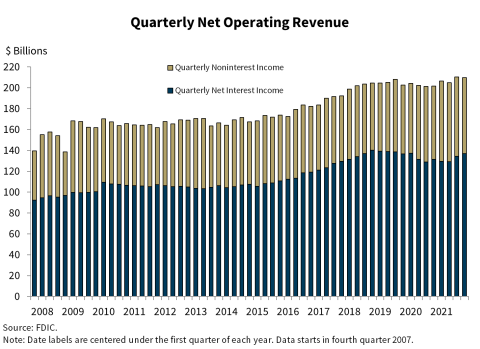
Our next chart shows that quarterly net operating revenue increased 4.0 percent from fourth quarter 2020 to $209.8 billion.
Net interest income reached its highest level since first quarter 2020. The improvement was broad-based, as nearly two-thirds of all banks reported higher net interest income compared with a year ago.
Noninterest income rose by $2.4 billion from a year ago. Higher revenue from investment banking fees and trading revenue drove the year-over-year increase.
Chart 4:
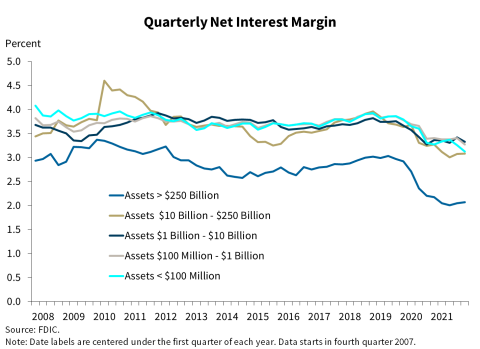
The next chart shows that the net interest margin (NIM) for the industry remained stable from the prior quarter at 2.56 percent. However, NIM is 12 basis points lower than the year ago level.
The NIM for community banks declined, narrowing 11 basis points from the same quarter a year ago to 3.22 percent.
Chart 5:
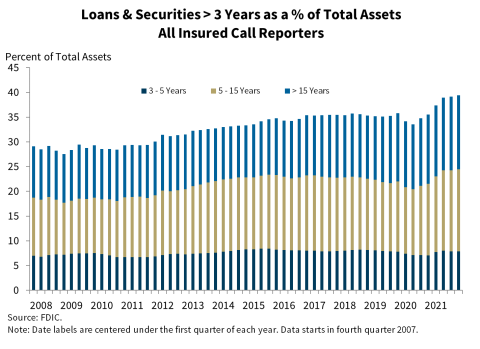
The next chart shows that banks continued to increase investments in longer-term loans and securities to offset low net interest margins. This shift makes banks more vulnerable to rising interest rates.
The share of longer-term assets held by the banking industry as a whole rose during the quarter, led by an increase in securities with maturities of greater than five years. Loans and securities with maturities over three years now make up 39.4 percent of total assets, up from 35.8 percent in fourth quarter 2019.
Community banks have also increased their holdings of assets with maturities greater than three years, which now total 52.2 percent of total assets.
Chart 6:
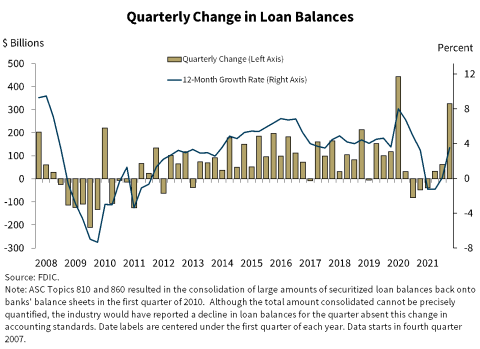
This chart shows that total loan balances grew for a third consecutive quarter despite continued payoff and forgiveness of Paycheck Protection Program (PPP) loans. Total loan balances grew by $326.0 billion, or 3.0 percent, between third and fourth quarter. Several portfolios contributed meaningfully to the industry’s growth, including commercial and industrial (C&I) loans, credit card loans, and loans to nondepository financial institutions.
Loan balances for community banks grew 1.4 percent from third quarter 2021 and 2.0 percent from the prior year. Excluding PPP loans, total loan growth for community banks would have been 3.1 percent quarter over quarter and 7.6 percent year over year—above growth rates experienced before the pandemic.
Chart 7:
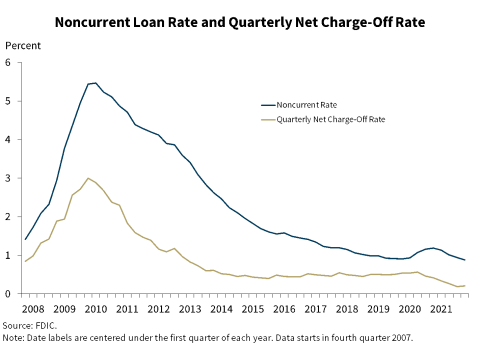
Our next chart shows that asset quality indicators remain favorable for the industry. Annual declines in both the noncurrent rate and the net charge-off rate reflect overall improvements in credit quality. The decline in the noncurrent rate was driven by reductions in noncurrent commercial real estate loan balances and noncurrent C&I loan balances. Annual reductions in C&I and credit card net charge-offs helped drive the industry’s net charge-off rate down 21 basis points from one year ago to 0.21 percent— just above last quarter’s record low.
Community banks also reported improvements in credit quality. The community bank noncurrent rate fell 7 basis points from the previous quarter to 0.58 percent, a record low. The net charge-off rate fell 6 basis points to 0.09 percent from the year-ago quarter.
Chart 8:
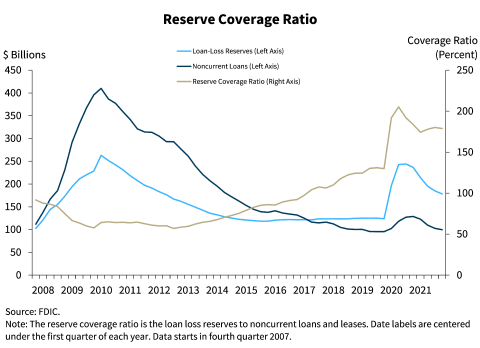
Our next chart shows that the rate of decline in loan loss reserves outpaced the decline in noncurrent loans in the fourth quarter. The decline in the loan loss reserve reflects the four quarters of negative provisions. As a result, the reserve coverage ratio for noncurrent loans declined slightly from the previous quarter to 178.8 percent. Despite negative provisions, the coverage level remains well above the pre-pandemic level of 129.9 percent and the financial crisis average of 79.1 percent.
Chart 9:
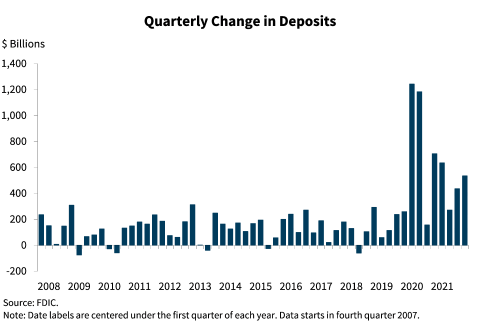
This chart shows that deposits continued to increase in fourth quarter 2021. Total deposits were $535.0 billion or 2.8 percent higher than last quarter. Deposit levels remain high from an historical perspective; however, growth rates are below the unprecedented levels reported in 2020 and first quarter 2021.
Chart 10:
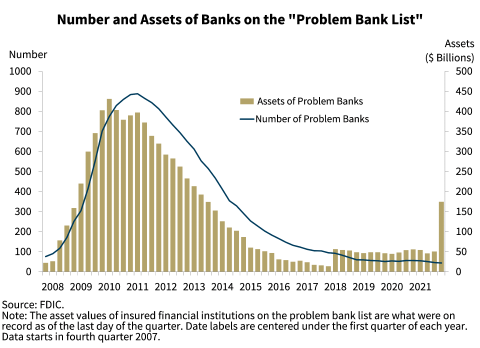
This chart shows the number of banks on the problem bank list declined by two from third quarter to 44 but problem bank assets increased from $50.6 billion to $170.2 billion. The number of problem banks is at the lowest level since QBP data began in 1984. No failures occurred in the fourth quarter.
Chart 11:
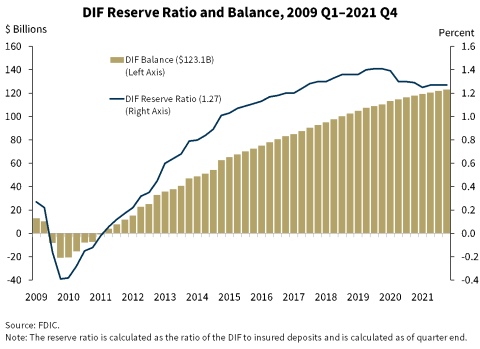
This chart shows the DIF balance was $123.1 billion on December 31, up $1.2 billion from the end of the third quarter. Assessment revenue was the primary driver of the increase in the fund. Insured deposits increased by 1.6 percent during the fourth quarter to $9.7 trillion. Due to continued strong growth in insured deposits, the reserve ratio—the fund balance relative to insured deposits—remained the same at 1.27 percent as of December 31.
The FDIC adopted a Restoration Plan on September 15, 2020 that would return the Reserve Ratio to 1.35 percent, the statutory minimum, by September 2028, as required by law. A key assumption surrounding the Restoration Plan was that insured deposits would normalize following the surge of insured deposits associated with the pandemic. However, despite zero bank failures in over a year, the Reserve Ratio has declined from 1.29 percent in the fourth quarter of 2020 to 1.27 percent in the most recent quarter. Insured deposits have remained persistently high with little sign of the pandemic-related surge deposits receding. In fact, the reserve ratio failed to increase this quarter as a result of the industry realizing continued strong insured deposit growth. The FDIC is closely monitoring the factors that affect the reserve ratio and will provide its next progress report to the Board in June. If necessary, the Board will consider whether changes to the Restoration Plan are needed, including adjustments to assessment rates, to meet the statutory requirement by September 2028.
Overall, the banking industry remains strong. Revenue has increased along with stronger economic growth, higher loan demand, and improved credit conditions. At the current time, the banking industry remains well positioned to support the country’s credit needs as the economy continues to recover from the pandemic, with record deposits, favorable credit quality, and strong capital levels.
As indicated at the outset, the banking industry may face challenges as businesses and consumers continue to transition out of the pandemic, interest rates rise, and geopolitical tensions persist. These will be matters of ongoing supervisory attention by the FDIC over the coming year.
Thank you.
I am happy to take your questions.