
Quarterly Banking Profile - Second Quarter 2021
Good morning, and welcome to our release of second quarter 2021 performance results for FDIC-insured institutions.
The banking industry reported strong earnings in second quarter 2021, supported by continued economic growth and further improvements in credit quality. A second consecutive quarter of negative provision expense drove an increase in earnings year over year, as banks continued to adjust expectations for potential credit losses. Notably, the banking industry reported a modest quarterly increase in total loan balances for the first time since second quarter 2020, reflecting an uptick in loan demand, while the net charge-off rate reached a record low. However, persistent low interest rates contributed to further contraction in the average net interest margin, which reached a new record low this quarter.
Community banks also reported strong revenue growth, improved asset quality, and continued net interest margin compression this quarter. Like the broader industry, community banks reported increased balances in several loan categories relative to first quarter, despite a decline in aggregate loan balances because of repayment and forgiveness of Paycheck Protection Program (PPP) loans.
With strong capital and liquidity levels to support lending and protect against potential losses, the banking industry continued to support the country’s needs for financial services while navigating the challenges presented by the pandemic.
The Deposit Insurance Fund (DIF) balance was $120.5 billion on June 30, up $1.2 billion from the end of the first quarter. The reserve ratio increased two basis points to 1.27 percent due to continued growth in the fund balance and a decline in insured deposits. In accordance with the Restoration Plan approved last year, FDIC staff continues to closely monitor the factors that affect the reserve ratio and will provide progress reports and, as necessary, modifications to the plan to the Board at least semiannually.
Diane Ellis, Director of the Division of Insurance and Research; Pat Mitchell, Deputy Director of the Division of Insurance and Research; and Doreen Eberley, Director of the Division of Risk Management Supervision, have joined me today to discuss bank performance in second quarter 2021.
Diane, I will turn this over to you. Thank you.
Chart 1:
Thank you, Chairman McWilliams.
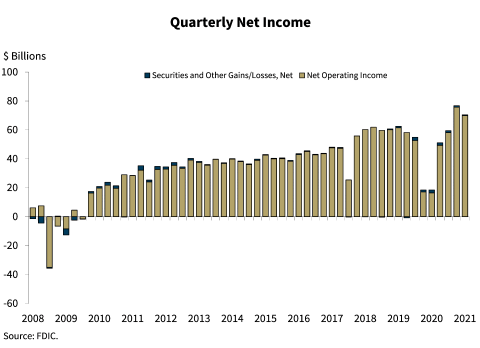
The banking industry reported net income of $70.4 billion this quarter, up $51.9 billion from second quarter last year. The gains were widespread as nearly two-thirds of all banks reported higher net income this quarter, relative to a year ago. Along with the increase in income, the industry’s return on average assets ratio rose from 0.36 percent in second quarter 2020 to 1.24 percent this quarter.
Provision expense for the banking industry totaled negative $10.8 billion. Aggregate provision expense has been negative for two consecutive quarters, but it did increase $3.7 billion between the first and second quarters of this year, and as a result industry net income declined from the prior quarter.
Community banks reported net income of $8.3 billion, up 29 percent from the same quarter a year ago. Lower provision expense and higher net interest income drove the improvement in net income for community banks.
Chart 2:
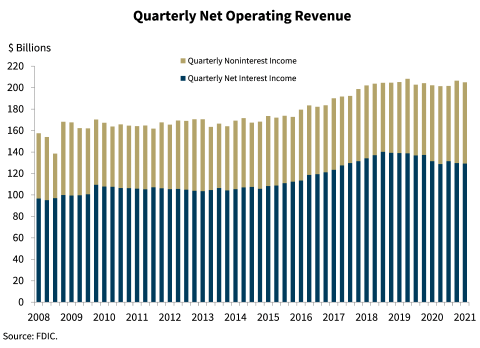
Quarterly net operating revenue increased 1.3 percent from second quarter 2020 to $205 billion. Net interest income continued to decline year over year, but noninterest income increased during the same period.
A decline in loans, along with continued low interest rates, contributed to the $2.2 billion decline in net interest income from second quarter 2020. The largest banks drove the aggregate decline in net interest income, as more than three-fifths of all banks continued to report higher net interest income compared with a year ago.
Noninterest income rose $5 billion from a year ago—with more than two-thirds of all banks reporting higher noninterest income compared with second quarter 2020. Higher revenue from interchange fees drove the year-over-year increase.
Chart 3:
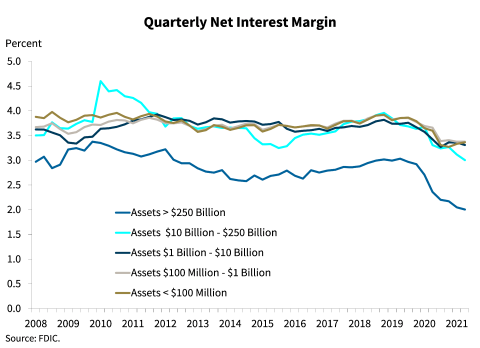
The industry reported further net interest margin (NIM) contraction in the second quarter. NIM declined 31 basis points from a year ago to 2.50 percent, a new record low. All asset size groups reported in the Quarterly Banking Profile ( QBP ) continued to report NIM compression compared to year ago levels, as declines in asset yields continued to exceed reductions in funding costs, both of which are at record lows.
The NIM for community banks also narrowed, declining 26 basis points from the same quarter a year ago to 3.25 percent.
Chart 4:
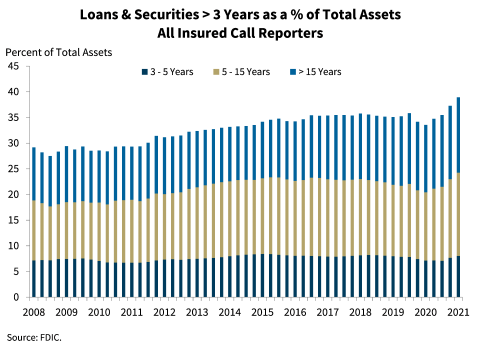
Banks have continued to increase investments in longer-term securities to limit net interest margin compression. The share of longer-term assets rose during the quarter, led by an increase in securities with maturities of greater than five years.
Chart 5:
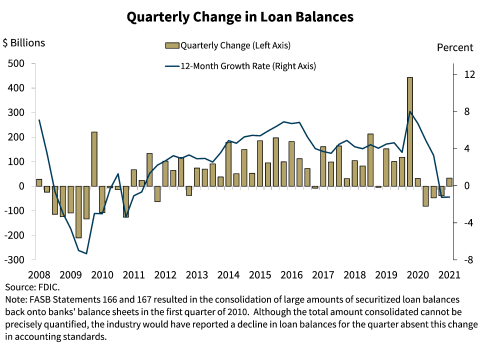
Total loan balances increased $33.2 billion, 0.3 percent, between first and second quarter. As the Chairman mentioned, this is the first quarterly increase in aggregate loan balances since second quarter 2020. Higher credit card loan balances (up 4.1 percent) and auto loan balances (up 3.6 percent) drove the trend.
However, the industry’s aggregate loan balance declined 1.2 percent from a year ago, driven by a reduction in C&I loans. Payoff and forgiveness of PPP loans contributed to this trend.
Unlike the industry as a whole, community banks reported a 0.5 percent decline in loan balances from first quarter 2021, led primarily by a reduction in PPP loans. Excluding PPP loans, total loan growth for community banks would have been 1.9 percent, consistent with growth rates experienced prior to the pandemic. Quarterly growth returned to long-term average rates for several portfolios including nonfarm nonresidential, construction and development, and farm loans. Community banks reported annual loan growth of $5.7 billion or 0.3 percent. Excluding PPP loans, the loan growth rate would have been 3.7 percent year over year.
Chart 6:
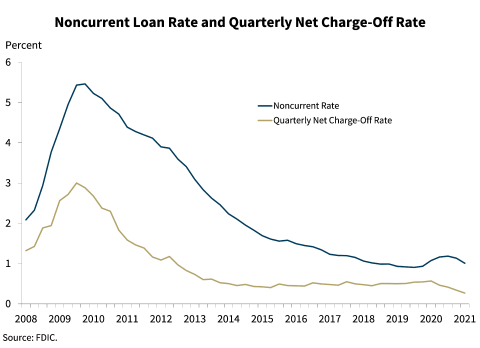
A decline in both the noncurrent rate and the net charge-off rate reflect overall improvements in credit quality. The noncurrent loan rate declined 7 basis points from second quarter 2020 to 1.01 percent, driven by reductions in noncurrent 1-4 family residential mortgage loans and C&I loans. Annual reductions in net charge-offs of credit card and C&I loans helped drive the net charge-off rate down 30 basis points from one year ago to 0.27 percent—the lowest level on record.
Community banks also reported improvements in credit quality. The noncurrent rate fell 12 basis points from a year ago to 0.68 percent and the net charge-off rate fell 8 basis points to 0.05 percent from the year ago quarter.
Chart 7:
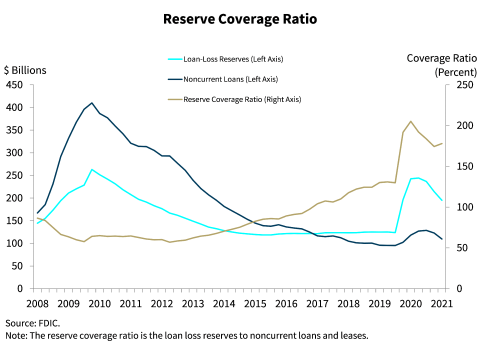
The rate of decline in noncurrent loans outpaced that of the decline in loan loss reserves in second quarter. As a result, the reserve coverage ratio for noncurrent loans increased 3.5 percentage points from the previous quarter to 178 percent—which remains well above both the pre-pandemic level of 130 percent and the financial crisis average of 79 percent.
Chart 8:
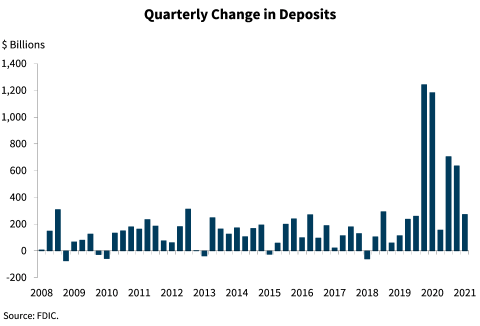
Deposits continued to increase, but the rate of growth moderated to near the long-term average. Total deposits increased by $272 billion, or 1.5 percent, in second quarter 2021. Deposits now total $18.7 trillion—the highest level on record. The banking industry’s cash position remains strong, supported by deposit growth.
Chart 9:
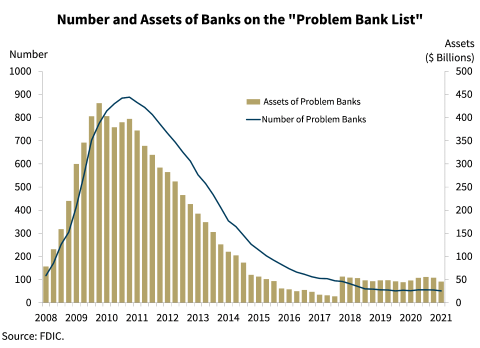
The “FDIC’s Problem Bank List” declined by four banks from first quarter to 51. The number of problem banks remains near historical lows.
Chart 10:
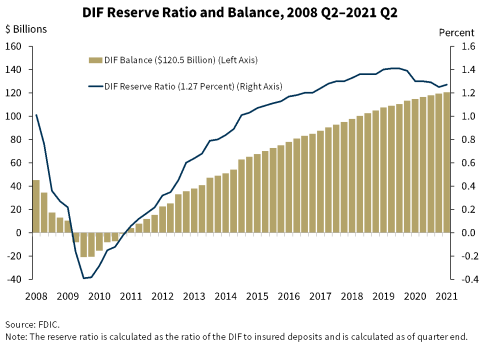
The DIF balance was $120.5 billion on June 30, up $1.2 billion from the end of the first quarter. Assessment revenue was the primary driver of the increase in the fund. As noted above, while total deposits increased, insured deposits declined by 0.2 percent during the second quarter and stood at $9.46 trillion on June 30.
This decline is consistent with recent historical trends, in which second quarter insured deposit growth is lower than other quarters due to seasonality.
The reserve ratio—the fund balance relative to insured deposits—increased two basis points and stood at 1.27 percent on June 30.
Overall, the banking industry remains strong. Revenue has increased along with stronger economic growth and improved credit conditions. The banking industry remains well positioned to support the country’s lending needs as the economy continues to recover from the pandemic, with record deposits, favorable credit quality, and strong capital levels.
However, low interest rates and modest loan demand will likely continue to present challenges for the banking industry in the near term. Further, the banking industry may face additional challenges as pandemic support programs for borrowers wind down and loan forbearance periods end.
We will now answer questions regarding second quarter performance.
Thank you.