
Quarterly Banking Profile - Fourth Quarter 2020
Good morning, and welcome to our release of full-year and fourth quarter 2020 performance results for FDIC-insured institutions.
While banking industry income for the full year 2020 declined from full year 2019 levels, banks remained resilient in fourth quarter 2020, consistent with the improving economic outlook. Fourth quarter net income rose, primarily due to lower provision expenses for credit losses and higher noninterest income. Net interest margin was unchanged from the record low level reached last quarter. Deposit growth accelerated in the fourth quarter, reflecting persistently high savings rates and lower spending. Banks reported modest declines in asset quality and loan volume.
Community banks reported growth in net income during the full year and the fourth quarter. Loan growth at community banks also outpaced the industry. However, community banks continued to report annual compression of net interest margins and asset quality weakness in certain portfolios.
The low interest rate environment coupled with economic uncertainties will continue to challenge the banking industry, placing downward pressure on revenue and the net interest margin. However, the banking industry maintains strong capital and liquidity levels, which can mitigate potential future losses.
The Deposit Insurance Fund (DIF) balance was $117.9 billion on December 31, up $1.5 billion from the end of the third quarter. However, the reserve ratio declined one basis point to 1.29 percent, solely because of strong estimated insured deposit growth. In accordance with the Restoration Plan, FDIC staff continues to closely monitor the factors that affect the reserve ratio and will provide progress reports and, as necessary, modifications to the plan to the Board at least semiannually.
I am joined today by Diane Ellis, Director of the Division of Insurance and Research; Pat Mitchell, Deputy Director of the Division of Insurance and Research; and Doreen Eberley, Director of the Division of Risk Management Supervision, to discuss bank performance during full-year and fourth quarter 2020.
Diane, I will turn this over to you. Thank you.
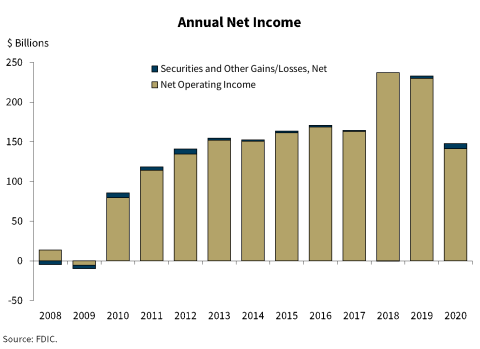
Chart 1:
Thank you, Chairman McWilliams.
Our first chart shows that full-year 2020 net income fell to $147.9 billion, down 36.5 percent from 2019. The decline was primarily attributable to higher provision expenses in the first half of 2020, related to the decline in economic conditions. The average return-on-assets ratio (ROA) declined from 1.29 percent in 2019 to 0.72 percent in 2020.
Community banks reported annual net income of $25.9 billion in 2020, up 3.6 percent from 2019. The improvement was attributable to higher noninterest income, which increased by $6.1 billion, and net interest income which rose by $3.6 billion.
Chart 2:
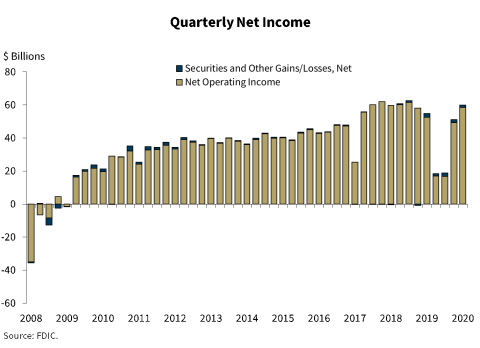
Chart 2 shows that the banking industry reported quarterly net income of $59.9 billion during the fourth quarter, a 9.1 percent increase from a year ago. This marks an improvement from the first three quarters in 2020, where net income declined on an annual basis. More than half of all banks (57.4 percent) reported improvements in quarterly net income from a year ago. The industry’s ROA ratio was 1.11 percent during the fourth quarter, up from 0.97 percent in the third quarter, but below a recent high of 1.41 percent in third quarter 2018.
With the improving economic outlook, provision expenses for the banking industry declined $11.4 billion (76.5 percent) from a year ago, reaching the lowest level since second quarter 1995. The reduction in provision expenses drove the improvement in quarterly net income.
Community banks reported quarterly net income of $7.4 billion dollars in the fourth quarter, an increase of 21.2 percent from a year ago. Improvement in net income was led by higher net interest income and gains from loan sales.
Chart 3:
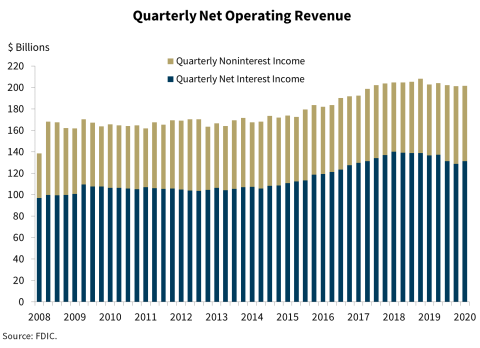
Chart 3 shows a modest decline in net operating revenue to $201.7 billion compared with a year ago. While aggregate net interest income increased from third quarter 2020, it declined relative to a year ago for the fifth consecutive quarter. The decline was primarily focused in the largest banks. More than half of all banks (57 percent) reported higher net interest income compared to a year ago.
Noninterest income rose $4.3 billion (6.5 percent) from a year ago—driven by higher revenue from loan sales and sales of other assets.
Chart 4:

Chart 4 shows a 60 basis-point reduction in the industry’s net interest margin (NIM) from a year ago to 2.68 percent. NIM remains unchanged from the previous quarter. Banks of all QBP asset size groups reported continued average net interest margin compression compared to year ago levels, as reductions in earning asset yields outpaced the reduction in funding costs. Earning asset yield and funding cost levels are both at record lows.
Chart 5:
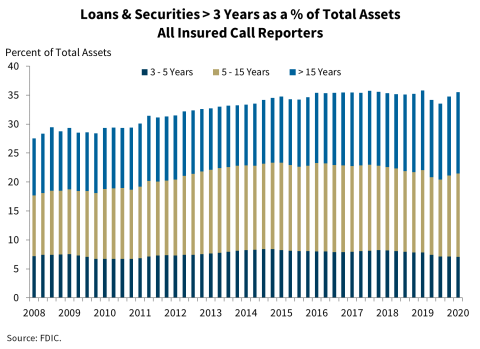
Chart 5 shows that the share of longer-term assets as a percentage of total industry assets increased during the quarter, with more than one-third of industry assets set to reprice or mature in three or more years. The industry continues to navigate the challenges presented by the low interest rate environment. Banks added longer-term assets to their balance sheets, which may help preserve or bolster net interest margins.
Chart 6:
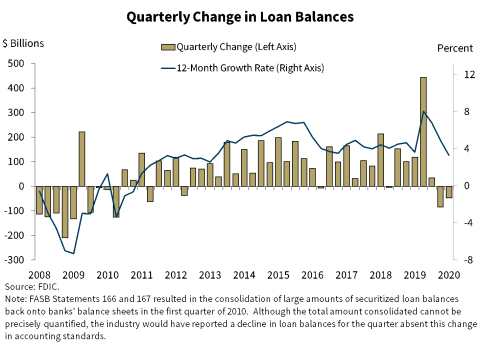
Chart 6 shows a decline of $48 billion (0.4 percent) in loan balances in fourth quarter. The decline was driven by a reduction in commercial and industrial (C&I) lending, which fell by $104 billion (4.1 percent) from the previous quarter. Small Business Administration-guaranteed Paycheck Protection Program loans declined $84 billion (17.1 percent) from the previous quarter to $407 billion. On an annual basis, loan balances increased 3.3 percent. This was lowest growth rate since fourth quarter 2013.
Community banks had similar trends as the industry with loan growth contracting quarterly but expanding annually. Loan balances declined 1.6 percent between third and fourth quarter 2020, led by a reduction in C&I lending but grew 10.3 percent annually due to community banks’ participation in the Paycheck Protection Program.
Chart 7:
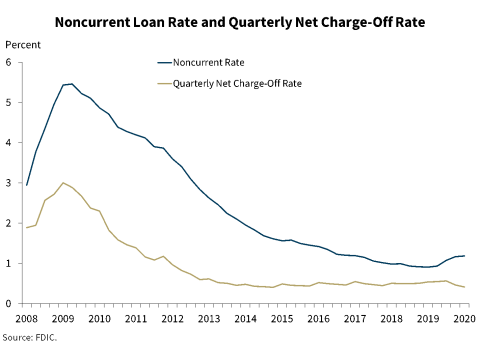
Chart 7 shows slight deterioration in the noncurrent rate in the fourth quarter, but a modest improvement in the net charge-off rate. The noncurrent loan rate increased 1 basis point from the previous quarter to 1.18 percent, driven by an increase in delinquent nonfarm nonresidential loans. The net charge-off rate declined 13 basis points to 0.41 percent from one year ago, driven by a reduction in credit card loan charge offs.
Community banks reported a modest decrease in the noncurrent loan volume, but the noncurrent rate remained flat at 0.77 percent. Similar to the industry as a whole, noncurrent existing CRE and multifamily loans at community banks increased. However, community banks reported improved credit quality in the agriculture sector. The noncurrent rate for loans secured by farmland declined 7 basis points year-over-year to 1.41 percent. The noncurrent rate for agricultural production loans declined 19 basis points to 0.90 percent.
Chart 8:
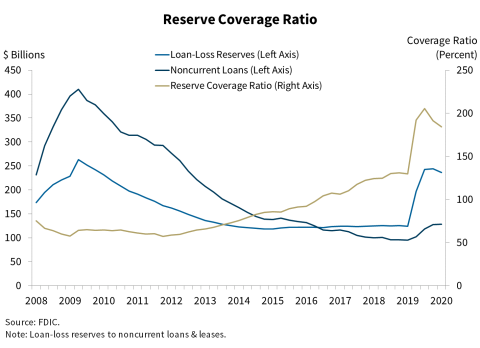
Chart 8 shows that the industry’s reserve coverage ratio, which compares the amount of loan-loss reserves to the amount of noncurrent loans, slightly declined from the previous quarter to 184 percent. An increase in noncurrent loans, coupled with a reduction in provision expenses during the quarter, drove the decline in the coverage ratio. Despite the decline, the coverage ratio remains well above historical levels.
Chart 9:
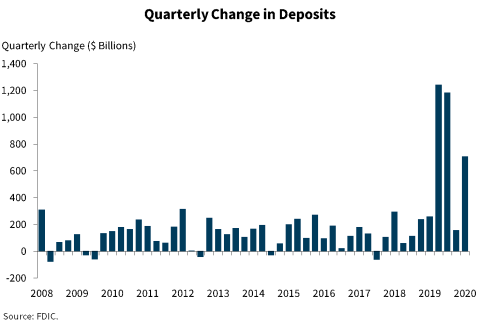
Chart 9 shows that deposits increased in the fourth quarter, rising $707 billion (4.1 percent) from third quarter. While the increase in deposits for the fourth quarter is below the quarterly increases reported during the first half of 2020, it is the third largest quarterly increase ever reported in the Quarterly Banking Profile.
With the growth in deposits, the banking industry’s liquidity position continued to strengthen. Cash and due from balances increased $357 billion (12.6 percent) from the previous quarter. Total securities increased $321 billion (6.7 percent), a record high quarterly dollar increase.
Chart 10:
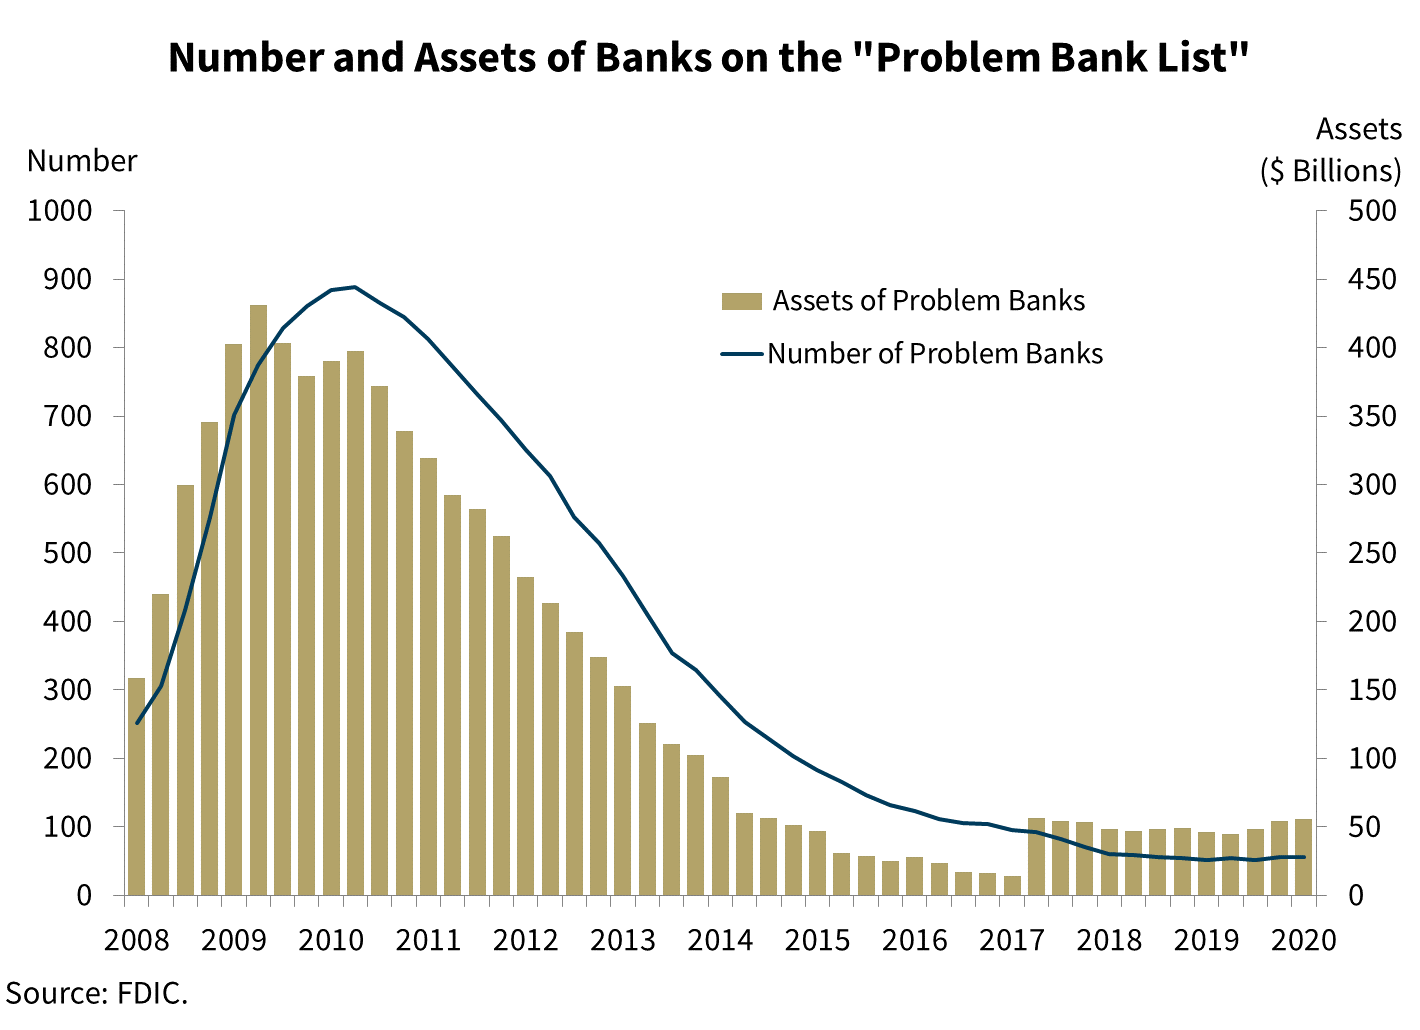
Chart 10 shows the number of banks on the FDIC’s “Problem Bank List” remained unchanged from the previous quarter at 56. The number of problem banks remains near historical lows.
Chart 11:
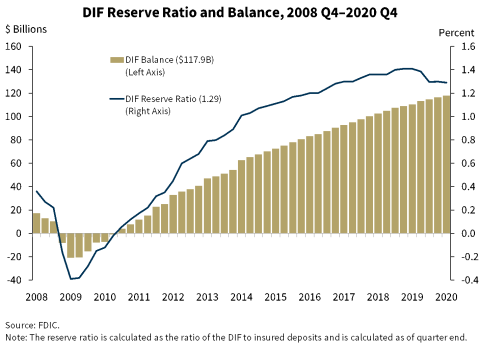
The DIF balance was $117.9 billion on December 31, up $1.5 billion from the end of the third quarter. Assessment revenue was the primary driver of the increase in the fund. Interest earned on investment securities held by the DIF also increased the fund balance. However, unrealized losses on available-for-sale securities held by the DIF offset the effect of interest income.
Estimated insured deposits grew by a robust 2.2 percent during the fourth quarter and stood at $9.1 trillion on December 31. Although this growth is below the record increases experienced during the first and second quarters of 2020, the growth rate was the highest fourth quarter growth rate since 2008, excluding quarters when the Dodd-Frank Act TAG program was in effect.
Therefore, the reserve ratio—the amount in the DIF relative to insured deposits—declined by one basis point and stood at 1.29 percent on December 31, as can be seen in Chart 11.
As mentioned earlier, because the reserve ratio fell below its statutorily required minimum of 1.35 percent as of June 30 of last year, the FDIC Board adopted a Fund Restoration Plan in September of last year. The reduction in the reserve ratio was solely a result of the strong growth in insured deposits.
Despite significant headwinds and uncertainty in the economy, the banking industry remains strong in fourth quarter 2020. Quarterly net income improved as provision expenses declined and noninterest income increased. The banking industry reported accelerated growth in deposits in the fourth quarter. Asset quality remains stable and capital levels are strong. However, the low interest rate environment coupled with weak loan growth and the potential for continued credit quality deterioration continue to challenge the industry.
We will now answer questions regarding full-year and fourth quarter performance of the banking industry.
Thank you.