
Quarterly Banking Profile - First Quarter 2020
Good morning, and welcome to our release of first quarter 2020 performance results for FDIC-insured institutions. Today, we also commemorate the 87 th anniversary of the FDIC and our proud history of maintaining stability and public confidence in the nation's financial system.
The FDIC was born out of a crisis, and we now find ourselves in the midst of another unprecedented period. During the last month of the first quarter, the COVID-19 pandemic led governments across the world to take emergency actions, including widespread stay-at-home orders that temporarily shut down large portions of the global economy. The attendant economic downturn, illustrated by the 5 percent decrease in U.S. GDP during the first quarter, adversely affected several industry sectors and financial markets. In spite of these anomalous shocks, the banking industry has proven to be a source of strength for the economy. Although bank earnings were negatively affected by increases in loan loss provisions, banks effectively supported individuals and businesses during this downturn through lending and other critical financial services. Loans and deposit inflows increased dramatically, reflecting drawdowns on corporate lines of credits and the flight to liquid assets during the market volatility. Notwithstanding these disruptions, at the end of the first quarter, bank capital and liquidity levels remain strong, asset quality metrics are stable, and the number of “problem banks” remains near historic lows.
Like the industry as a whole, community banks also reported lower profits than a year ago, primarily as a result of higher provision expenses. However, community banks’ net operating revenue increased, annual loan growth rate was strong, and asset quality metrics remained stable.
With the Federal Reserve cutting the Fed Funds rate to near zero in March, the low interest rate environment combined with the economic downturn will present challenges to the industry over the near to mid-term.
I am joined today by Diane Ellis, Director of the Division of Insurance and Research; Pat Mitchell, Deputy Director of the Division of Insurance and Research; and Doreen Eberley, Director of the Division of Risk Management Supervision, to discuss bank performance during first quarter 2020.
Diane, I will turn this over to you. Thank you.
Chart 1:
Thank you, Chairman McWilliams.
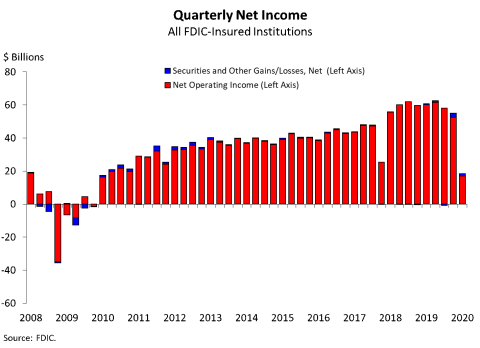
Our first chart shows that the banking industry reported quarterly net income of 18.5 billion dollars during the first quarter, a 69.6 percent decline from a year ago. Slightly more than one-half of all banks reported annual declines in net income and 7.3 percent of institutions were unprofitable. The industry’s return-on-assets ratio was 0.38 percent in the first quarter, down from 1.35 percent a year ago.
The decline in earnings reflects the industry’s expectation of deterioration in the overall economy. Provision expenses increased by 38.8 billion dollars, or 279.9 percent as a result of the economic decline. The adoption this quarter of the current expected credit loss (CECL) methodology by certain banks contributed partially to the overall increase in provisions relative to last quarter. CECL requires banks to provide for expected losses over the life of the loan. Sizable goodwill impairment charges also were reported by a few institutions, which reduced aggregate industry earnings.
Community banks reported quarterly net income of 4.8 billion dollars in the first quarter, a decline of 20.9 percent from a year ago. As with the whole banking industry, most of the decline was attributed to an increase in provision expenses.
Chart 2:
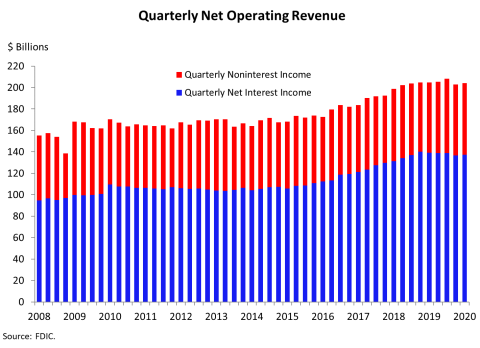
The next chart shows that net operating revenue remained relatively stable from a year ago at 204.2 billion dollars. Net interest income continued to decline for a second straight quarter, falling by 1.4 percent from a year ago. The annual decline reflects downward pressure on yields on earning assets. This reduction was partially offset by an increase in noninterest income.
Chart 3:
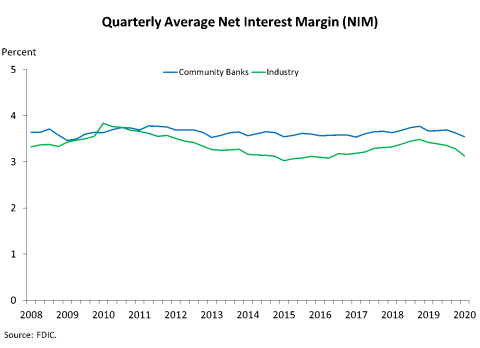
Chart 3 shows that the average net interest margin for the industry was 3.13 percent in the first quarter, down from a recent high of 3.48 percent at year-end 2018. The tightening of the average net interest margin was broad-based, as it fell for all five asset size groups featured in the Quarterly Banking Profile. The decline was attributable to asset yields falling more rapidly than funding costs.
Chart 4:
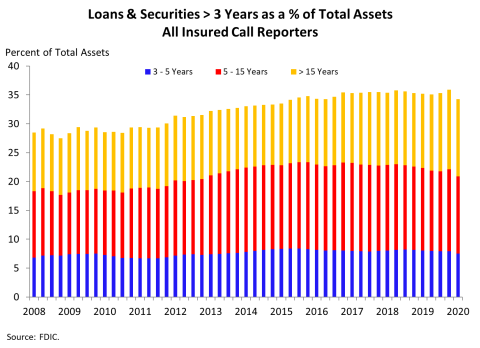
Chart 4 shows that the share of longer-term assets relative to total industry assets declined from a recent high at year-end 2019. Part of the decline is due to commercial and industrial loan growth. These loans tend to reprice in less than three years. However, more than one-third of industry assets mature or reprice in three or more years.
With short-term rate reductions during the month of March, banks face a challenging interest rate environment. In the post-crisis period of low interest rates, some banks responded by investing in longer-term assets or reducing liquid assets to maintain net interest margins. Yields are even lower than those experienced after the crisis and this could contribute to continued pressure on net interest margins.
Community banks are particularly vulnerable to fluctuating interest rates, as nearly half of their assets mature or reprice in three or more years.
Chart 5:
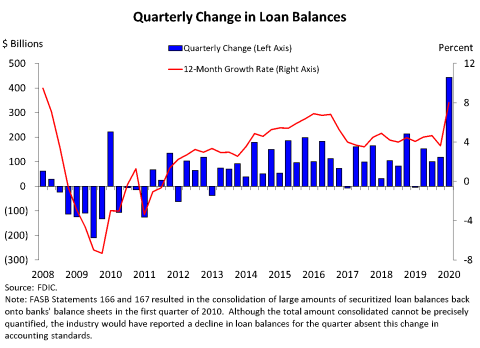
Chart 5 shows that loan balances increased by 442.9 billion dollars during the first quarter, or 8 percent annually. This was the highest year-over-year growth rate since first quarter 2008.
Almost all of the major loan categories reported quarterly increases. Commercial and industrial loans reported the largest quarterly dollar increase of 339.4 billion dollars, with most of the growth concentrated among the largest institutions. Additionally, unfunded commercial and industrial loan commitments dropped 269.6 billion dollars as some corporate borrowers drew down their lines as a precautionary measure against the economic downturn.
Loan growth at community banks also was strong, with total loan volume rising by 5.8 percent from a year ago. The annual increase was led by growth in the commercial real estate loan portfolio, commercial and industrial loan portfolio, and residential mortgages.
Chart 6:
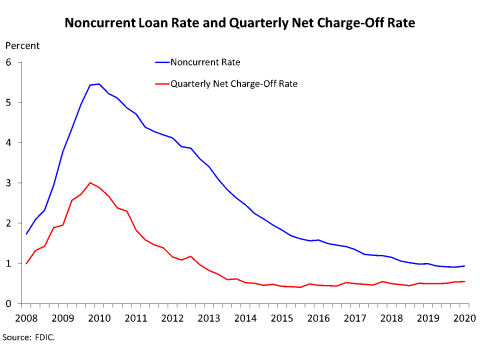
The next chart shows that asset quality metrics remained relatively stable in the first quarter. The noncurrent loan rate rose by 2 basis points from the previous quarter to 0.93 percent, and the net charge-off rate increased by 5 basis points from a year ago to 0.55 percent. Noncurrent commercial and industrial loans rose by 3.6 billion dollars – more than any other loan category. However, due to strong loan growth, the noncurrent rate only increased by 4 basis points to 0.83 percent.
The commercial and industrial loan portfolio also reported an increase of 1.3 billion dollars in net charge-offs from a year ago. The net charge-off rate for commercial and industrial loans rose to 0.47 percent from 0.27 percent a year ago, but remains below the recent high of 0.50 percent reported at year-end 2016.
Community banks continued to see deterioration in agriculture loan portfolios during the first quarter of 2020. Although the net charge-off rate for agriculture loans remained low, noncurrent rates increased in both farmland and agricultural production loan categories. The community bank farmland loan noncurrent rate rose 24 basis points year over year to 1.75 percent and the agricultural production loan noncurrent rate rose 25 basis points to 1.19 percent.
Chart 7:
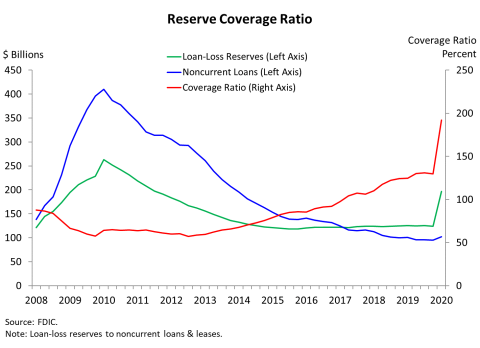
Chart 7 shows that the industry’s reserve coverage ratio, which measures loan-loss reserves relative to total noncurrent loan balances, increased significantly from the previous quarter to 192.2 percent. The quarterly increase was due to higher loan-loss reserves, resulting from the initial CECL implementation as well as increased provisions that reflect current economic conditions.
Chart 8:
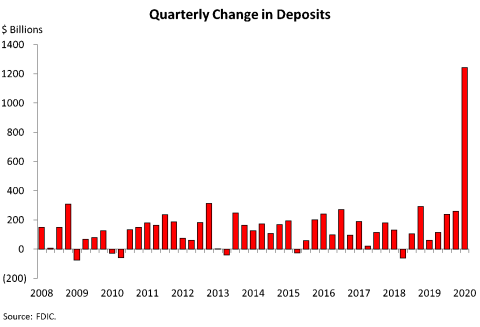
Chart 8 shows deposit growth surged in response to the economic uncertainty in March. Deposits rose by 1.2 trillion dollars in first quarter from the previous quarter. On an annual basis, deposits grew by 13.3 percent, the largest year-over-year growth rate ever reported by the Quarterly Banking Profile.
With rising deposits, the banking industry’s liquidity strengthened, as cash and due from balances increased by 740.4 billion dollars.
Chart 9:
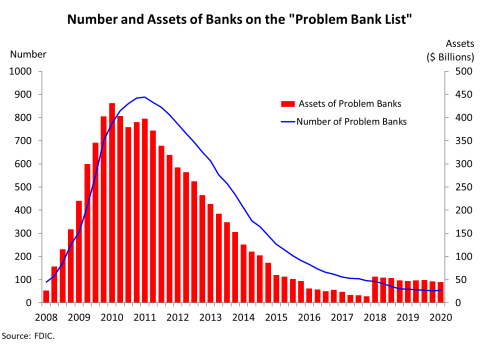
Chart 9 shows that the number of banks on the FDIC’s “Problem Bank List” increased from 51 to 54 during the quarter, the first quarterly increase since 2011. However, the number of problem banks remains near historic lows.
Changes to the number of insured institutions include two new banks that opened during the first quarter, 57 banks absorbed by mergers, and one bank failed.
Chart 10:
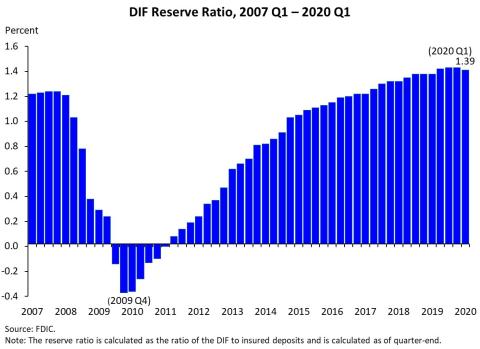
The Deposit Insurance Fund (DIF) balance was 113.2 billion dollars on March 31, up 2.9 billion dollars from the end of last quarter. Unrealized gains on available-for-sale securities and assessment income were the largest contributors to the increase in the fund, followed by interest earned on investment securities held by the DIF. Estimated insured deposits were 8.2 trillion dollars at the end of March, an increase of 4.5 percent from last quarter. The quarterly growth rate for estimated insured deposits is the highest recorded for any quarter in which there was not a change in deposit insurance coverage.
Chart 10 shows that the reserve ratio—the amount in the Deposit Insurance Fund relative to insured deposits—decreased to 1.39 percent at the end of March. The increase in estimated insured deposits outpaced the strong growth in the fund balance.
Small banks earned a total of 765 million dollars in credits for the portion of their assessments that contributed to growth in the reserve ratio from 1.15 to 1.35 percent. The FDIC will apply approximately 51 million dollars of credits to offset the first quarter assessments of small banks. This represents the final quarter in which the FDIC will apply credits to offset assessments. The FDIC will pay the remaining 5 million dollars to banks that did not fully use their credits during the credit application period.
In summary, the banking industry earnings have been adversely affected by the impact of COVID-19 pandemic. However, the banking industry remains strong, with continued loan growth, stable asset quality indicators, and the number of “problem banks” among historic lows.
We will now answer questions regarding first-quarter performance of the banking industry.
Thank you.