
Quarterly Banking Profile - Third Quarter 2020
Good afternoon, and welcome to our release of third quarter 2020 performance results for FDIC-insured institutions.
Consistent with improved economic activity, the banking industry reported better results in third quarter relative to the first half of the year. Banks reported higher net income, largely because of lower provisions for credit losses and an increase in noninterest income, compared with the first two quarters of 2020. Lower provisions reflect the improving economy and a general expectation from the banking industry of stabilization in the expected future credit performance of the loan portfolio. Deposit growth stabilized during the third quarter and is now near the average rate of growth between year-end 2014 and year-end 2019. However, economic uncertainty and the low interest rate environment remain headwinds for the banking industry. In the third quarter, banks faced additional downward pressure on net interest margins, an increase in nonperforming loans, and a decline in loan volume.
Community banks continued to outperform the industry with stronger improvements in annual net income and loan growth. Nonetheless, community banks continued to report an annual increase in provisions, further net interest margin compression, and a modest increase in nonperforming loans.
The low interest rate environment, flat yield curve, and continued economic uncertainties related to the trajectory of the COVID-19 pandemic will likely continue to exert downward pressure on revenue and challenge the banking industry over the near to medium term. Nonetheless, the banking industry remains well capitalized with ample liquidity and has, to date, weathered the economic effects of the pandemic.
The Deposit Insurance Fund (DIF) balance was $116.4 billion on September 30, up $1.8 billion from the end of the second quarter, and the DIF reserve ratio remained at 1.30 percent. Because the reserve ratio fell below its statutorily required minimum of 1.35 percent on June 30 of this year, the FDIC Board adopted a Fund Restoration Plan in September. In accordance with the Restoration Plan, FDIC staff closely monitors the factors that affect the reserve ratio and will provide progress reports and, as necessary, modifications to the plan to the Board at least semiannually.
I am joined today by Diane Ellis, Director of the Division of Insurance and Research; Pat Mitchell, Deputy Director of the Division of Insurance and Research; and Doreen Eberley, Director of the Division of Risk Management Supervision, to discuss bank performance during third quarter 2020.
Diane, I will turn this over to you. Thank you.
Chart 1:
Thank you, Chairman McWilliams.
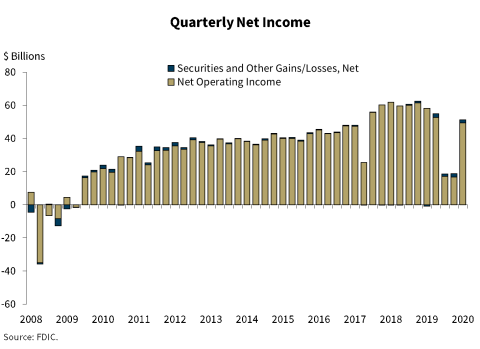
Our first chart shows that the banking industry reported quarterly net income of $51.2 billion during the third quarter, an 11 percent reduction from a year ago but an improvement from the 70 percent annual decline reported in the first and second quarters of 2020. More than half of all banks (52.7 percent) reported improvements in quarterly net income from the second quarter. The industry’s return-on-assets ratio was 0.97 percent during the third quarter, up from 0.36 percent in the previous quarter.
Lower net interest income, resulting from continued margin compression, drove the reduction in quarterly earnings. Provision expenses fell by $47.5 billion (77 percent) from the previous quarter, but remain above the year-ago level. In third quarter, the level of provisions suggests that some banks consider the reserves that had previously been set aside to be sufficient.
Community banks reported quarterly net income of $7.3 billion dollars in the third quarter, an increase of 10 percent from a year ago. A 32 percent quarterly decline in provisions, along with an increase in revenue from loan sales, drove the improvement in profitability.
Chart 2:
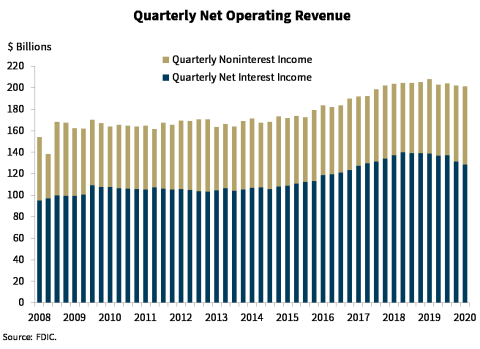
Chart 2 shows a 3 percent reduction in net operating revenue to $201.3 billion compared with a year ago. Net interest income fell for the fourth consecutive quarter, decreasing by 7.2 percent from a year ago—the largest decline in the history of the Quarterly Banking Profile (QBP). Net interest margin compression, resulting from continued downward pressure on earning asset yields, which continued to outpace the decline in average funding costs, drove this reduction.
A moderate increase in noninterest income—driven by higher revenue from loan sales and trading—helped offset a decline in revenue from interchange fees and service charges on deposit accounts.
Chart 3:
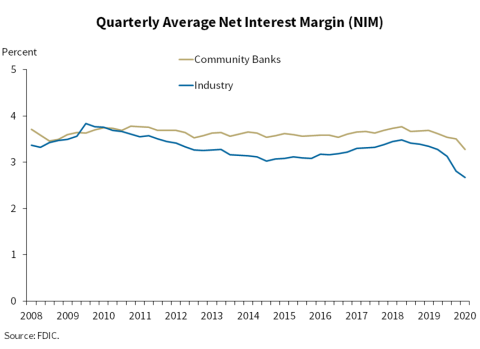
Chart 3 shows a 68 basis-point reduction in the industry’s average net interest margin to 2.68 percent. This is the lowest net interest margin on record in the history of the QBP. Banks of all QBP asset size groups reported average net interest margin compression. As mentioned earlier, a decline in earning asset yields that outpaced the reduction in funding costs drove this decline.
Chart 4:
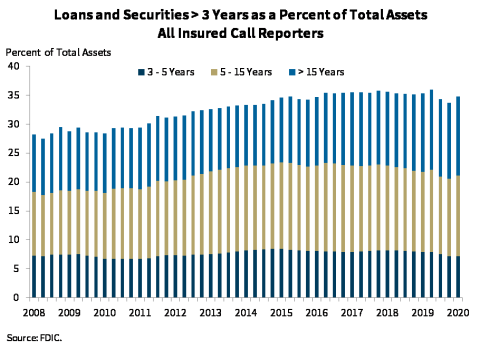
Chart 4 shows that the share of longer-term assets as a percentage of total industry assets increased slightly during the quarter, with more than one-third of industry assets set to contractually reprice or mature in three or more years. The industry continues to navigate the challenges presented by the low interest rate environment. As such, banks added longer-term assets to their balance sheets, which may help preserve or bolster net interest margins.
Community banks, in particular, remain vulnerable to interest rate fluctuations, as nearly half of their assets mature or reprice in three or more years.
Chart 5:
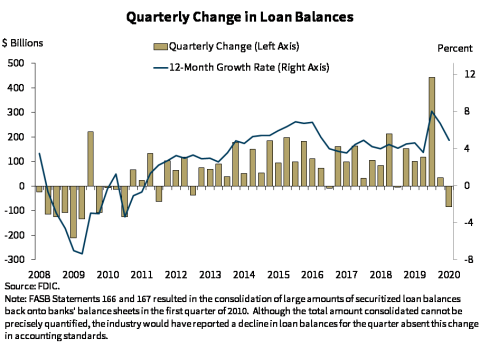
Chart 5 shows an $84.5 billion, or 0.8 percent, decline in loan balances in third quarter. The decline was driven by a reduction in commercial and industrial (C&I) lending. C&I loan volume fell by $150.3 billion (5.6 percent) from second quarter 2020. An increase in loans to nondepository financial institutions and 1-4 family residential mortgage loans partially offset the decline in C&I loan volume. Loan growth for the year ending third quarter was 4.9 percent.
Loan growth at community banks was positive for both the quarter and the year. Loans increased 1 percent between second and third quarters, driven by an increase in nonfarm nonresidential loans.
Chart 6:
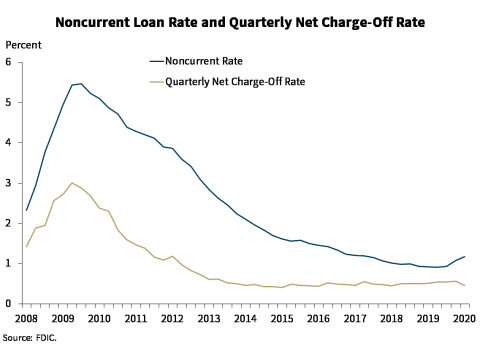
Chart 6 shows modest deterioration in the noncurrent rate in the third quarter, but a slight improvement in the net charge-off rate. The noncurrent loan rate rose 9 basis points to 1.17 percent, driven by a continued increase in noncurrent 1-4 family mortgage and nonfarm nonresidential loans. The industry reported a marginal decline in the net charge-off rate of 4 basis points to 0.46 percent from one year ago.
Community banks continued to face credit challenges in the agriculture sector. The noncurrent rate for loans secured by farmland rose 26 basis points year-over-year to 1.73 percent, and the noncurrent rate for agricultural production loans rose 25 basis points to 1.21 percent.
Chart 7:
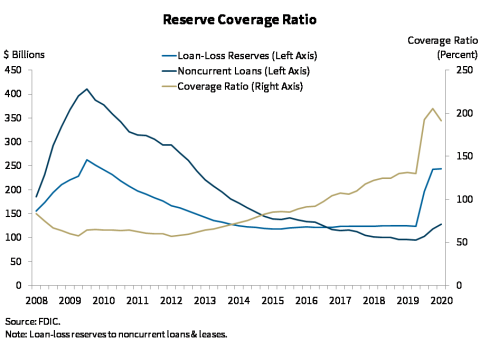
Chart 7 shows that the industry’s reserve coverage ratio, which compares the amount of loan-loss reserves to the amount of noncurrent loans, declined modestly from the previous quarter to 192 percent. An increase in noncurrent loans, coupled with a reduction in provision expenses during the quarter, drove the decline in the coverage ratio.
Chart 8:
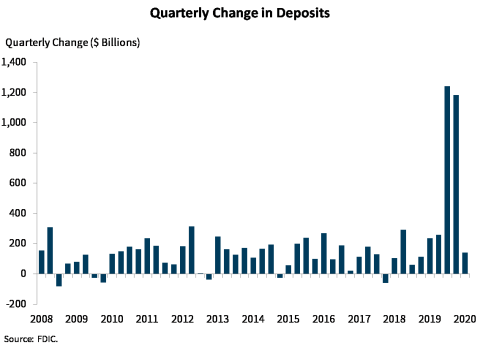
Chart 8 shows that deposit growth stabilized during the third quarter and is now near the average rate of growth between year-end 2014 and year-end 2019—prior to the surge in deposit levels reported during the first half of 2020. Total deposits increased by $156 billion (0.9 percent). This was down from 7.5 percent growth during second quarter 2020. Still, the banking industry continued to report strong liquidity levels, with a 6 percent increase in total security holdings from the previous quarter.
Chart 9:
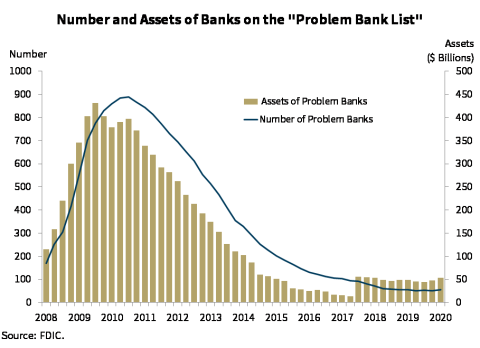
Chart 9 shows an increase in the number of banks on the FDIC’s “Problem Bank List” from 52 to 56 during the quarter. Despite the increase, the number of problem banks remains near historical lows.
Chart 10:
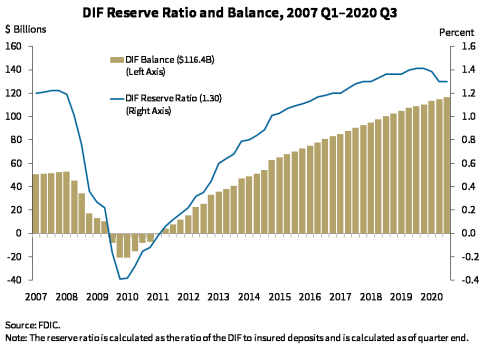
The DIF balance was $116.4 billion on September 30, up $1.8 billion from the end of the second quarter. Assessment income was the primary driver of the increase in the fund. Interest earned on investment securities held by the DIF also increased the fund balance. However, unrealized losses on available-for-sale securities held by the DIF partially offset the effect of increased income.
Estimated insured deposits grew by 1.0 percent during third quarter and stood at $8.9 trillion on September 30. Although this growth is well below the record increases experienced over the past two quarters, third-quarter growth in estimated insured deposits offset the growth in the fund balance.
Therefore, the reserve ratio—the amount in the DIF relative to insured deposits—remained unchanged at 1.30 percent at September 30, as can be seen in Chart 10.
As mentioned earlier, because the reserve ratio fell below its statutorily required minimum of 1.35 percent on June 30 of this year, the FDIC Board adopted a Fund Restoration Plan in September. The reduction in the reserve ratio was solely a result of the unprecedented increase in bank deposits.
Overall, the banking industry has demonstrated resilience despite continued economic challenges and uncertainty. The decline in net income has slowed from the first half of the year and deposits have continued to grow, demonstrating the confidence that consumers and businesses have in the safety of the banking system. However, the low interest rate environment, credit quality deterioration, and declining loan growth continue to challenge the industry.
Before closing, I would like to acknowledge the contributions that Chief Economist Rich Brown made to the QBP in his 30-year career with the FDIC. Rich passed away earlier this month after a brave battle against illness in recent years. His superior analyses, insightful commentary, and well-articulated responses to questions from reporters during QBP press conferences were invaluable and provided profound insight into the performance of the banking industry. Rich was instrumental in synthesizing emerging economic, banking, and financial market risks, and shaping the direction of the QBP. He will be greatly missed.
We will now answer questions regarding third-quarter performance of the banking industry.
Thank you.