
Quarterly Banking Profile - Third Quarter 2019
Good morning, and welcome to our release of third quarter 2019 performance results for FDIC-insured institutions.
Overall, the banking industry reported positive results, despite non-recurring events at three large institutions. While these events resulted in a modest decline in aggregate quarterly net income, the industry reported loan growth and the number of problem banks remained low.
Community banks also reported another positive quarter. Net income rose at community banks primarily because of higher net operating revenue. Additionally, the annual rate of loan growth at community banks outpaced the overall industry.
The record-long economic expansion continued in the United States. With two reductions in short-term rates and a flat yield curve this quarter, challenges in lending and funding continued. The competition to attract and maintain loan customers and depositors remains strong; consequently, banks need to maintain rigorous underwriting standards and prudent risk management.
Awareness of interest rate, liquidity, and credit risks at this stage of the economic cycle will position banks to be more resilient in maintaining lending through the economic cycle.
I am joined here today by Diane Ellis, Director of the Division of Insurance and Research; Pat Mitchell, Deputy Director of the Division of Insurance and Research; and Jim Watkins, Senior Deputy Director of the Division of Risk Management Supervision, to discuss bank performance during the third quarter.
Diane, I will turn this over to you. Thank you.
Chart 1:
Thank you, Chairman McWilliams.
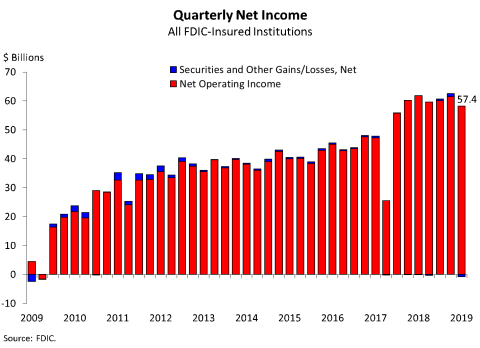
Our first chart shows that the banking industry reported quarterly net income of 57.4 billion dollars during the third quarter, a decline of 7.3 percent from a year ago. As mentioned, the decline in net income was due to nonrecurring events at a few large institutions. In line with recent years, more than 60 percent of all banks reported year-over-year increases in net income, and only 4.1 percent of institutions were unprofitable. The industry's return-on-assets ratio was 1.25 percent in the third quarter, down from 1.41 percent a year ago.
Community banks reported quarterly net income of 6.9 billion dollars in the third quarter, an increase of 7.2 percent from a year ago.
Chart 2:
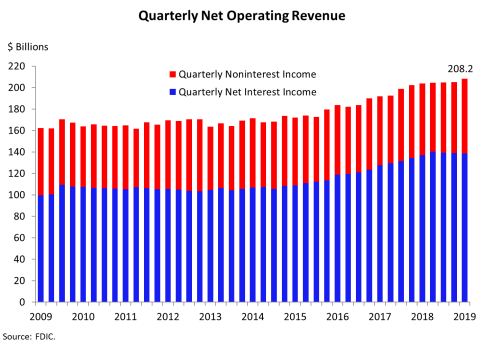
The next chart shows that net operating revenue totaled 208.2 billion dollars in the third quarter, an increase of 2.2 percent from a year ago. The growth in revenue was due to higher noninterest income, which grew by 4.3 percent. Improvement in noninterest income was led by higher net gains on loan sales and an increase in the "other" noninterest income category.
Net interest income rose by 1.2 percent from a year ago, the lowest annual growth rate since fourth quarter 2014. This slowdown was the result of lower yields on earning assets and higher costs of funds.
Chart 3:
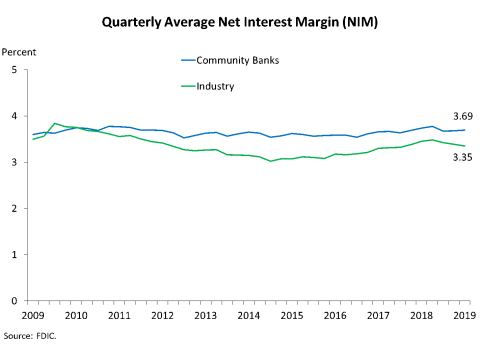
Chart 3 shows that the average net interest margin for the industry was 3.35 percent in the third quarter, down from a recent high of 3.48 percent at year-end 2018. The decline was broad-based, as net interest margins were lower for all five asset size groups featured in the Quarterly Banking Profile. The decline was caused by funding costs rising more than yields on earning assets.
Community banks continued to report a higher average net interest margin than the overall banking industry. Large institutions previously benefitted more than community banks from rising short-term interest rates, as large institutions have a greater share of assets that reprice quickly. With the recent reduction in short-term interest rates, we are seeing a reversal of this trend.
Chart 4:
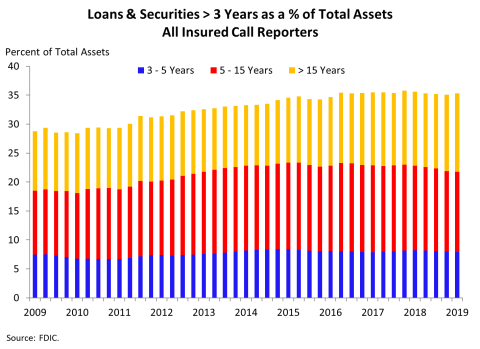
Chart 4 shows that the share of longer-term assets relative to total industry assets remained elevated, with more than one-third of industry assets maturing or repricing in three or more years.
Banks face a challenging interest-rate environment with the recent short-term rate reductions and the flat yield curve. During the post-crisis period of low interest rates, some banks responded by "reaching for yield" by investing in longer-term assets or reducing liquid assets to increase their yield on earning assets and maintain net interest margins. In the current environment, refinanced or new long-term assets are originated at lower yields.
Chart 5:
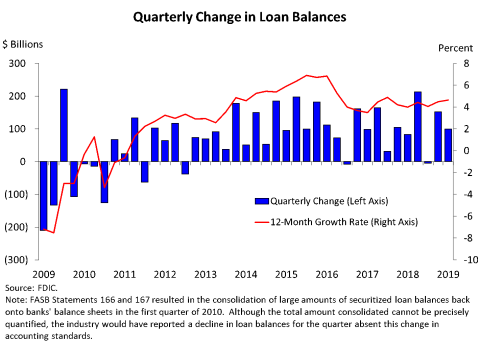
Chart 5 shows that loan balances rose by 99.5 billion dollars during the third quarter, as all major loan categories reported quarterly increases.
During the past 12 months, loan balances rose by 4.6 percent, slightly above the 4.5 percent annual growth rate reported last quarter. The biggest contributors to loan growth were commercial and industrial loans, consumer loans, and residential mortgages.
Loan growth at community banks was also strong, increasing by 6 percent from a year ago. The portfolios with the largest growth were commercial real estate loans, residential mortgages, and commercial and industrial loans.
Chart 6:
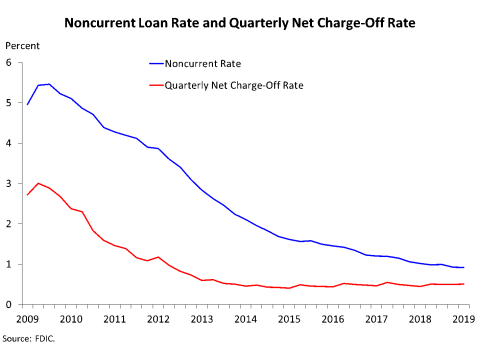
The next chart shows that asset quality indicators remained stable. The noncurrent loan rate declined from the previous quarter to 0.92 percent, while the net charge-off rate rose modestly to 0.51 percent from 0.45 percent a year ago.
Commercial and industrial loans registered the largest dollar increase in net charge-offs this quarter. The net charge-off rate for commercial and industrial loans rose to 0.41 percent from 0.25 percent a year ago, but remains below the recent high of 0.50 percent reported in fourth quarter 2016.
Modest deterioration in the agriculture sector continued due to low commodity prices and farm incomes. While the net charge-off rate for agriculture loans remained low, some banks continued to experience asset quality deterioration in farmland and production loans. The noncurrent rate for agriculture loans at community banks rose by 11 basis points from a year ago to 1.27 percent, but is below levels reached during previous downturns.
Chart 7:
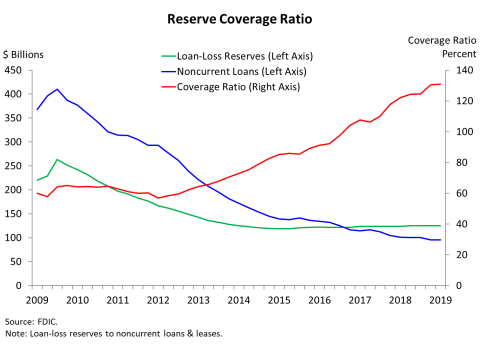
Chart 7 shows that the industry's reserve coverage ratio, which measures loan-loss reserves relative to total noncurrent loan balances, remained flat from the previous quarter at 131 percent.
Chart 8:
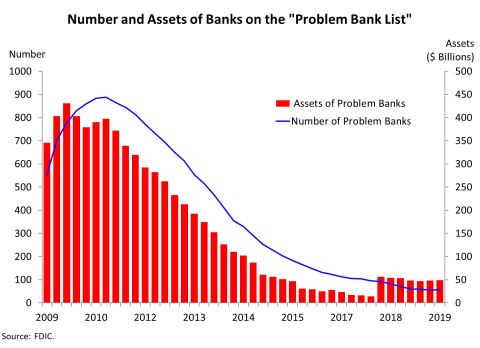
Chart 8 shows that the number of banks on the FDIC's "Problem Bank List" declined from 56 to 55 during the quarter. This is the lowest number of problem banks since first quarter 2007. Four new banks opened in the third quarter for a total of 10 new banks in 2019. No banks failed in the third quarter.
Chart 9:
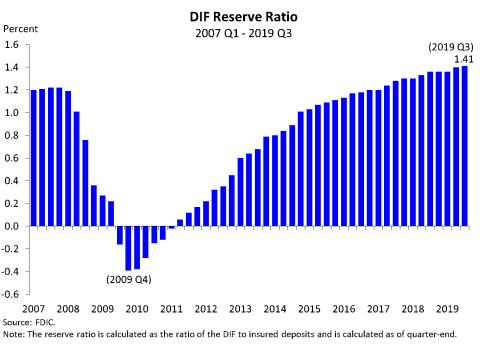
The Deposit Insurance Fund balance was 108.9 billion dollars on September 30, up 1.5 billion dollars from the end of last quarter. Assessment income was the largest contributor to the increase in the fund, followed by interest earned on investment securities held by the DIF and a reduction in losses from past failures. Estimated insured deposits were 7.7 trillion dollars at the end of September, an increase of 0.6 percent from last quarter.
Chart 9 shows that the reserve ratio—the amount in the Deposit Insurance Fund relative to insured deposits—rose to 1.41 percent at the end of September, an increase of 1 basis point from last quarter.
Small banks earned a total of 765 million dollars in credits for the portion of their assessments that contributed to growth in the reserve ratio from 1.15 percent to 1.35 percent. The FDIC automatically applies credits to offset the assessments of small banks when the reserve ratio is at least 1.35 percent. Therefore, the FDIC will apply approximately 239 million dollars of credits to offset the third-quarter assessments of small banks, which are due in December. By year-end, the FDIC will have applied a total of 559 million dollars, or 73 percent, of the credits earned by small banks.
In summary, the banking industry reported overall positive results despite nonrecurring events at three large institutions. Loan balances expanded and the number of "problem banks" remained low.
We will now answer any questions you may have regarding third-quarter performance of the banking industry.
Thank you.