
Quarterly Banking Profile – Fourth Quarter 2018
Remarks of FDIC Chairman Jelena McWilliams:
Good afternoon, and welcome to our release of fourth-quarter and full-year 2018 performance results for FDIC-insured institutions.
Once again, the banking industry reported a strong quarter. Net income improved on higher net operating revenue and a lower effective tax rate. Loan balances continued to increase, net interest margins improved, and the number of "problem banks" remains low.
Community banks also reported another positive quarter. Net income at community banks also benefitted from higher revenue and a lower effective tax rate, as well as loan growth that was stronger than the overall industry during the year.
The current economic expansion is the second-longest on record, and the nation's banks are stronger as a result.
While results this quarter were positive, the extended period of low interest rates and an increasingly competitive lending environment continue to lead some institutions to "reach for yield." With the recent flattening of the yield curve, new challenges for institutions in lending and funding may emerge. Furthermore, the competition to attract loan customers remains strong, and therefore, banks need to maintain their underwriting discipline and credit standards.
These factors have led to heightened exposure to interest-rate, liquidity, and credit risk. Banks must prudently manage these risks in order to sustain lending through the downside of this economic cycle when it occurs.
I am joined here today by Diane Ellis, Director of the Division of Insurance and Research; Pat Mitchell, Deputy Director of the Division of Insurance and Research; and Doreen Eberley, Director of the Division of Risk Management Supervision. They will provide details about bank performance during the fourth quarter.
Diane, I will turn this over to you. Thank you.
Remarks of Diane Ellis, Director of the Division of Insurance and Research :
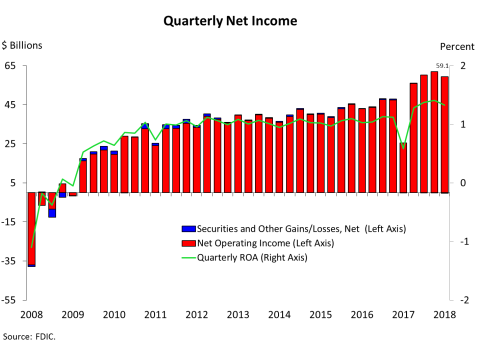
Chart 1:
Thank you, Chairman McWilliams.
Our first chart shows that net income for the industry was 59.1 billion dollars in the fourth quarter. More than half of the dollar increase in net income was attributable to the 2017 tax reform, which resulted in significant one-time charges in fourth quarter 2017 and a lower effective tax rate moving forward. Normalizing fourth quarters 2017 and 2018 using the average effective tax rate for the banking industry prior to the tax reform, we estimate that quarterly net income would have been 50.3 billion dollars in fourth quarter 2018, 18.5 percent higher than fourth quarter 2017. The return-on-assets ratio increased to 1.33 percent in the fourth quarter from 0.58 percent one year ago.
Community banks reported net income of 6.8 billion dollars in the fourth quarter, an increase of 65.1 percent from a year earlier. After adjusting for tax-reform effects, we estimate that quarterly net income for community banks would have been 6.1 billion dollars, an increase of 11.2 percent over fourth quarter 2017.
Chart 2:
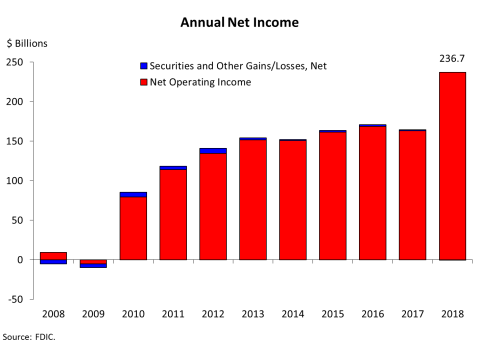
Chart 2 shows that full-year 2018 net income increased to 236.7 billion dollars, up 44.1 percent from 2017, primarily due to a decline in applicable taxes resulting from the 2017 tax law.
Adjusted for tax-reform effects, we estimate that full-year 2018 net income would have been 207.9 billion dollars, or 13.6 percent higher than 2017.
Community banks reported annual net income of 26.1 billion dollars in 2018, up 29.4 percent from 2017. Adjusted for tax-reform effects, we estimate that full-year 2018 net income would have been 24.1 billion dollars, or 10.7 percent higher than 2017.
Chart 3:
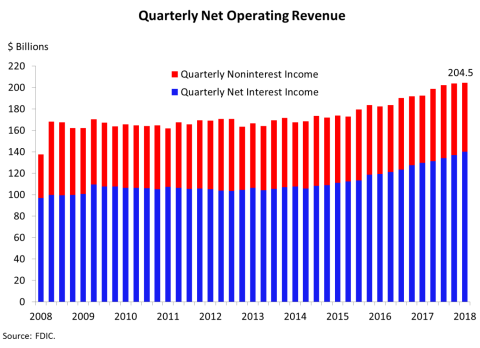
The next chart shows that net operating revenue totaled 204.5 billion dollars in the fourth quarter, an increase of 6.3 percent from a year ago. The growth in revenue was due to higher net interest income and higher noninterest income.
Net interest income grew by 8.1 percent from a year ago because of loan growth and improved net interest margins. Noninterest income rose by 2.6 percent from a year ago because of net gains on sales of other assets and other noninterest income.
Chart 4:
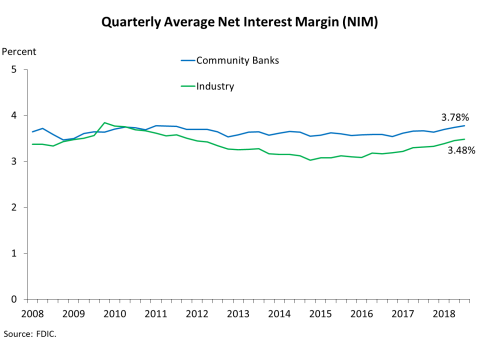
Chart 4 shows that the average net interest margin for the industry was 3.48 percent in the fourth quarter, up from 3.31 percent a year earlier. The average funding cost increased by 37 basis points from fourth quarter 2017, while the average asset yield rose by 54 basis points.
Community banks continue to report a higher average net interest margin than the overall industry. However, the gap has been narrowing. Large institutions have benefitted more than community banks from rising short-term interest rates, as large institutions have a greater share of assets that reprice quickly.
Chart 5:
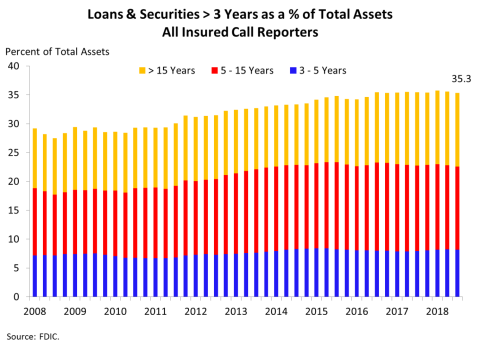
Chart 5 shows that the shares of longer-term assets relative to total industry assets remain elevated, with more than a third of industry assets maturing or repricing in three or more years.
Some banks have responded to the extended period of low interest rates by "reaching for yield" through investments in longer-term assets, while other banks have reduced their on-balance sheet liquidity – cash, federal funds – to increase overall yields on earning assets and maintain net interest margins.
Further flattening of the yield curve in conjunction with banks' increased proportion of long-term assets could be a headwind against future earnings.
So far, increases in interest rates have been largely beneficial to most banks as assets have repriced at a faster rate and in a greater amount than liabilities.
However, repricing of deposits in response to growing depositor demand for increased rates could result in earnings pressure for banks, particularly those that have a significant amount of long-term assets or those that rely on rate-sensitive deposits.
Community banks are particularly vulnerable to interest-rate risk, as nearly half of their assets mature or reprice in three or more years.
Chart 6:
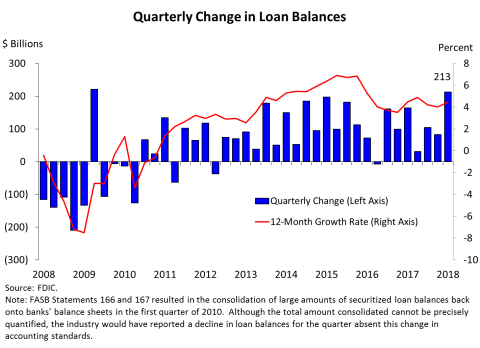
Chart 6 shows that loan balances increased by 213 billion dollars during the fourth quarter, as all major loan categories registered growth. The largest increases were in commercial and industrial loans and consumer loans, led by credit card balances.
Over the past year, loan balances rose by 4.4 percent. This is a slight increase from the 4 percent annual growth rate reported in the third quarter.
Loan growth at community banks was also strong, measuring 6.5 percent for the past 12 months, led by growth in commercial real estate loans, residential mortgages, and commercial and industrial loans.
Chart 7:
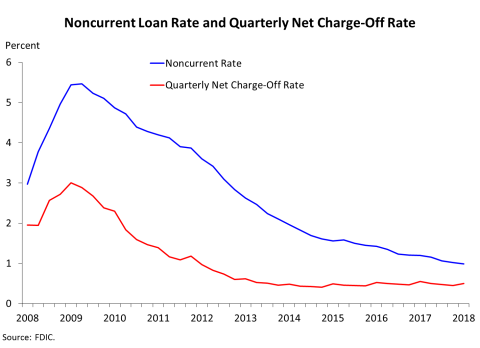
The next chart shows that overall asset quality indicators remain strong. The noncurrent rate declined from the previous quarter, and the net charge-off rate was lower than a year ago. Among the major loan categories, credit card balances registered the largest dollar increase in net charge-offs this quarter. However, growth in credit card volume outpaced growth in charge-offs, causing the net charge-off rate for credit cards to decline 6 basis points to 3.71 percent in the fourth quarter. This remains well below the recent high of 13.21 percent reported in first quarter 2010.
We continue to monitor trends in the agricultural sector. Commodity prices remain low, and net farm income has declined by roughly 50 percent since reaching its peak in 2013. Farmland loan delinquencies have ticked up, but remain relatively low.
Chart 8:
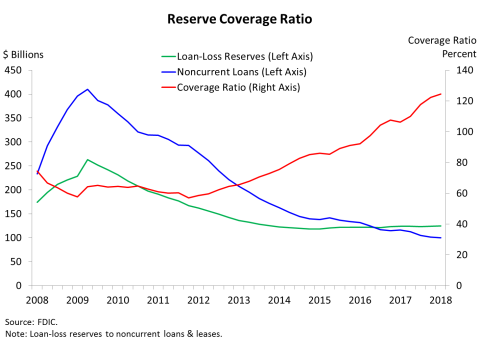
Chart 8 shows that the industry's reserve coverage ratio, which measures loan-loss reserves relative to total noncurrent loan balances, increased to 124.4 percent at the end of the fourth quarter. This is the highest reserve coverage ratio since first quarter 2007. The primary driver for the improvement in the reserve coverage ratio is a 1 billion dollar decline in noncurrent loans this quarter.
Chart 9:
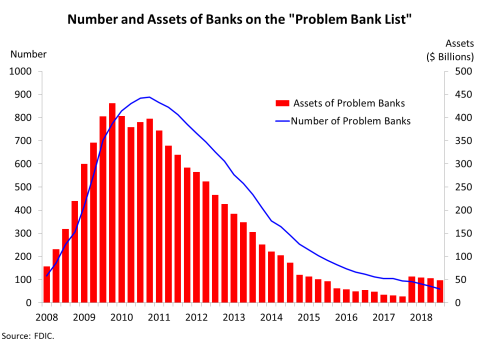
Chart 9 shows that the number of banks on the FDIC's "Problem Bank List" declined from 71 to 60 during the quarter. This is the lowest number of problem banks since first quarter 2007. Two new banks opened, and no failures occurred in the fourth quarter. No banks failed in 2018 – the first year with no failures since 2006.
Chart 10:
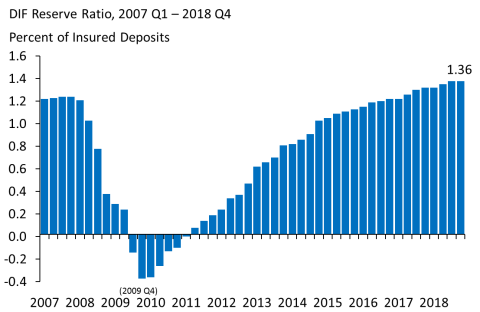
The Deposit Insurance Fund balance was 102.6 billion dollars on December 31, up 2.4 billion dollars from the end of the third quarter. The increase in the fund was largely driven by assessment income, followed by unrealized gains and interest income on securities held by the DIF. Estimated insured deposits totaled 7.5 trillion dollars at the end of September, increasing 2 percent in the fourth quarter and 5.1 percent over the past four quarters.
Chart 10 shows that the reserve ratio—the amount in the Deposit Insurance Fund relative to insured deposits—did not change from the third quarter, remaining at 1.36 percent on December 31, 2018.
Small banks will receive credits for the portion of their assessments that contributed to growth in the reserve ratio from 1.15 percent to 1.35 percent. These credits amount to 765 million dollars in aggregate, and will be automatically applied to offset the assessments of small banks in periods that the reserve ratio is at least 1.38 percent. The FDIC notified banks of their individual share of the credits in January.
In summary, the banking industry reported positive results for the quarter. Higher net operating revenue and a lower effective tax rate increased net income. Loan balances grew, net interest margins improved, and the number of "problem banks" continued to decline.
We will now answer any questions you have regarding fourth-quarter performance of the banking industry.
Thank you.
And with that, we will take questions.