
2015 Annual Report
IV. FDIC Budget and Spending
CORPORATE OPERATING BUDGET
The FDIC segregates its corporate operating budget and expenses into two discrete components: ongoing operations and receivership funding. The receivership funding component represents expenses resulting from financial institution failures and is, therefore, largely driven by external forces, while the ongoing operations component accounts for all other operating expenses and tends to be more controllable and estimable. Corporate Operating expenses totaled $2.1 billion in 2015, including $1.7 billion in ongoing operations and $0.4 billion in receivership funding. This represented approximately 93 percent of the approved budget for ongoing operations and 78 percent of the approved budget for receivership funding for the year.1
The Board of Directors approved a 2016 Corporate Operating Budget of approximately $2.2 billion, consisting of $1.8 billion for ongoing operations and $0.4 billion for receivership funding. The level of the approved ongoing operations budget for 2016 is approximately $17 million (0.9 percent) higher than the 2015 ongoing operations budget, while the approved receivership funding budget is roughly $125 million (23.8 percent) lower than the 2015 receivership funding budget.
As in prior years, the 2016 budget was formulated primarily on the basis of an analysis of projected workload for each of the Corporation’s three major business lines and its program support functions. The most significant factor contributing to the decrease in the Corporate Operating Budget is the improving health of the industry and the subsequent reduction in failure-related workload. Although savings in this area are being realized, the 2016 receivership funding budget provides resources for contractor support as well as nonpermanent staffing for DRR, the Legal Division, and other organizations, should workload in these areas require an immediate response.
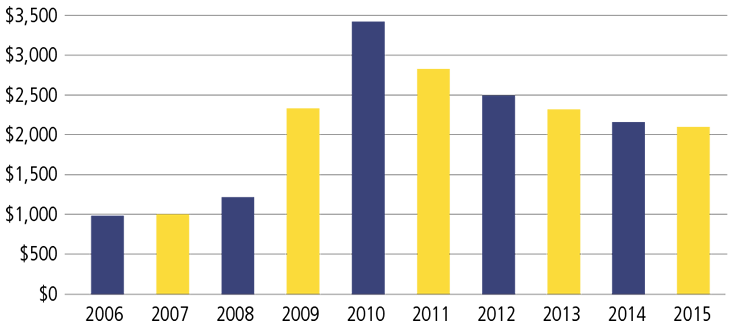
FDIC EXPENDITURES 2006–2015
Dollars in Millions
1 The numbers in this paragraph will not agree with the DIF and FRF financial statements due to differences in how items are classified.