
2014 Annual Report
III. Financial Highlights
In its role as deposit insurer of financial institutions, the FDIC promotes the safety and soundness of insured depository institutions (IDIs). The following financial highlights address the performance of the deposit insurance funds.
DEPOSIT INSURANCE FUND PERFORMANCE
The FDIC administers the Deposit Insurance Fund (DIF) and the FSLIC Resolution Fund (FRF), which fulfills the obligations of the former Federal Savings and Loan Insurance Corporation (FSLIC) and the former Resolution Trust Corporation (RTC). The following summarizes the condition of the DIF. (See the accompanying graphs on FDIC-Insured Deposits and Insurance Fund Reserve Ratios on the following page.)
For 2014, the DIF’s comprehensive income totaled $15.6 billion compared to comprehensive income of $14.2 billion during 2013. This $1.4 billion year-over-year increase was primarily due to a $2.6 billion decrease in provision for insurance losses, partially offset by a $1.0 billion decrease in assessment revenue.
Assessment revenue was $8.7 billion for 2014. The decrease of $1.0 billion, from $9.7 billion in 2013, was primarily due to lower risk-based assessment rates resulting from continued improvements in banks’ CAMELS ratings and financial condition.
The provision for insurance losses was negative $8.3 billion for 2014, compared to negative $5.7 billion for 2013. The negative provision for 2014 primarily resulted from a decrease of $9.1 billion in the estimated losses for institutions that failed in current and prior years, partially offset by an increase of $850 million in the contingent liability for anticipated failures due to the deterioration in the financial condition of certain troubled institutions.
The $9.1 billion reduction in the estimated losses from failures was primarily attributable to (1) unanticipated recoveries of $1.8 billion in litigation settlements, professional liability claims, and tax refunds by the receiverships and (2) a $6.7 billion decrease in the receiverships’ shared-loss liability that resulted from decreases in covered asset balances, lower future loss rate estimates, and unanticipated recoveries on shared-loss agreement losses. Covered asset balances decreased by $23.6 billion during 2014 with lower than anticipated losses. These lower than anticipated losses were due to loan amortizations and pay-downs, resulting from the improvement in the condition of real estate markets where shared-loss assets are concentrated, and the expiration of 83 commercial asset shared-loss coverage agreements in 2014, thereby ending the loss claim period. The reduction in future loss rate estimates resulted from the general improvement in the real estate markets and the composition of the remaining covered asset portfolios, which primarily consist of performing single family assets. These assets have historically experienced significantly lower losses than commercial assets. Finally, unanticipated recoveries of approximately $958 million on previous shared-loss claims, which are not estimated due to their uncertainty, were received by the receiverships during 2014.
The DIF’s interest revenue on U.S. Treasury investments for 2014 was $282 million compared to interest revenue of $103 million in 2013. This $179 million year-over-year increase reflects not only a larger investment portfolio balance, but also new, higher-yielding investments. The DIF’s cash and U.S. Treasury investment portfolio balance was $51.7 billion at year-end 2014, an increase of $9.7 billion from the year-end 2013 balance of $42.0 billion that was primarily due to assessment collections of $8.9 billion and recoveries from resolutions of $4.1 billion, less disbursements for resolutions of $1.9 billion and cash operating expenses of $1.6 billion.
ESTIMATED DIF INSURED DEPOSITS
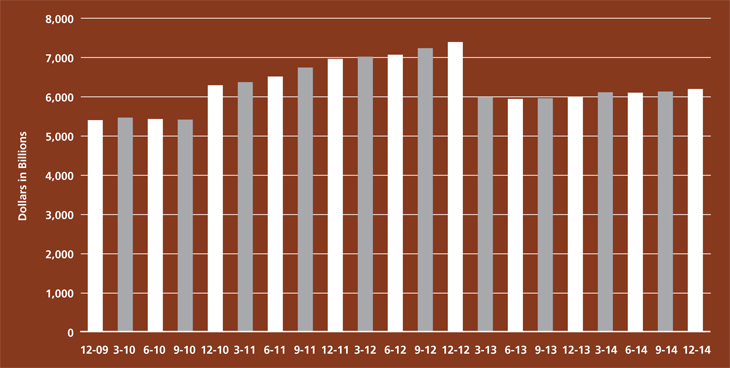
SOURCE: Commercial Bank Call and Thrift Financial Reports
Note: Beginning in the fourth quarter of 2010 through the fourth quarter of 2012, estimated insured deposits include the entire balance of noninterest-bearing transaction accounts.
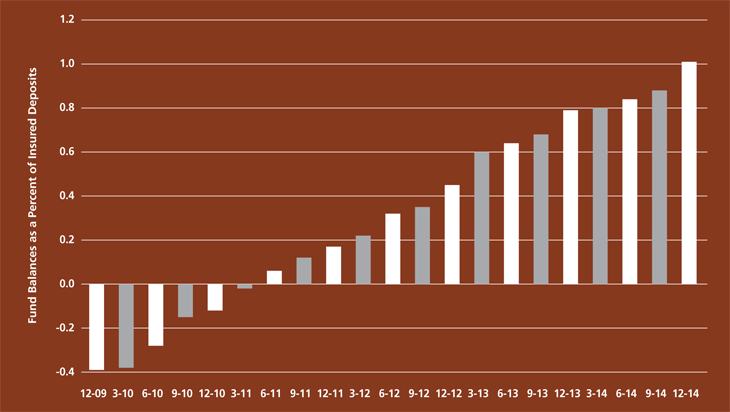
DEPOSIT INSURANCE FUND RESERVE RATIOS
| For the years ended December 31 | ||||||||
|---|---|---|---|---|---|---|---|---|
| 2014 | 2013 | 2012 | ||||||
| Financial Results | ||||||||
| Revenue | $8,965 | $10,459 | $18,522 | |||||
| Operating Expenses | 1,664 | 1,609 | 1,778 | |||||
| Insurance and Other Expenses (includes provision for loss) | (8,299) | (5,655) | (4,377) | |||||
| Net Income | 15,600 | 14,505 | 21,121 | |||||
| Comprehensive Income | 15,589 | 14,233 | 21,131 | |||||
| Insurance Fund Balance | $62,780 | $47,191 | $32,958 | |||||
| Fund as a Percentage of Insured Deposits (reserve ratio) | 1.01% | 0.79% | 0.44% | |||||
| Selected Statistics | ||||||||
| Total DIF-Member Institutions1 | 6,509 | 6,812 | 7,183 | |||||
| Problem Institutions | 291 | 467 | 651 | |||||
| Total Assets of Problem Institutions | $86,712 | $152,687 | $232,701 | |||||
| Institution Failures | 18 | 24 | 51 | |||||
| Total Assets of Failed Institutions in Year2 | $2,914 | $6,044 | $11,617 | |||||
| Number of Active Failed Institution Receiverships | 481 | 479 | 463 | |||||
1 Commercial banks and savings institutions. Does not include U.S. insured branches of foreign banks.
2 Total Assets data are based upon the last Call Report filed by the institution prior to failure.