
2013 Annual Report
VI. Appendices
A. Key Statistics
FDIC Expenditures 2004–2013
Dollars in Millions
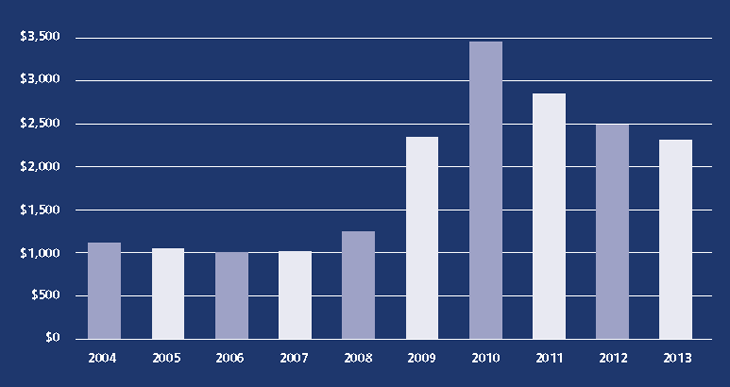
The FDIC's Strategic Plan and Annual Performance Plan provide the basis for annual planning and budgeting for needed resources. The 2013 aggregate budget (for corporate, receivership, and investment spending) was $2.7 billion, while actual expenditures for the year were $2.3 billion, about $0.2 billion less than 2012 expenditures.
Over the past decade the FDIC's expenditures have varied in response to workload. Earlier in the decade, expenditures rose, largely due to increasing resolution and receivership activity. To a lesser extent increased expenses resulted from supervision-related costs associated with the oversight of more troubled institutions. More recently, these increases have been subsiding.
| FDIC Actions on Financial Institutions Applications 2011–2013 | |||
|---|---|---|---|
| 2013 | 2012 | 2011 | |
| Deposit Insurance | 10 |
6 |
10 |
| Approved1 | 10 |
6 |
10 |
| Denied | 0 |
0 |
0 |
| New Branches | 499 |
570 |
442 |
| Approved | 499 |
570 |
442 |
| Denied | 0 |
0 |
0 |
| Mergers | 256 |
238 |
206 |
| Approved | 256 |
238 |
206 |
| Denied | 0 |
0 |
0 |
| Requests for Consent to Serve2 | 474 |
674 |
876 |
| Approved | 474 |
671 |
875 |
| Section 19 | 4 |
10 |
24 |
| Section 32 | 470 |
661 |
851 |
| Denied | 0 |
3 |
1 |
| Section 19 | 0 |
1 |
0 |
| Section 32 | 0 |
2 |
1 |
| Notices of Change in Control | 22 |
26 |
21 |
| Letters of Intent Not to Disapprove | 22 |
26 |
21 |
| Disapproved | 0 |
0 |
0 |
| Brokered Deposit Waivers | 81 |
97 |
84 |
| Approved | 81 |
95 |
83 |
| Denied | 0 |
2 |
1 |
| Savings Association Activities3 | 8 |
21 |
30 |
| Approved | 8 |
21 |
30 |
| Denied | 0 |
0 |
0 |
| State Bank Activities/Investments4 | 10 |
7 |
9 |
| Approved | 10 |
7 |
9 |
| Denied | 0 |
0 |
0 |
| Conversion of Mutual Institutions | 7 |
8 |
6 |
| Non-Objection | 7 |
8 |
6 |
| Objection | 0 |
0 |
0 |
1Includes deposit insurance application filed on behalf of (1) newly organized institutions, (2) existing uninsured financial services companies seeking establishment as an insured institution, and (3) interim institutions established to facilitate merger or conversion transactions, and applications to facilitate the establishment of thrift holding companies.
2Under Section 19 of the Federal Deposit Insurance (FDI) Act, an insured institution must receive FDIC approval before employing a person convicted of dishonesty or breach of trust. Under Section 32, the FDIC must approve any change of directors or senior executive officers at a state nonmember bank that is not in compliance with capital requirements or is otherwise in troubled condition.
3Amendments to Part 303 of the FDIC Rules and Regulations changed FDIC oversight responsibility in October 1998. In 1998, Part 303 changed the Delegations of Authority to act upon applications.
4Section 24 of the FDI Act, in general, precludes a federally insured state bank from engaging in an activity not permissible for a national bank and requires notices to be filed with the FDIC.
| Compliance, Enforcement, and Other Related Legal Actions 2011–2013 | |||
|---|---|---|---|
| 2013 | 2012 | 2011 | |
| Total Number of Actions Initiated by the FDIC | 414 |
557 |
557 |
| Termination of Insurance | |||
| Involuntary Termination | |||
| Sec. 8a For Violations, Unsafe/Unsound Practices or Conditions | 0 |
0 |
0 |
| Voluntary Termination | |||
| Sec. 8a By Order Upon Request | 0 |
0 |
0 |
| Sec. 8p No Deposits | 7 |
3 |
7 |
| Sec. 8q Deposits Assumed | 4 |
4 |
2 |
| Sec. 8b Cease-and-Desist Actions | |||
| Notices of Charges Issued | 2 |
0 |
7 |
| Orders to Pay Restitution | 11 |
9 |
N/A |
| Consent Orders | 70 |
120 |
183 |
| Sec. 8e Removal/Prohibition of Director or Officer | |||
| Notices of Intention to Remove/Prohibit | 14 |
8 |
11 |
| Consent Orders | 99 |
108 |
100 |
| Sec. 8g Suspension/Removal When Charged With Crime | 0 |
0 |
1 |
| Civil Money Penalties Issued | |||
| Sec. 7a Call Report Penalties | 0 |
1 |
0 |
| Sec. 8i Civil Money Penalties | 81 |
164 |
193 |
| Sec. 8i Civil Money Penalty Notices of Assessment | 13 |
5 |
5 |
| Sec. 10c Orders of Investigation | 16 |
16 |
29 |
| Sec. 19 Waiver Orders | |||
| Approved Section 19 Waiver Orders | 86 |
119 |
10 |
| Denied Section 19 Waiver Orders | 2 |
0 |
1 |
| Sec. 32 Notices Disapproving Officer/Director’s Request for Review | 0 |
0 |
0 |
| Truth-in-Lending Act Reimbursement Actions | |||
| Denials of Requests for Relief | 0 |
0 |
0 |
| Grants of Relief | 0 |
0 |
0 |
| Banks Making Reimbursement1 | 98 |
126 |
84 |
| Suspicious Activity Reports (Open and closed institutions)1 | 123,134 |
139,102 |
125,460 |
| Other Actions Not Listed | 9 |
0 |
8 |
1These actions do not constitute the initiation of a formal enforcement action and, therefore, are not included in the total number of actions initiated.
| Estimated Insured Deposits and the Deposit Insurance Fund, December 31, 1934, through December 31, 2013 Dollars in Millions (except Insurance Coverage)1 |
|||||||
|---|---|---|---|---|---|---|---|
| Deposits in Insured Institutions2 | Insurance Fund as a Percentage of | ||||||
| Year | Insurance Coverage2 | Total Domestic Deposits | Est. Insured Deposits | Percentage of Insured Deposits | Deposit Insurance Fund | Total Domestic Deposits | Est. Insured Deposits |
| 2013 | $250,000 |
$9,825,300 |
$6,011,310 |
61.2 |
$47,190.8 |
0.48 |
0.79 |
| 2012 | $250,000 |
$9,474,582 |
$7,406,522 |
78.2 |
$32,957.8 |
0.35 |
0.44 |
| 2011 | 250,000 |
8,782,134 |
6,974,690 |
79.4 |
11,826.5 |
0.13 |
0.17 |
| 2010 | 250,000 |
7,887,733 |
6,302,329 |
79.9 |
(7,352.2) |
(0.09) |
(0.12) |
| 2009 | 250,000 |
7,705,353 |
5,407,773 |
70.2 |
(20,861.8) |
(0.27) |
(0.39) |
| 2008 | 100,000 |
7,505,409 |
4,750,783 |
63.3 |
17,276.3 |
0.23 |
0.36 |
| 2007 | 100,000 |
6,921,678 |
4,292,211 |
62.0 |
52,413.0 |
0.76 |
1.22 |
| 2006 | 100,000 |
6,640,097 |
4,153,808 |
62.6 |
50,165.3 |
0.76 |
1.21 |
| 2005 | 100,000 |
6,229,823 |
3,891,000 |
62.5 |
48,596.6 |
0.78 |
1.25 |
| 2004 | 100,000 |
5,724,775 |
3,622,213 |
63.3 |
47,506.8 |
0.83 |
1.31 |
| 2003 | 100,000 |
5,224,030 |
3,452,606 |
66.1 |
46,022.3 |
0.88 |
1.33 |
| 2002 | 100,000 |
4,916,200 |
3,383,720 |
68.8 |
43,797.0 |
0.89 |
1.29 |
| 2001 | 100,000 |
4,565,068 |
3,216,585 |
70.5 |
41,373.8 |
0.91 |
1.29 |
| 2000 | 100,000 |
4,211,895 |
3,055,108 |
72.5 |
41,733.8 |
0.99 |
1.37 |
| 1999 | 100,000 |
3,885,826 |
2,869,208 |
73.8 |
39,694.9 |
1.02 |
1.38 |
| 1998 | 100,000 |
3,817,150 |
2,850,452 |
74.7 |
39,452.1 |
1.03 |
1.38 |
| 1997 | 100,000 |
3,602,189 |
2,746,477 |
76.2 |
37,660.8 |
1.05 |
1.37 |
| 1996 | 100,000 |
3,454,556 |
2,690,439 |
77.9 |
35,742.8 |
1.03 |
1.33 |
| 1995 | 100,000 |
3,318,595 |
2,663,873 |
80.3 |
28,811.5 |
0.87 |
1.08 |
| 1994 | 100,000 |
3,184,410 |
2,588,619 |
81.3 |
23,784.5 |
0.75 |
0.92 |
| 1993 | 100,000 |
3,220,302 |
2,602,781 |
80.8 |
14,277.3 |
0.44 |
0.55 |
| 1992 | 100,000 |
3,275,530 |
2,677,709 |
81.7 |
178.4 |
0.01 |
0.01 |
| 1991 | 100,000 |
3,331,312 |
2,733,387 |
82.1 |
(6,934.0) |
(0.21) |
(0.25) |
| 1990 | 100,000 |
3,415,464 |
2,784,838 |
81.5 |
4,062.7 |
0.12 |
0.15 |
| 1989 | 100,000 |
3,412,503 |
2,755,471 |
80.7 |
13,209.5 |
0.39 |
0.48 |
| 1988 | 100,000 |
2,337,080 |
1,756,771 |
75.2 |
14,061.1 |
0.60 |
0.80 |
| 1987 | 100,000 |
2,198,648 |
1,657,291 |
75.4 |
18,301.8 |
0.83 |
1.10 |
| 1986 | 100,000 |
2,162,687 |
1,636,915 |
75.7 |
18,253.3 |
0.84 |
1.12 |
| 1985 | 100,000 |
1,975,030 |
1,510,496 |
76.5 |
17,956.9 |
0.91 |
1.19 |
| 1984 | 100,000 |
1,805,334 |
1,393,421 |
77.2 |
16,529.4 |
0.92 |
1.19 |
| 1983 | 100,000 |
1,690,576 |
1,268,332 |
75.0 |
15,429.1 |
0.91 |
1.22 |
| 1982 | 100,000 |
1,544,697 |
1,134,221 |
73.4 |
13,770.9 |
0.89 |
1.21 |
| 1981 | 100,000 |
1,409,322 |
988,898 |
70.2 |
12,246.1 |
0.87 |
1.24 |
| 1980 | 100,000 |
1,324,463 |
948,717 |
71.6 |
11,019.5 |
0.83 |
1.16 |
| 1979 | 40,000 |
1,226,943 |
808,555 |
65.9 |
9,792.7 |
0.80 |
1.21 |
| 1978 | 40,000 |
1,145,835 |
760,706 |
66.4 |
8,796.0 |
0.77 |
1.16 |
| 1977 | 40,000 |
1,050,435 |
692,533 |
65.9 |
7,992.8 |
0.76 |
1.15 |
| 1976 | 40,000 |
941,923 |
628,263 |
66.7 |
7,268.8 |
0.77 |
1.16 |
| 1975 | 40,000 |
875,985 |
569,101 |
65.0 |
6,716.0 |
0.77 |
1.18 |
| 1974 | 40,000 |
833,277 |
520,309 |
62.4 |
6,124.2 |
0.73 |
1.18 |
| 1973 | 20,000 |
766,509 |
465,600 |
60.7 |
5,615.3 |
0.73 |
1.21 |
| 1972 | 20,000 |
697,480 |
419,756 |
60.2 |
5,158.7 |
0.74 |
1.23 |
| 1971 | 20,000 |
610,685 |
374,568 |
61.3 |
4,739.9 |
0.78 |
1.27 |
| 1970 | 20,000 |
545,198 |
349,581 |
64.1 |
4,379.6 |
0.80 |
1.25 |
| 1969 | 20,000 |
495,858 |
313,085 |
63.1 |
4,051.1 |
0.82 |
1.29 |
| 1968 | 15,000 |
491,513 |
296,701 |
60.4 |
3,749.2 |
0.76 |
1.26 |
| 1967 | 15,000 |
448,709 |
261,149 |
58.2 |
3,485.5 |
0.78 |
1.33 |
| 1966 | 15,000 |
401,096 |
234,150 |
58.4 |
3,252.0 |
0.81 |
1.39 |
| 1965 | 10,000 |
377,400 |
209,690 |
55.6 |
3,036.3 |
0.80 |
1.45 |
| 1964 | 10,000 |
348,981 |
191,787 |
55.0 |
2,844.7 |
0.82 |
1.48 |
| 1963 | 10,000 |
313,304 |
177,381 |
56.6 |
2,667.9 |
0.85 |
1.50 |
| 1962 | 10,000 |
297,548 |
170,210 |
57.2 |
2,502.0 |
0.84 |
1.47 |
| 1961 | 10,000 |
281,304 |
160,309 |
57.0 |
2,353.8 |
0.84 |
1.47 |
| 1960 | 10,000 |
260,495 |
149,684 |
57.5 |
2,222.2 |
0.85 |
1.48 |
| 1959 | 10,000 |
247,589 |
142,131 |
57.4 |
2,089.8 |
0.84 |
1.47 |
| 1958 | 10,000 |
242,445 |
137,698 |
56.8 |
1,965.4 |
0.81 |
1.43 |
| 1957 | 10,000 |
225,507 |
127,055 |
56.3 |
1,850.5 |
0.82 |
1.46 |
| 1956 | 10,000 |
219,393 |
121,008 |
55.2 |
1,742.1 |
0.79 |
1.44 |
| 1955 | 10,000 |
212,226 |
116,380 |
54.8 |
1,639.6 |
0.77 |
1.41 |
| 1954 | 10,000 |
203,195 |
110,973 |
54.6 |
1,542.7 |
0.76 |
1.39 |
| 1953 | 10,000 |
193,466 |
105,610 |
54.6 |
1,450.7 |
0.75 |
1.37 |
| 1952 | 10,000 |
188,142 |
101,841 |
54.1 |
1,363.5 |
0.72 |
1.34 |
| 1951 | 10,000 |
178,540 |
96,713 |
54.2 |
1,282.2 |
0.72 |
1.33 |
| 1950 | 10,000 |
167,818 |
91,359 |
54.4 |
1,243.9 |
0.74 |
1.36 |
| 1949 | 5,000 |
156,786 |
76,589 |
48.8 |
1,203.9 |
0.77 |
1.57 |
| 1948 | 5,000 |
153,454 |
75,320 |
49.1 |
1,065.9 |
0.69 |
1.42 |
| 1947 | 5,000 |
154,096 |
76,254 |
49.5 |
1,006.1 |
0.65 |
1.32 |
| 1946 | 5,000 |
148,458 |
73,759 |
49.7 |
1,058.5 |
0.71 |
1.44 |
| 1945 | 5,000 |
157,174 |
67,021 |
42.6 |
929.2 |
0.59 |
1.39 |
| 1944 | 5,000 |
134,662 |
56,398 |
41.9 |
804.3 |
0.60 |
1.43 |
| 1943 | 5,000 |
111,650 |
48,440 |
43.4 |
703.1 |
0.63 |
1.45 |
| 1942 | 5,000 |
89,869 |
32,837 |
36.5 |
616.9 |
0.69 |
1.88 |
| 1941 | 5,000 |
71,209 |
28,249 |
39.7 |
553.5 |
0.78 |
1.96 |
| 1940 | 5,000 |
65,288 |
26,638 |
40.8 |
496.0 |
0.76 |
1.86 |
| 1939 | 5,000 |
57,485 |
24,650 |
42.9 |
452.7 |
0.79 |
1.84 |
| 1938 | 5,000 |
50,791 |
23,121 |
45.5 |
420.5 |
0.83 |
1.82 |
| 1937 | 5,000 |
48,228 |
22,557 |
46.8 |
383.1 |
0.79 |
1.70 |
| 1936 | 5,000 |
50,281 |
22,330 |
44.4 |
343.4 |
0.68 |
1.54 |
| 1935 | 5,000 |
45,125 |
20,158 |
44.7 |
306.0 |
0.68 |
1.52 |
| 1934 | 5,000 |
40,060 |
18,075 |
45.1 |
291.7 |
0.73 |
1.61 |
1 For 2012, figures are as of September 30, all prior years are as of December 31. Prior to 1989, figures are for the Bank Insurance Fund (BIF) only and exclude insured branches of foreign banks. For 1989 to 2005, figures represent sum of the BIF and Savings Association Insurance Fund (SAIF) amounts; for 2006 to 2012, figures are for DIF. Amounts for 1989 - 2012 include insured branches of foreign banks. Prior to year-end 1991, insured deposits were estimated using percentages determined from June Call and Thrift Financial Reports.
2 The year-end 2008 coverage limit and estimated insured deposits do not reflect the temporary increase to $250,000 then in effect under the Emergency Economic Stabilization Act of 2008. The Dodd-Frank Wall Street Reform and Consumer Protection Act (Dodd-Frank Act) made this coverage limit permanent. The year-end 2009 coverage limit and estimated insured deposits reflect the $250,000 coverage limit. The Dodd-Frank Act also temporarily provided unlimited coverage for non-interest bearing transaction accounts for two years beginning December 31, 2010. Coverage for certain retirement accounts increased to $250,000 in 2006. Initial coverage limit was $2,500 from January 1 to June 30, 1934.
| Income and Expenses, Deposit Insurance Fund, from Beginning of Operations, September 11, 1933, through December 31, 2013 Dollars in Millions |
|||||||||||
|---|---|---|---|---|---|---|---|---|---|---|---|
| Income | Expenses and Losses | ||||||||||
| Year | Total | Assessment Income |
Assessment Credits |
Investment and Other |
Effective Assessment Rate1 |
Total | Provision for Ins. Losses | Admin. and Operating Expenses2 | Interest & Other Ins. Expenses | Funding Transfer from the FSLIC Resolution Fund | Net Income/(Loss) |
| Total | $201,686.7 |
$137,510.7 |
$11,392.9 |
$75,568.9 |
$154,785.2 |
$120,599.0 |
$24,743.1 |
$9,443.1 |
$139.5 |
$47,041.0 |
|
| 2013 | 10,458.9 |
9,734.2 |
0.0 |
724.7 |
0.0776% |
(4,045.9) |
(5,659.4) |
1,608.7 |
4.8 |
0 |
14,504.8 |
| 2012 | 18,522.3 |
12,397.2 |
0.2 |
6,125.3 |
0.1012% |
(2,599.0) |
(4,222.6) |
1,777.5 |
(153.9) |
0 |
21,121.3 |
| 2011 | 16,342.0 |
13,499.5 |
0.9 |
2,843.4 |
0.1115% |
(2,915.4) |
(4,413.6) |
1,625.4 |
(127.2) |
0 |
19,257.4 |
| 2010 | 13,379.9 |
13,611.2 |
0.8 |
(230.5) |
0.1772% |
75.0 |
(847.8) |
1,592.6 |
(669.8) |
0 |
13,304.9 |
| 2009 | 24,706.4 |
17,865.4 |
148.0 |
6,989.0 |
0.2330% |
60,709.0 |
57,711.8 |
1,271.1 |
1,726.1 |
0 |
(36,002.6) |
| 2008 | 7,306.3 |
4,410.4 |
1,445.9 |
4,341.8 |
0.0418% |
44,339.5 |
41,838.8 |
1,033.5 |
1,467.2 |
0 |
(37,033.2) |
| 2007 | 3,196.2 |
3,730.9 |
3,088.0 |
2,553.3 |
0.0093% |
1,090.9 |
95.0 |
992.6 |
3.3 |
0 |
2,105.3 |
| 2006 | 2,643.5 |
31.9 |
0.0 |
2,611.6 |
0.0005% |
904.3 |
(52.1) |
950.6 |
5.8 |
0 |
1,739.2 |
| 2005 | 2,420.5 |
60.9 |
0.0 |
2,359.6 |
0.0010% |
809.3 |
(160.2) |
965.7 |
3.8 |
0 |
1,611.2 |
| 2004 | 2,240.3 |
104.2 |
0.0 |
2,136.1 |
0.0019% |
607.6 |
(353.4) |
941.3 |
19.7 |
0 |
1,632.7 |
| 2003 | 2,173.6 |
94.8 |
0.0 |
2,078.8 |
0.0019% |
(67.7) |
(1,010.5) |
935.5 |
7.3 |
0 |
2,241.3 |
| 2002 | 2,384.7 |
107.8 |
0.0 |
2,276.9 |
0.0023% |
719.6 |
(243.0) |
945.1 |
17.5 |
0 |
1,665.1 |
| 2001 | 2,730.1 |
83.2 |
0.0 |
2,646.9 |
0.0019% |
3,123.4 |
2,199.3 |
887.9 |
36.2 |
0 |
(393.3) |
| 2000 | 2,570.1 |
64.3 |
0.0 |
2,505.8 |
0.0016% |
945.2 |
28.0 |
883.9 |
33.3 |
0 |
1,624.9 |
| 1999 | 2,416.7 |
48.4 |
0.0 |
2,368.3 |
0.0013% |
2,047.0 |
1,199.7 |
823.4 |
23.9 |
0 |
369.7 |
| 1998 | 2,584.6 |
37.0 |
0.0 |
2,547.6 |
0.0010% |
817.5 |
(5.7) |
782.6 |
40.6 |
0 |
1,767.1 |
| 1997 | 2,165.5 |
38.6 |
0.0 |
2,126.9 |
0.0011% |
247.3 |
(505.7) |
677.2 |
75.8 |
0 |
1,918.2 |
| 1996 | 7,156.8 |
5,294.2 |
0.0 |
1,862.6 |
0.1622% |
353.6 |
(417.2) |
568.3 |
202.5 |
0 |
6,803.2 |
| 1995 | 5,229.2 |
3,877.0 |
0.0 |
1,352.2 |
0.1238% |
202.2 |
(354.2) |
510.6 |
45.8 |
0 |
5,027.0 |
| 1994 | 7,682.1 |
6,722.7 |
0.0 |
959.4 |
0.2192% |
(1,825.1) |
(2,459.4) |
443.2 |
191.1 |
0 |
9,507.2 |
| 1993 | 7,354.5 |
6,682.0 |
0.0 |
672.5 |
0.2157% |
(6,744.4) |
(7,660.4) |
418.5 |
497.5 |
0 |
14,098.9 |
| 1992 | 6,479.3 |
5,758.6 |
0.0 |
720.7 |
0.1815% |
(596.8) |
(2,274.7) |
614.83 |
1,063.1 |
35.4 |
7,111.5 |
| 1991 | 5,886.5 |
5,254.0 |
0.0 |
632.5 |
0.1613% |
16,925.3 |
15,496.2 |
326.1 |
1,103.0 |
42.4 |
(10,996.4) |
| 1990 | 3,855.3 |
2,872.3 |
0.0 |
983.0 |
0.0868% |
13,059.3 |
12,133.1 |
275.6 |
650.6 |
56.1 |
(9,147.9) |
| 1989 | 3,494.8 |
1,885.0 |
0.0 |
1,609.8 |
0.0816% |
4,352.2 |
3,811.3 |
219.9 |
321.0 |
5.6 |
(851.8) |
| 1988 | 3,347.7 |
1,773.0 |
0.0 |
1,574.7 |
0.0825% |
7,588.4 |
6,298.3 |
223.9 |
1,066.2 |
0 |
(4,240.7) |
| 1987 | 3,319.4 |
1,696.0 |
0.0 |
1,623.4 |
0.0833% |
3,270.9 |
2,996.9 |
204.9 |
69.1 |
0 |
48.5 |
| 1986 | 3,260.1 |
1,516.9 |
0.0 |
1,743.2 |
0.0787% |
2,963.7 |
2,827.7 |
180.3 |
(44.3) |
0 |
296.4 |
| 1985 | 3,385.5 |
1,433.5 |
0.0 |
1,952.0 |
0.0815% |
1,957.9 |
1,569.0 |
179.2 |
209.7 |
0 |
1,427.6 |
| 1984 | 3,099.5 |
1,321.5 |
0.0 |
1,778.0 |
0.0800% |
1,999.2 |
1,633.4 |
151.2 |
214.6 |
0 |
1,100.3 |
| 1983 | 2,628.1 |
1,214.9 |
164.0 |
1,577.2 |
0.0714% |
969.9 |
675.1 |
135.7 |
159.1 |
0 |
1,658.2 |
| 1982 | 2,524.6 |
1,108.9 |
96.2 |
1,511.9 |
0.0769% |
999.8 |
126.4 |
129.9 |
743.5 |
0 |
1,524.8 |
| 1981 | 2,074.7 |
1,039.0 |
117.1 |
1,152.8 |
0.0714% |
848.1 |
320.4 |
127.2 |
400.5 |
0 |
1,226.6 |
| 1980 | 1,310.4 |
951.9 |
521.1 |
879.6 |
0.0370% |
83.6 |
(38.1) |
118.2 |
3.5 |
0 |
1,226.8 |
| 1979 | 1,090.4 |
881.0 |
524.6 |
734.0 |
0.0333% |
93.7 |
(17.2) |
106.8 |
4.1 |
0 |
996.7 |
| 1978 | 952.1 |
810.1 |
443.1 |
585.1 |
0.0385% |
148.9 |
36.5 |
103.3 |
9.1 |
0 |
803.2 |
| 1977 | 837.8 |
731.3 |
411.9 |
518.4 |
0.0370% |
113.6 |
20.8 |
89.3 |
3.5 |
0 |
724.2 |
| 1976 | 764.9 |
676.1 |
379.6 |
468.4 |
0.0370% |
212.3 |
28.0 |
180.44 |
3.9 |
0 |
552.6 |
| 1975 | 689.3 |
641.3 |
362.4 |
410.4 |
0.0357% |
97.5 |
27.6 |
67.7 |
2.2 |
0 |
591.8 |
| 1974 | 668.1 |
587.4 |
285.4 |
366.1 |
0.0435% |
159.2 |
97.9 |
59.2 |
2.1 |
0 |
508.9 |
| 1973 | 561.0 |
529.4 |
283.4 |
315.0 |
0.0385% |
108.2 |
52.5 |
54.4 |
1.3 |
0 |
452.8 |
| 1972 | 467.0 |
468.8 |
280.3 |
278.5 |
0.0333% |
65.7 |
10.1 |
49.6 |
6.05 |
0 |
401.3 |
| 1971 | 415.3 |
417.2 |
241.4 |
239.5 |
0.0345% |
60.3 |
13.4 |
46.9 |
0.0 |
0 |
355.0 |
| 1970 | 382.7 |
369.3 |
210.0 |
223.4 |
0.0357% |
46.0 |
3.8 |
42.2 |
0.0 |
0 |
336.7 |
| 1969 | 335.8 |
364.2 |
220.2 |
191.8 |
0.0333% |
34.5 |
1.0 |
33.5 |
0.0 |
0 |
301.3 |
| 1968 | 295.0 |
334.5 |
202.1 |
162.6 |
0.0333% |
29.1 |
0.1 |
29.0 |
0.0 |
0 |
265.9 |
| 1967 | 263.0 |
303.1 |
182.4 |
142.3 |
0.0333% |
27.3 |
2.9 |
24.4 |
0.0 |
0 |
235.7 |
| 1966 | 241.0 |
284.3 |
172.6 |
129.3 |
0.0323% |
19.9 |
0.1 |
19.8 |
0.0 |
0 |
221.1 |
| 1965 | 214.6 |
260.5 |
158.3 |
112.4 |
0.0323% |
22.9 |
5.2 |
17.7 |
0.0 |
0 |
191.7 |
| 1964 | 197.1 |
238.2 |
145.2 |
104.1 |
0.0323% |
18.4 |
2.9 |
15.5 |
0.0 |
0 |
178.7 |
| 1963 | 181.9 |
220.6 |
136.4 |
97.7 |
0.0313% |
15.1 |
0.7 |
14.4 |
0.0 |
0 |
166.8 |
| 1962 | 161.1 |
203.4 |
126.9 |
84.6 |
0.0313% |
13.8 |
0.1 |
13.7 |
0.0 |
0 |
147.3 |
| 1961 | 147.3 |
188.9 |
115.5 |
73.9 |
0.0323% |
14.8 |
1.6 |
13.2 |
0.0 |
0 |
132.5 |
| 1960 | 144.6 |
180.4 |
100.8 |
65.0 |
0.0370% |
12.5 |
0.1 |
12.4 |
0.0 |
0 |
132.1 |
| 1959 | 136.5 |
178.2 |
99.6 |
57.9 |
0.0370% |
12.1 |
0.2 |
11.9 |
0.0 |
0 |
124.4 |
| 1958 | 126.8 |
166.8 |
93.0 |
53.0 |
0.0370% |
11.6 |
0.0 |
11.6 |
0.0 |
0 |
115.2 |
| 1957 | 117.3 |
159.3 |
90.2 |
48.2 |
0.0357% |
9.7 |
0.1 |
9.6 |
0.0 |
0 |
107.6 |
| 1956 | 111.9 |
155.5 |
87.3 |
43.7 |
0.0370% |
9.4 |
0.3 |
9.1 |
0.0 |
0 |
102.5 |
| 1955 | 105.8 |
151.5 |
85.4 |
39.7 |
0.0370% |
9.0 |
0.3 |
8.7 |
0.0 |
0 |
96.8 |
| 1954 | 99.7 |
144.2 |
81.8 |
37.3 |
0.0357% |
7.8 |
0.1 |
7.7 |
0.0 |
0 |
91.9 |
| 1953 | 94.2 |
138.7 |
78.5 |
34.0 |
0.0357% |
7.3 |
0.1 |
7.2 |
0.0 |
0 |
86.9 |
| 1952 | 88.6 |
131.0 |
73.7 |
31.3 |
0.0370% |
7.8 |
0.8 |
7.0 |
0.0 |
0 |
80.8 |
| 1951 | 83.5 |
124.3 |
70.0 |
29.2 |
0.0370% |
6.6 |
0.0 |
6.6 |
0.0 |
0 |
76.9 |
| 1950 | 84.8 |
122.9 |
68.7 |
30.6 |
0.0370% |
7.8 |
1.4 |
6.4 |
0.0 |
0 |
77.0 |
| 1949 | 151.1 |
122.7 |
0.0 |
28.4 |
0.0833% |
6.4 |
0.3 |
6.1 |
0.0 |
0 |
144.7 |
| 1948 | 145.6 |
119.3 |
0.0 |
26.3 |
0.0833% |
7.0 |
0.7 |
6.36 |
0.0 |
0 |
138.6 |
| 1947 | 157.5 |
114.4 |
0.0 |
43.1 |
0.0833% |
9.9 |
0.1 |
9.8 |
0.0 |
0 |
147.6 |
| 1946 | 130.7 |
107.0 |
0.0 |
23.7 |
0.0833% |
10.0 |
0.1 |
9.9 |
0.0 |
0 |
120.7 |
| 1945 | 121.0 |
93.7 |
0.0 |
27.3 |
0.0833% |
9.4 |
0.1 |
9.3 |
0.0 |
0 |
111.6 |
| 1944 | 99.3 |
80.9 |
0.0 |
18.4 |
0.0833% |
9.3 |
0.1 |
9.2 |
0.0 |
0 |
90.0 |
| 1943 | 86.6 |
70.0 |
0.0 |
16.6 |
0.0833% |
9.8 |
0.2 |
9.6 |
0.0 |
0 |
76.8 |
| 1942 | 69.1 |
56.5 |
0.0 |
12.6 |
0.0833% |
10.1 |
0.5 |
9.6 |
0.0 |
0 |
59.0 |
| 1941 | 62.0 |
51.4 |
0.0 |
10.6 |
0.0833% |
10.1 |
0.6 |
9.5 |
0.0 |
0 |
51.9 |
| 1940 | 55.9 |
46.2 |
0.0 |
9.7 |
0.0833% |
12.9 |
3.5 |
9.4 |
0.0 |
0 |
43.0 |
| 1939 | 51.2 |
40.7 |
0.0 |
10.5 |
0.0833% |
16.4 |
7.2 |
9.2 |
0.0 |
0 |
34.8 |
| 1938 | 47.7 |
38.3 |
0.0 |
9.4 |
0.0833% |
11.3 |
2.5 |
8.8 |
0.0 |
0 |
36.4 |
| 1937 | 48.2 |
38.8 |
0.0 |
9.4 |
0.0833% |
12.2 |
3.7 |
8.5 |
0.0 |
0 |
36.0 |
| 1936 | 43.8 |
35.6 |
0.0 |
8.2 |
0.0833% |
10.9 |
2.6 |
8.3 |
0.0 |
0 |
32.9 |
| 1935 | 20.8 |
11.5 |
0.0 |
9.3 |
0.0833% |
11.3 |
2.8 |
8.5 |
0.0 |
0 |
9.5 |
| 1933-34 | 7.0 |
0.0 |
0.0 |
7.0 |
N/A |
10.0 |
0.2 |
9.8 |
0.0 |
0 |
(3.0) |
1Figures represent only BIF-insured institutions prior to 1990, BIF- and SAIF-insured institutions from 1990 through 2005, and DIF-insured institutions beginning in 2006. After 1995, all thrift closings became the responsibility of the FDIC and amounts are reflected in the SAIF. The effective assessment rate is calculated from annual assessment income (net of assessment credits), excluding transfers to the Financing Corporation (FICO), Resolution Funding Corporation (REFCORP) and FSLIC Resolution Fund, divided by the four quarter average assessment base. The effective rates from 1950 through 1984 varied from the statutory rate of 0.0833 percent due to assessment credits provided in those years. The statutory rate increased to 0.12 percent in 1990 and to a minimum of 0.15 percent in 1991. The effective rates in 1991 and 1992 varied because the FDIC exercised new authority to increase assessments above the statutory minimum rate when needed. Beginning in 1993, the effective rate was based on a risk-related premium system under which institutions paid assessments in the range of 0.23 percent to 0.31 percent. In May 1995, the BIF reached the mandatory recapitalization level of 1.25 percent. As a result, BIF assessment rates were reduced to a range of 0.04 percent to 0.31 percent of assessable deposits, effective June 1995, and assessments totaling $1.5 billion were refunded in September 1995. Assessment rates for the BIF were lowered again to a range of 0 to 0.27 percent of assessable deposits, effective the start of 1996. In 1996, the SAIF collected a one-time special assessment of $4.5 billion. Subsequently, assessment rates for the SAIF were lowered to the same range as the BIF, effective October 1996. This range of rates remained unchanged for both funds through 2006. As part of the implementation of the Federal Deposit Insurance Reform Act of 2005, assessment rates were increased to a range of 0.05 percent to 0.43 percent of assessable deposits effective at the start of 2007, but many institutions received a one-time assessment credit ($4.7 billion in total) to offset the new assessments. For the first quarter of 2009, assessment rates were increased to a range of 0.12 to 0.50 percent of assessable deposits. From the second quarter of 2009 through the first quarter of 2011, initial assessment rates ranged between 0.12 and 0.45 percent of assessable deposits. Initial rates are subject to further adjustments. Beginning in the second quarter of 2011, the assessment base changed to average total consolidated assets less average tangible equity (with certain adjustments for banker’s banks and custodial banks), as required by the Dodd-Frank Act. The FDIC implemented a new assessment rate schedule at the same time to conform to the larger assessment base. Initial assessment rates were lowered to a range of 0.05 to 0.35 percent of the new base. The annualized assessment rates averaged approximately 17.6 cents per $100 of assessable deposits for the first quarter of 2011 and 11.1 cents per $100 of the new base for the last three quarters of 2011 (which is the figure shown in the table). The effective assessment rate for 2012 was based on full year accrued assessment income, actual assessment base figures for the first three quarters of 2012, and an estimate for the assessment base for fourth quarter 2012. On June 30, 2009, a special assessment was imposed on all insured banks and thrifts, which amounted in aggregate to approximately $5.4 billion. For 8,106 institutions, with $9.3 trillion in assets, the special assessment was 5 basis points of each institution’s assets minus tier one capital; 89 other institutions, with assets of $4.0 trillion, had their special assessment capped at 10 basis points of their second quarter assessment base.
2These expenses, which are presented as operating expenses in the Statement of Income and Fund Balance, pertain to the FDIC in its corporate capacity only and do not include costs that are charged to the failed bank receiverships that are managed by the FDIC. The receivership expenses are presented as part of the “Receivables from Resolutions, net” line on the Balance Sheet. The narrative and graph presented on page 113 of this report shows the aggregate (corporate and receivership) expenditures of the FDIC.
3Includes $210 million for the cumulative effect of an accounting change for certain postretirement benefits (1992).
4Includes a $106 million net loss on government securities (1976).
5This amount represents interest and other insurance expenses from 1933 to 1972.
6Includes the aggregate amount of $81 million of interest paid on capital stock between 1933 and 1948.
| Number, Assets, Deposits, Losses, and Loss to Funds of Insured Thrifts Taken Over or Closed Because of Financial Difficulties, 1989 through 19951 Dollars in Thousands |
|||||
|---|---|---|---|---|---|
| Year | Total | Assets | Deposits | Estimated Receivership Loss2 | Loss to Funds3 |
| Total | 748 |
$393,986,574 |
$317,501,978 |
$75,977,713 |
$81,580,200 |
| 1995 | 2 |
423,819 |
414,692 |
28,192 |
27,750 |
| 1994 | 2 |
136,815 |
127,508 |
11,472 |
14,599 |
| 1993 | 10 |
6,147,962 |
4,881,461 |
267,595 |
65,212 |
| 1992 | 59 |
44,196,946 |
34,773,224 |
3,286,907 |
3,832,145 |
| 1991 | 144 |
78,898,904 |
65,173,122 |
9,235,967 |
9,734,263 |
| 1990 | 213 |
129,662,498 |
98,963,962 |
16,062,552 |
19,257,446 |
| 19894 | 318 |
134,519,630 |
113,168,009 |
47,085,028 |
48,648,785 |
1Beginning in 1989 through July 1, 1995, all thrift closings were the responsibility of the Resolution Trust Corporation (RTC). Since the RTC was terminated on December 31, 1995, and all assets and liabilities transferred to the FSLIC Resolution Fund (FRF), all the results of the thrift closing activity from 1989 through 1995 are now reflected on FRF’s books. Year is the year of failure, not the year of resolution.
2The estimated losses represent the projected loss at the fund level from receiverships for unreimbursed subrogated claims of the FRF and unpaid advances to receiverships from the FRF.
3The Loss to Funds represents the total resolution cost of the failed thrifts in the FRF-RTC fund, which includes corporate revenue and expense items such as interest expense on Federal Financing Bank debt, interest expense on escrowed funds, and interest revenue on advances to receiverships, in addition to the estimated losses for receiverships.
4Total for 1989 excludes nine failures of the former FSLIC.
| FDIC-Insured Institutions Closed During 2013 Dollars in Thousands |
||||||||
|---|---|---|---|---|---|---|---|---|
| Codes for Bank Class: |
||||||||
| NM = State-chartered bank that is not a member of the Federal Reserve System N = National Bank |
SB = Savings Bank SI = Stock and Mutual Savings Bank |
SM = State-chartered bank that is a member of the Federal Reserve System SA = Savings Association |
||||||
| Name and Location |
Bank Class |
Number of Deposit Accounts |
Total Assets1 |
Total Deposits1 |
Insured Deposit Funding and Other Disbursements |
Estimated Loss to the DIF2 |
Date of Closing or Acquisition |
Receiver/Assuming Bank and Location |
| Purchase and Assumption – All Deposits | ||||||||
| Sunrise Bank Valdosta, GA | NM | 2,469 |
$60,793 |
$57,775 |
$60,695 |
$16,119 |
05/10/13 |
Synovus Bank Columbus, GA |
| Community South Bank Parsons, TN |
NM | 18,041 |
$386,908 |
$377,672 |
$367,166 |
$72,494 |
08/23/13 |
CB&S Bank, Inc. Russellville, AL |
| Whole Bank Purchase and Assumption – All Deposits | ||||||||
| Westside Community Bank University Place, WA |
NM | 3,258 |
$91,935 |
$91,879 |
$94,131 |
$26,534 |
01/11/13 |
Sunwest Bank Irvine, CA |
| 1st Regents Bank Andover, MN |
NM | 1,376 |
$49,626 |
$49,147 |
$48,853 |
$16,466 |
01/18/13 |
First Minnesota Bank Minnetoka, MN |
| Covenant Bank Chicago, IL |
NM | 3,673 |
$58,422 |
$54,202 |
$55,140 |
$21,756 |
02/15/13 |
Liberty Bank and Trust Company New Orleans, LA |
| Frontier Bank La Grange, GA |
NM | 13,271 |
$258,840 |
$224,108 |
$215,689 |
$58,265 |
03/08/13 |
HeritageBank of the South Albany, GA |
| Gold Canyon Bank Gold Canyon, AZ |
SM | 1,370 |
$42,125 |
$41,728 |
$43,172 |
$11,080 |
04/05/13 |
First Scottsdale, National Association Scottsdale, AZ |
| Chipola Community Bank Marianna, FL |
NM | 1,567 |
$37,471 |
$37,067 |
$37,490 |
$10,348 |
04/19/13 |
First Federal
Bank of Florida Lake City, FL |
| First Federal Bank Lexington, KY |
SA | 5,017 |
$92,982 |
$87,196 |
$89,003 |
$10,477 |
04/19/13 |
Your Community Bank New Albany, IN |
| Heritage Bank of North Florida Orange Park, FL |
NM | 2,692 |
$103,960 |
$106,348 |
$105,923 |
$26,495 |
04/19/13 |
FirstAtlantic Bank Jacksonville, FL |
| Douglas County Bank, Douglasville, GA | NM | 15,310 |
$317,288 |
$315,326 |
$308,912 |
$91,392 |
04/26/13 |
Hamilton State Bank Hoschton, GA |
| Parkway Bank Lenoir, NC |
NM | 6,035 |
$109,642 |
$104,709 |
$108,519 |
$18,623 |
04/26/13 |
CertusBank, National Association Easley, SC |
| Pisgah Community Bank Asheville, NC |
NM | 587 |
$21,880 |
$21,246 |
$22,975 |
$9,708 |
05/10/13 |
Capital Bank, National Association Rockville, MD |
| Central Arizona Bank Scottsdale, AZ |
NM | 1,006 |
$31,550 |
$30,822 |
$28,922 |
$8,645 |
05/14/13 |
Western State Bank Devils Lake, ND |
| Banks of Wisconsin d/b/a Bank of Kenosha Kenosha, WI |
NM | 7,008 |
$34,024 |
$127,590 |
$127,946 |
$19,763 |
05/31/13 |
North Shore Bank, FSB Brookfield, WI |
| 1st Commerce Bank North Las Vegas, NV |
NM | 242 |
$20,152 |
$19,579 |
$21,891 |
$9,880 |
06/06/13 |
Plaza Bank Irvine, CA |
| Mountain National Bank Sevierville, TN |
N | 16,725 |
$437,282 |
$373,366 |
$376,858 |
$27,106 |
06/07/13 |
First Tennessee Bank, National Association Memphis, TN |
| First Community Bank of Southwest Florida Fort Myers, FL |
NM | 9,715 |
$247,315 |
$243,618 |
$239,309 |
$27,077 |
08/02/13 |
C1 Bank Saint Petersburg, FL |
| Bank of Wausau Wausau, WI |
NM | 1,465 |
$43,564 |
$40,663 |
$44,292 |
$13,500 |
08/09/13 |
Nicolet National Bank Green Bay, WI |
| Sunrise Bank of Arizona Phoenix, AZ |
NM | 5,430 |
$202,179 |
$196,924 |
$188,521 |
$17,049 |
08/23/13 |
First Fidelity Bank, National Association Oklahoma City, OK |
| First National Bank Edinburg, TX |
N | 89,508 |
$3,085,764 |
$2,338,335 |
$2,225,494 |
$637,523 |
09/13/13 |
Plains Capital Bank Dallas, TX |
| Bank of Jackson County Graceville, FL |
NM | 2,491 |
$24,724 |
$24,591 |
$25,405 |
$5,074 |
10/30/13 |
First Federal Bank of Florida Lake City, FL |
| Texas Community Bank, National Association The Woodlands, TX |
NM | 2,160 |
$159,257 |
$142,640 |
$118,657 |
$10,765 |
12/13/13 |
Spirit of Texas Bank, SSB College Station, TX |
| Insured Deposit Payoff | ||||||||
| The Community’s Bank Bridgeport, CT |
NM | 1,049 |
$26,368 |
$25,715 |
$38,002 |
$7,800 |
7,800 |
Federal Deposit Insurance Corporation |
1Total Assets and Total Deposits data are based upon the last Call Report filed by the institution prior to failure.
2Estimated losses are as of 12/31/12. Estimated losses are routinely adjusted with updated information from new appraisals and asset sales, which ultimately affect the asset values and projected recoveries. Represents the estimated loss to the DIF from deposit insurance obligations. This amount does not include the estimated loss allocable to the Transaction Account Guarantee and Debt Guarantee Program claims.
| Recoveries and Losses by the Deposit Insurance Fund on Disbursements for the Protection of Depositors, 1934 – 2013 Dollars in Thousands |
|||||||
|---|---|---|---|---|---|---|---|
| Bank and Thrift Failures1 | |||||||
| Year2 | Number of Banks/ Thrifts |
Total Assets3 | Total Deposits3 | Insured Deposit Funding and Other Disbursements | Recoveries | Estimated Additional Recoveries | Estimated Losses |
2,584 |
$931,664,951 |
$700,668,975 |
$577,938,885 |
$399,685,827 |
$59,761,118 |
$118,491,940 |
|
| 2013 | 24 |
6,044,051 |
5,132,246 |
4,992,965 |
0 |
3,819,026 |
1,173,939 |
| 2012 | 51 |
11,617,348 |
11,009,630 |
11,074,800 |
1,201,587 |
7,069,516 |
2,803,697 |
| 2011 | 92 |
34,922,997 |
31,071,862 |
31,782,065 |
2,617,454 |
21,479,949 |
7,571,752 |
| 20104 | 157 |
92,084,987 |
78,290,185 |
82,240,983 |
51,181,613 |
10,097,143 |
20,962,227 |
| 20094 | 140 |
169,709,160 |
137,783,121 |
136,331,221 |
88,529,446 |
14,462,095 |
33,339,680 |
| 20084 | 25 |
371,945,480 |
234,321,715 |
205,495,557 |
183,834,032 |
2,229,312 |
19,432,213 |
| 2007 | 3 |
2,614,928 |
2,424,187 |
1,918,810 |
1,369,413 |
380,982 |
168,415 |
| 2006 | 0 |
0 |
0 |
0 |
0 |
0 |
0 |
| 2005 | 0 |
0 |
0 |
0 |
0 |
0 |
0 |
| 2004 | 4 |
170,099 |
156,733 |
138,971 |
134,978 |
76 |
3,917 |
| 2003 | 3 |
947,317 |
901,978 |
883,772 |
812,933 |
8,192 |
62,647 |
| 2002 | 11 |
2,872,720 |
2,512,834 |
2,127,249 |
1,704,030 |
7,655 |
415,564 |
| 2001 | 4 |
1,821,760 |
1,661,214 |
1,605,612 |
1,128,577 |
184,384 |
292,651 |
| 2000 | 7 |
410,160 |
342,584 |
297,313 |
265,175 |
0 |
32,138 |
| 1999 | 8 |
1,592,189 |
1,320,573 |
1,307,442 |
711,758 |
5,674 |
590,010 |
| 1998 | 3 |
290,238 |
260,675 |
292,691 |
58,248 |
11,752 |
222,691 |
| 1997 | 1 |
27,923 |
27,511 |
25,546 |
20,520 |
0 |
5,026 |
| 1996 | 6 |
232,634 |
230,390 |
201,533 |
140,918 |
0 |
60,615 |
| 1995 | 6 |
802,124 |
776,387 |
609,043 |
524,571 |
0 |
84,472 |
| 1994 | 13 |
1,463,874 |
1,397,018 |
1,224,769 |
1,045,718 |
0 |
179,051 |
| 1993 | 41 |
3,828,939 |
3,509,341 |
3,841,658 |
3,209,012 |
0 |
632,646 |
| 1992 | 120 |
45,357,237 |
39,921,310 |
14,541,316 |
10,866,760 |
543 |
3,674,013 |
| 1991 | 124 |
64,556,512 |
52,972,034 |
21,499,567 |
15,500,130 |
4,819 |
5,994,618 |
| 1990 | 168 |
16,923,462 |
15,124,454 |
10,812,484 |
8,040,995 |
0 |
2,771,489 |
| 1989 | 206 |
28,930,572 |
24,152,468 |
11,443,281 |
5,247,995 |
0 |
6,195,286 |
| 1988 | 200 |
38,402,475 |
26,524,014 |
10,432,655 |
5,055,158 |
0 |
5,377,497 |
| 1987 | 184 |
6,928,889 |
6,599,180 |
4,876,994 |
3,014,502 |
0 |
1,862,492 |
| 1986 | 138 |
7,356,544 |
6,638,903 |
4,632,121 |
2,949,583 |
0 |
1,682,538 |
| 1985 | 116 |
3,090,897 |
2,889,801 |
2,154,955 |
1,506,776 |
0 |
648,179 |
| 1984 | 78 |
2,962,179 |
2,665,797 |
2,165,036 |
1,641,157 |
0 |
523,879 |
| 1983 | 44 |
3,580,132 |
2,832,184 |
3,042,392 |
1,973,037 |
0 |
1,069,355 |
| 1982 | 32 |
1,213,316 |
1,056,483 |
545,612 |
419,825 |
0 |
125,787 |
| 1981 | 7 |
108,749 |
100,154 |
114,944 |
105,956 |
0 |
8,988 |
| 1980 | 10 |
239,316 |
219,890 |
152,355 |
121,675 |
0 |
30,680 |
| 1934 - 1979 | 558 |
8,615,743 |
5,842,119 |
5,133,173 |
4,752,295 |
0 |
380,878 |
| Assistance Transactions | |||||||
| Year2 | Number of Banks/ Thrifts | Total Assets3 | Total Deposits3 | Insured Deposit Funding and Other Disbursements | Recoveries | Estimated Additional Recoveries | Estimated Losses |
154 |
$3,317,099,253 |
$1,442,173,417 |
$11,630,356 |
$6,199,875 |
$0 |
$5,430,481 |
|
| 2013 | 0 |
0 |
0 |
0 |
0 |
0 |
0 |
| 2012 | 0 |
0 |
0 |
0 |
0 |
0 |
0 |
| 2011 | 0 |
0 |
0 |
0 |
0 |
0 |
0 |
| 2010 | 0 |
0 |
0 |
0 |
0 |
0 |
0 |
| 20095 | 8 |
1,917,482,183 |
1,090,318,282 |
0 |
0 |
0 |
0 |
| 20085 | 5 |
1,306,041,994 |
280,806,966 |
0 |
0 |
0 |
0 |
| 2007 | 0 |
0 |
0 |
0 |
0 |
0 |
0 |
| 2006 | 0 |
0 |
0 |
0 |
0 |
0 |
0 |
| 2005 | 0 |
0 |
0 |
0 |
0 |
0 |
0 |
| 2004 | 0 |
0 |
0 |
0 |
0 |
0 |
0 |
| 2003 | 0 |
0 |
0 |
0 |
0 |
0 |
0 |
| 2002 | 0 |
0 |
0 |
0 |
0 |
0 |
0 |
| 2001 | 0 |
0 |
0 |
0 |
0 |
0 |
0 |
| 2000 | 0 |
0 |
0 |
0 |
0 |
0 |
0 |
| 1999 | 0 |
0 |
0 |
0 |
0 |
0 |
0 |
| 1998 | 0 |
0 |
0 |
0 |
0 |
0 |
0 |
| 1997 | 0 |
0 |
0 |
0 |
0 |
0 |
0 |
| 1996 | 0 |
0 |
0 |
0 |
0 |
0 |
0 |
| 1995 | 0 |
0 |
0 |
0 |
0 |
0 |
0 |
| 1994 | 0 |
0 |
0 |
0 |
0 |
0 |
0 |
| 1993 | 0 |
0 |
0 |
0 |
0 |
0 |
0 |
| 1992 | 2 |
33,831 |
33,117 |
1,486 |
1,236 |
0 |
250 |
| 1991 | 3 |
78,524 |
75,720 |
6,117 |
3,093 |
0 |
3,024 |
| 1990 | 1 |
14,206 |
14,628 |
4,935 |
2,597 |
0 |
2,338 |
| 1989 | 1 |
4,438 |
6,396 |
2,548 |
252 |
0 |
2,296 |
| 1988 | 80 |
15,493,939 |
11,793,702 |
1,730,351 |
189,709 |
0 |
1,540,642 |
| 1987 | 19 |
2,478,124 |
2,275,642 |
160,877 |
713 |
0 |
160,164 |
| 1986 | 7 |
712,558 |
585,248 |
158,848 |
65,669 |
0 |
93,179 |
| 1985 | 4 |
5,886,381 |
5,580,359 |
765,732 |
406,676 |
0 |
359,056 |
| 1984 | 2 |
40,470,332 |
29,088,247 |
5,531,179 |
4,414,904 |
0 |
1,116,275 |
| 1983 | 4 |
3,611,549 |
3,011,406 |
764,690 |
427,007 |
0 |
337,683 |
| 1982 | 10 |
10,509,286 |
9,118,382 |
1,729,538 |
686,754 |
0 |
1,042,784 |
| 1981 | 3 |
4,838,612 |
3,914,268 |
774,055 |
1,265 |
0 |
772,790 |
| 1980 | 1 |
7,953,042 |
5,001,755 |
0 |
0 |
0 |
0 |
| 1934 - 1979 | 4 |
1,490,254 |
549,299 |
0 |
0 |
0 |
0 |
1Institutions closed by the FDIC, including deposit payoff, insured deposit transfer, and deposit assumption cases.
2For 1990 through 2005, amounts represent the sum of BIF and SAIF failures (excluding those handled by the RTC); prior to 1990, figures are only for the BIF. After 1995, all thrift closings became the responsibility of the FDIC and amounts are reflected in the SAIF. For 2006 to 2012, figures are for the DIF.
3Assets and deposit data are based on the last Call Report or TFR filed before failure.
4Includes amounts related to transaction account coverage under the Transaction Account Guarantee Program (TAG). The estimated losses as of 12/31/13 for TAG accounts in 2010, 2009, and 2008 are $519 million, $1,526 million, and $15 million, respectively.
5Includes institutions where assistance was provided under a systemic risk determination. Any costs that exceed the amounts estimated under the least cost resolution requirement would be recovered through a special assessment on all FDIC-insured institutions.