2. Financial Highlights
Deposit Insurance Fund Performance
The FDIC administers the Deposit Insurance Fund (DIF) and the FSLIC Resolution Fund (FRF), which fulfills the obligations of the former Federal Savings and Loan Insurance Corporation (FSLIC) and the former Resolution Trust Corporation (RTC). The following summarizes the condition of the DIF. (See the accompanying graphs on FDIC-Insured Deposits and Insurance Fund Reserve Ratios on the following page.)
For 2011, the DIF’s comprehensive income totaled $19.2 billion compared to comprehensive income of $13.5 billion during 2010. This $5.7 billion year-over-year increase was primarily due to a $3.6 billion decrease in the provision for insurance losses and $2.6 billion in revenue from DGP fees previously held as systemic risk deferred revenue, partially offset by a year-to-date net change in the fair value of available-for-sale securities of $284 million (U.S. Treasury obligations and trust preferred securities) and a $112 million decrease in assessments earned.
The provision for insurance losses was negative $4.4 billion for 2011, compared to negative $848 million for 2010. The negative provision for 2011 primarily resulted from a reduction in the contingent loss reserve due to the improvement in the financial condition of institutions that were previously identified to fail, and a reduction in the estimated losses for institutions that have failed in prior years.
The DIF’s total liquidity declined by $3.8 billion, or 8 percent, to $42.4 billion during 2011. The decrease was primarily the result of disbursing $11.9 billion to fund both current and prior years’ bank failures during 2011. However, it should be noted that 58 of the 92 current year failures were resolved as cash-conserving shared-loss transactions requiring substantially lower initial resolution payments thus helping to mitigate the decline in DIF’s liquidity balance. Moreover, during 2011, the DIF received $8.9 billion in dividends and other payments from its receiverships, which helped to mitigate the DIF liquidity’s decline.
| ESTIMATED DIF INSURED DEPOSITS |
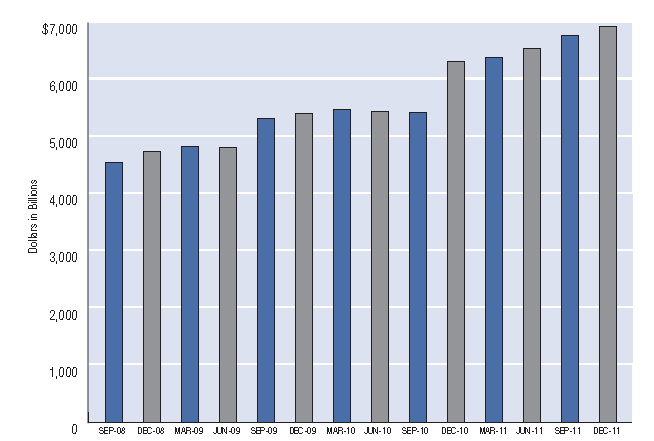 |
SOURCE: Commercial Bank
Call and Thrift Financial Reports
Note: Beginning in the fourth quarter of 2010, estimated insured deposits include the entire balance of noninterest-bearing transaction accounts.
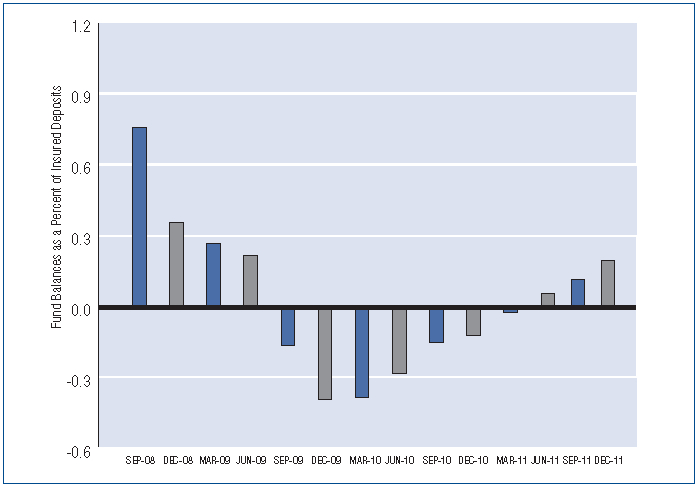
| DEPOSIT INSURANCE FUND RESERVE RATIOS |
 |
Deposit Insurance Fund Selected Statistics
Dollars in Millions
|
For the years ended December 31 |
| |
2011 |
2010 |
2009 |
| Financial Results |
| Revenue |
$16,342 |
$13,380 |
$24,706 |
| Operating Expenses |
1,625 |
1,593 |
1,271 |
Insurance and Other Expenses
(includes provision for loss) |
(4,541) |
(1,518) |
59,438 |
| Net Income (Loss) |
19,257 |
13,305 |
(36,003) |
| Comprehensive Income (Loss) |
19,179 |
13,510 |
(38,138) |
| Insurance Fund Balance |
$11,827 |
$(7,352) |
$(20,862) |
| Fund as a Percentage of Insured Deposits (reserve ratio) |
0.17 % |
(0.12) % |
(0.39) % |
| Selected Statistics |
| Total DIF-Member Institutions¹ |
7,357 |
7,657 |
8,012 |
| Problem Institutions |
813 |
884 |
702 |
| Total Assets of Problem Institutions |
$319,432 |
$390,017 |
$402,782 |
| Institution Failures |
92 |
157 |
140 |
| Total Assets of Failed Institutions in Year² |
$34,923 |
$92,085 |
$169,709 |
| Number of Active Failed Institution Receiverships |
426 |
336 |
179 |
|


