2004 Annual Report Highlights
II. Financial Statements
Deposit Insurance Fund Performance
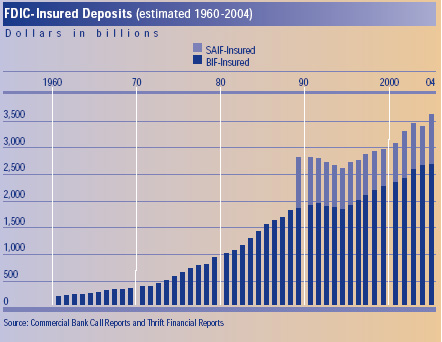
The FDIC administers two deposit insurance funds – the Bank Insurance Fund (BIF) and the Savings Association Insurance Fund (SAIF) – and manages the FSLIC Resolution Fund (FRF), which fulfills the obligations of the former Federal Savings and Loan Insurance Corporation (FSLIC) and the former Resolution Trust Corporation (RTC). The following summarizes the condition of the FDIC’s insurance funds.
The BIF reported comprehensive income (net income plus current period unrealized gains /losses on available-for-sale securities) of $1 billion for the twelve months ending December 31, 2004, compared to $1.7 billion for the same period in the prior year. This reduction was primarily due to an increase in unrealized losses on available-for-sale securities of $102 million and a reduction in net income of $625 million. The decline in net income primarily resulted from a smaller negative adjustment of $269 million to the provision for losses at December 31, 2004, compared to a negative $931 million adjustment for the same period last year. BIF’s provision for losses negative adjustments were mostly attributable to the reduction of estimated losses for future and actual failures. As of December 31, 2004, the fund balance was $34.8 billion, up from $33.8 billion at year-end 2003.
The SAIF reported comprehensive income of $480 million for the twelve months ending December 31, 2004, compared to $493 million for the same period in the prior year. This reduction of $13 million was primarily due to slightly lower earnings on U.S.Treasury obligations whereby a $30 million increase in unrealized losses was partially offset by a $23 million increase in interest revenue.
As of December 31, 2004, the fund balance was $12.7 billion, up from $12.2 billion at year-end 2003.
Operating Expenses
Corporate Operating Budget expenses totaled $1.004 billion in 2004, including $986 million in ongoing operations and $18 million for receivership funding. This represented approximately 97 percent of the approved budget on ongoing operations and 24 percent of the approved budget for receivership funding. Receivership funding expenses were down significantly from 2003 because the four financial institution failures in 2004 were relatively small banks.
In December 2004, the Board of Directors approved a 2005 Corporate Operating Budget of approximately $1.1 billion, including just over $1.0 billion for ongoing operations. The level of approved spending in the 2005 budget remains virtually the same as that in 2004 due to continuing efforts to identify operational efficiencies and control costs. The Corporate Operating Budget includes funding for a number of major new initiatives, including funding for a Hispanic financial literacy program, and hiring additional financial analysts and risk modeling specialists to prepare for implementation of the Basel Capital Accord.
 d
d
Investment Spending
The FDIC has a disciplined process for reviewing proposed new capital investment projects and managing the implementation of approved projects. Most of the projects in the current investment portfolio are major IT system initiatives.
Proposed projects are carefully reviewed to ensure that they are consistent with the Corporation’s enterprise architecture and include an appropriate return on investment for the insurance funds. The process also enables the FDIC to be aware of risks to the major capital investment projects and facilitates appropriate, timely intervention to address these risks throughout the development process. An investment portfolio performance review of the major capital investments is provided to the FDIC’s Board of Directors quarterly. During 2004, the Board of Directors approved only one new investment project, a new Web-based time and attendance reporting system. Additional spending was also approved for three existing investment projects: (1) Legal Integrated Management System increased by $1.4 million to $5.06 million, (2) New Financial Environment increased $17 million to $51.8 million, and (3) ViSION increased $6.2 million to $12.7 million.
Bank Insurance Fund Balance Sheets at December 31, condensed
Dollars in Thousands |
| |
2004 |
2003 |
| Assets |
| Cash and cash equivalents |
$ 1,822,005 1,822,005 |
$2,544,281 |
| Investment in U.S. Treasury obligations, net: |
| Held-to-maturity securities |
22,637,330 |
16,293,073 |
| Available-for-sale securities |
9,470,605 |
14,209,773 |
| Interest receivable on investments and other assets, net |
601,498 |
550,999 |
| Receivables from bank resolutions, net |
375,303 |
511,089 |
| Property and equipment, net |
357,106 |
287,380 |
| Total Assets |
$35,263,847 |
$34,396,595 |
| Liabilities |
| Accounts payable and other liabilities |
$268,680 |
$231,441 |
| Contingent liabilities for: |
| Anticipated failure of insured institutions |
8,261 |
178,266 |
| Litigation losses and other |
200,301 |
204,693 |
| Total Liabilities |
477,242 |
614,400 |
| Commitments and off-balance-sheet exposure |
| Fund Balance |
| Accumulated net income |
34,096,676 |
32,979,898 |
| Unrealized gain on available-for-sale securities, net |
689,929 |
802,297 |
| Total Fund Balance |
34,786,605 |
33,782,195 |
| Total Liabilities and Fund Balance |
$ 35,263,847 35,263,847 |
$34,396,595 |
Bank Insurance Fund Statements of Income and Fund Balance for the Years Ended
December 31, condensed
Dollars in Thousands |
| |
2004 |
2003 |
| Revenue |
| Interest on U.S. Treasury obligations |
$1,552,576 |
$1,530,014 |
| Assessments |
95,268 |
80,159 |
| Other revenue |
27,553 |
15,831 |
| Total Revenue |
1,675,397 |
1,626,004 |
| Expenses and Losses |
| Operating expenses |
822,381 |
805,496 |
| Provision for insurance losses |
(269,368) |
(931,164) |
| Insurance and other expenses |
5,606 |
9,945 |
| Total Expenses and Losses |
558,619 |
(115,723) |
| Net Income |
1,116,778 |
1,741,727 |
| Unrealized loss on available-for-sale securities, net |
(112,368) |
(9,872) |
| Comprehensive Income |
1,004,410 |
1,731,855 |
| Fund Balance - Beginning |
33,782,195 |
32,050,340 |
| Fund Balance - Ending |
$34,786,605 |
$33,782,195 |
Bank Insurance Fund Statement of Cash Flows for the Years Ended December 31, condensed
Dollars in Thousands |
| |
2004 |
2003 |
| Operating Activities |
| Net Income: |
$1,116,778 |
$1,741,727 |
| Adjustments to reconcile net income to net cash provided by operating activities: |
| Amortization of U.S. Treasury obligations |
737,439 |
455,628 |
| Treasury inflation-indexed securities (TIIS) inflation adjustment |
(181,650) |
(115,150) |
| Depreciation on property and equipment |
54,424 |
54,947 |
| Provision for losses |
(269,368) |
(931,164) |
| Terminations/adjustments of work-in-process accounts |
817 |
92 |
| Change In Operating Assets and Liabilities: |
| (Increase) in interest receivable and other assets |
(36,433) |
(69,826) |
| Decrease in receivables from bank resolutions |
218,693 |
102,663 |
| Increase in accounts payable and other liabilities |
15,819 |
85,577 |
| (Decrease) in contingent liabilities for litigation losses and other |
(1,047) |
(25,367) |
| Net Cash Provided by Operating Activities |
1,655,472 |
1,299,127 |
| Investing Activities |
| Provided by: |
| Maturity of U.S. Treasury obligations, held-to-maturity |
3,365,000 |
3,890,000 |
| Maturity of U.S. Treasury obligations, available-for-sale |
5,810,000 |
1,690,000 |
| Used by: |
| Purchase of property and equipment |
(104,502) |
(41,804) |
| Purchase of U.S. Treasury obligations, held-to-maturity |
(10,026,597) |
(3,659,868) |
| Purchase of U.S. Treasury obligations, available-for-sale |
(1,421,649) |
(5,240,070) |
| Net Cash Used by Investing Activities |
(2,377,748) |
(3,361,742) |
| Net Decrease in Cash and Cash Equivalents |
(722,276) |
(2,062,615) |
| Cash and Cash Equivalents - Beginning |
2,544,281 |
4,606,896 |
| Cash and Cash Equivalents - Ending |
$1,822,005 |
$2,544,281 |
Savings Association Insurance Fund Balance Sheet at December 31, condensed
Dollars in Thousands |
| |
2004 |
2003 |
| Assets |
| Cash and cash equivalents |
$644,346 |
$827,141 |
| Cash and other assets: Restricted for SAIF-member exit fees(Includes cash and cash equivalents of $56.5 million and $231.9 million at December 31, 2004 and 2003, respectively) |
328,394 |
319,286 |
| Investment in U.S. Treasury obligations, net:
|
| Held-to-maturity securities |
8,835,964 |
6,823,709 |
| Available-for-sale securities |
2,720,315 |
4,152,048 |
| Interest receivable on investments and other assets, net |
200,204 |
188,189 |
| Receivables from thrift resolutions, net |
346,923 |
273,242 |
| Total Assets |
$13,076,146 |
$12,583,615 |
| Liabilities |
| Accounts payable and other liabilities |
$25,568 |
$20,540 |
| Contingent liabilities for: |
| Anticipated failure of insured institutions |
1,957 |
3,192 |
| Litigation losses |
39 |
532 |
| SAIF-member exit fees and investment proceeds held in escrow |
328,394 |
319,286 |
| Total Liabilities |
355,958 |
343,550 |
| Commitments and off-balance-sheet exposure |
| Fund Balance |
| Accumulated net income |
12,482,227 |
11,965,776 |
| Unrealized gain on available-for-sale securities, net |
237,961 |
274,289 |
| Total Fund Balance |
12,720,188 |
12,240,065 |
| Total Liabilities and Fund Balance |
$13,076,146
|
$12,583,615
|
Savings Association Insurance Fund Statement of Income and Fund Balance for the Years Ended December 31, condensed
Dollars in Thousands |
| |
2004 |
2003 |
| Revenue |
| Interest on U.S. Treasury obligations |
$555,592 |
$532,474 |
| Assessments |
8,891 |
14,594 |
| Other revenue |
292 |
192 |
| Total Revenue |
564,775 |
547,260 |
| Expenses and Losses |
| Operating expenses |
120,282 |
129,584 |
| Provision for insurance losses |
(72,162) |
(82,489) |
| Insurance and other expenses |
204 |
105 |
| Total Expenses and Losses |
48,324 |
47,200 |
| Net Income |
516,451 |
500,060 |
| Unrealized loss on available-for-sale securities, net |
(36,328) |
(6,733) |
| Comprehensive Income |
480,123 |
493,327 |
| Fund Balance - Beginning |
12,240,065 |
11,746,738 |
| Fund Balance - Ending |
$12,720,188 |
$12,240,065 |
Savings Association Insurance Fund Statement of Cash Flows for the Years Ended December 31, condensed
Dollars in Thousands |
| |
2004 |
2003 |
| Operating Activities |
| Net Income: |
$516,451 |
$500,060 |
| Adjustments to reconcile net income to net cash provided by operating activities: |
| Amortization of U.S. Treasury obligations |
262,317 |
155,992 |
| Treasury inflation-indexed securities (TIIS) inflation adjustment |
(61,431) |
(38,943) |
| Provision for losses |
(72,162) |
(82,489) |
| Change in Operating Assets and Liabilities: |
Decrease in unamortized premium and discount of U.S. Treasury
Obligations (restricted) |
2,443 |
931 |
(Increase) in entrance and exit fees receivable, including interest
receivable on investments and other assets |
(16,288) |
(32,810) |
| (Increase)/Decrease in receivables from thrift resolutions |
(2,635) |
8,699 |
| Increase in accounts payable and other liabilities |
5,028 |
13,440 |
| (Decrease) in contingent liabilities for litigation losses |
0 |
(209) |
| Increase in exit fees and investment proceeds held in escrow |
9,107 |
7,422 |
| Net Cash Provided by Operating Activities |
642,830 |
532,093 |
| Investing Activities |
| Provided by: |
| Maturity of U.S. Treasury obligations, held-to-maturity |
1,690,000 |
1,170,000 |
| Maturity of U.S. Treasury obligations, available-for-sale |
1,360,000 |
575,000 |
| Used by: |
| Purchase of U.S. Treasury obligations, held-to-maturity |
(4,051,084) |
(2,305,056) |
| Purchase of U.S. Treasury obligations, available-for-sale |
0 |
(1,008,066) |
| Net Cash Used by Investing Activities |
(1,001,084) |
(1,568,122) |
| Net Decrease in Cash and Cash Equivalents |
(358,254) |
(1,036,029) |
| Cash and Cash Equivalents - Beginning |
1,059,052 |
2,095,081 |
| Unrestricted Cash and Cash Equivalents - Ending |
$644,346 |
$827,141 |
| Restricted Cash and Cash Equivalents - Ending |
$56,452 |
$231,911 |
| Cash and Cash Equivalents - Ending |
$700,798 |
$1,059,052 |
FSLIC Resolution Fund Balance Sheets at December 31, condensed
Dollars in Thousands |
| |
2004 |
2003 |
| Assets |
| Cash and cash equivalents |
$3,501,387 |
$3,278,532 |
| Receivables from thrift resolutions and other assets, net |
82,275 |
198,432 |
| Total Assets |
$3,583,662 |
$3,476,964 |
| Liabilities |
| Accounts payable and other liabilities |
$5,606 |
$19,381 |
| Contingent liabilities for litigation losses and other |
410 |
1,169 |
| Total Liabilities |
6,016 |
20,550 |
| Resolution Equity |
| Contributed capital |
126,382,877 |
126,377,851 |
| Accumulated deficit |
(122,805,158) |
(122,962,936) |
| Unrealized (loss)/gain on available-for-sale securities, net |
(73) |
41,499 |
| Accumulated deficit, net |
(122,805,231) |
(122,921,437) |
| Total Resolution Equity |
3,577,646 |
3,456,414 |
| Total Liabilities and Resolution Equity |
$3,583,662 |
$3,476,964 |
FSLIC Resolution Fund Statements of Income and Accumulated Deficit for the Years Ended December 31, condensed
Dollars in Thousands |
| |
2004 |
2003 |
| Revenue |
| Interest on U.S. Treasury obligations |
$40,076 |
$32,902 |
| Realized gain on investment in securitization-related assets acquired from receiverships |
66,708 |
756 |
| Other revenue |
21,114 |
16,849 |
| Total Revenue |
127,898 |
50,507 |
| Expenses and Losses |
| Operating expenses |
22,932 |
27,828 |
| Provision for losses |
(6,911) |
(33,306) |
| Expenses for goodwill settlements and litigation |
31,632 |
15,324 |
| Recovery of tax benefits |
(82,937) |
(19,609) |
| Other expenses |
5,404 |
7,933 |
| Total Expenses and Losses |
(29,880) |
(1,830) |
| Net Income |
157,778 |
52,337 |
| Unrealized loss on available-for-sale securities, net |
(41,572) |
(1,258) |
| Comprehensive Income |
116,206 |
51,079 |
| Accumulated Deficit - Beginning |
(122,921,437) |
(122,972,516) |
| Accumulated Deficit - Ending |
$(122,805,231) |
$(122,921,437) |
FSLIC Resolution Fund Statements of Cash Flows for the Years Ended December 31, condensed
Dollars in Thousands |
| |
2004 |
2003 |
| Operating Activities |
| Net Income: |
$157,778 |
$52,337 |
| Adjustments to reconcile net income to net cash provided by operating activities: |
| Provision of losses |
(6,911) |
(33,306) |
| Change in Assets and Liabilities:
|
| (Increase)/Decrease in receivables from thrift resolutions and other assets |
(35,238) |
(80,339) |
| (Decrease)/Increase in accounts payable and other liabilities |
(13,775) |
4,973 |
| Net Cash Provided by Operating Activities |
101,854 |
104,343 |
| Investing Activities |
| Investment in securitization-related assets acquired from receiverships |
115,975 |
5,829 |
| Net Cash Provided by Investing Activities |
115,975 |
5,829 |
| Financing Activities |
| Provided by: |
| U.S.Treasury payments for goodwill settlements |
5,026 |
30 |
| Used by: |
| Payments to Resolution Funding Corporation |
0 |
(450,000) |
| Net Cash Provided/(Used) by Financing Activities |
5,026 |
(449,970) |
| |
| Net Increase/(Decrease) in Cash and Cash Equivalents |
222,855 |
(339,798) |
| Cash and Cash Equivalents - Beginning |
3,278,532 |
3,618,330 |
| Cash and Cash Equivalents - Ending |
$3,501,387 |
$3,278,532 |


